1 State Key Laboratory of Earth Surface Processes and Resource Ecology, Beijing Normal University, Beijing 100875, China
2 Future Earth Research Institute, Beijing Normal University Zhuhai, Zhuhai 519087, China
*Corresponding author: CHOU Jie-Ming,
choujm@bnu.edu.cn
1 IntroductionConsiderable international effort has been directed to coping with global climate change. Since the end of 2009, China has considered CO2 abatement to be a binding target of the long-term plan for national economic and social development. This means a 40%-50% decrease in CO2 emissions per Gross Domestic Product (GDP) in 2020 compared to that in 2005. In addition, China has an abatement target for 2015 of a 16% decline in energy consumption per GDP and a 17% decline in CO2 emissions per GDP (The State Council, 2013). In 2014, China and America struck a deal to limit the emissions of greenhouse gases. China, the world’ s biggest emitter of greenhouse gases, pledged in a far-reaching agreement to cap its rapidly growing carbon emissions by 2030, or earlier if possible. It also set a daunting goal of increasing the share of non-fossil fuels to 20% of the country’ s energy mix by 2030, which implies that CO2 emissions reduction in China will switch from compulsory reduction to total emissions reduction after 2030. The difficulty with achieving CO2 abatement from now until 2030 is to coordinate the strength reduction with total emissions reduction.
China aims to gradually transition to a low carbon economy through a series of carbon reduction policies that involve eliminating outdated production capacity, optimizing energy structure, developing low carbon technologies, and increasing carbon sequestration (Chou et al., 2011). In particular, seven carbon trading pilot schemes, in Beijing, Tianjin, Shanghai, Chongqing, and Shenzhen cities, and Hubei, and Guangdong provinces, have been launched since June 2014 (National Development and Reform Commission, 2011), to promote the following: (1) the use of carbon market mechanisms at a lower cost; (2) to achieve the 2020 abatement target of controlling greenhouse gas emissions; (3) to accelerate transformation of economic development; and (4) to upgrade industrial structure. The carbon reduction policies for the carbon trading pilot schemes in these regions are more comprehensive than those in other cities or provinces, which do not have mandatory carbon trading schemes (Lo, 2013). The question is, can a series of carbon reduction policies achieve the targeted CO2 abatement in China? Answering this requires a quantitative study of the contribution of CO2 reduction as a result of these policies (Krause, 2005; Wara, 2007; Guo, 2011; Newell et al., 2013; Du et al., 2014; Fu et al., 2014), but this has not yet received much attention.
These carbon reduction policies have the potential to influence CO2 abatement as they have been applied within the scope of national development strategies from the end of 2009, and because CO2 emissions from 2010 to 2012 serve as the important reference for the seven carbon trading pilot schemes to issue carbon emissions quotas. This article evaluates the contribution of carbon reduction policies to six of the carbon trading schemes, with a focus on regional comparison. We excluded Shenzhen, as the CO2 emissions data were unavailable. We calculated the actual and predicted CO2 from 1995 to 2012 using the Intergovernmental Panel on Climate Change (IPCC) carbon emissions accounting method and a support vector machine (SVM) model, which considered four impact indicators: GDP, population, urbanization, and total energy consumption.
2 Data and methods2.1 Actual CO2 based on the IPCC carbon emissions accounting method As official CO2 emissions data are unavailable for China, we used the CO2 data calculated by the widely recognized IPCC carbon emissions accounting method as the actual CO2 in the six carbon trading pilot schemes (Zhu, 2013). The CO2 emissions in a specific area equal the statistical energy categories multiplied by the corresponding energy emissions factors. We put forward two assumptions in the calculation involved in energy processing and conversion: (1) The whole process is regarded as a purely physical form of conversion without oxidation chemistry, and we ignore the processes of coking, oil refining, and gas and coal production. (2) The statistical energy categories include energy losses, heat and power generation, and terminal energy consumption.
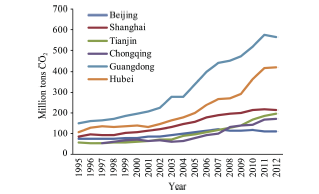
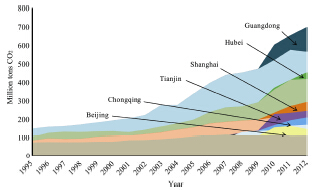
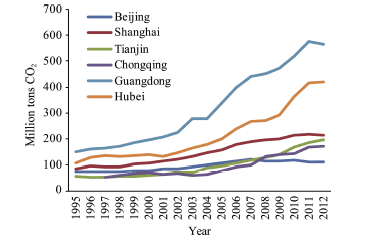
The energy category data come from the energy balance tables of five carbon trading pilot schemes from 1995 to 2012. Chongqing was established as a municipality in 1997, so for this region we adopted the energy balance table from 1997 to 2012. The energy emissions factors were selected from the IPCC and China Energy Statistics Yearbooks from 1995 to 2012. Figure 1 shows the historical CO2 emissions (million tons) of the six carbon trading pilot schemes from 1995 to 2012.
The historical cumulative CO2 was calculated for Beijing (1719.72 Mt), Shanghai (2646.12 Mt), Tianjin (1762.90 Mt), Chongqing (1525.58 Mt), Guangdong (5770.66 Mt), and Hubei (3856.89 Mt). Data for the four impact indicators (CO2, GDP, population, and urbanization) closely related to the total energy consumption were obtained from the China Statistical Yearbook from 1996 to 2013.
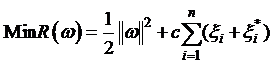
2.2 Predicted CO2 based on the SVM method SVM is a data mining method widely used in pattern recognition, function estimation, and time series forecasting (Wang and Men, 2013). With regard to climate change research, SVM is mainly applied in the field of energy economics. We aimed to simulate and predict CO2 emissions using the SVM method. SVM is based on the Vapnik-Chervonenkis dimension, as well as on the principle of structural risk minimization. The algorithm finds an appropriate and optimal separating hyperplane that converts a nonlinear problem in low-dimensional space into a linear problem in high-dimensional space. The regression function is
 , (1)
, (1)
where x is the data in the space, y is the output of the regression function, ω is the parameter set obtained by learning, b is a threshold, and  denotes the nonlinear mapping. We introduced the risk function R(ω ) into Eq. (1) by accounting for complexity and the fitting error. Thus, we obtained the functional equations
 , (2)
, (2)
and subject to
 (3)
(3)
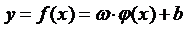
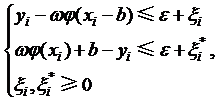
where ||ω||2 describes the complexity of a linear function and c > 0 is the penalty coefficient. ξ i and ξ*i are the slack variables whose values actually mark out how far the corresponding points are away from the target points, and ε represents insensitive coefficients. To solve the above quadratic programming problems, we introduced the Lagrangian function as follows, assuming ai as the Lagrange multiplier and ai* as the dual variable:
 . (4)
. (4)
The kernel function K(x, xi), satisfying the Mercer condition, converts the nonlinear problem in low-dimensional space into a linear problem in high-dimensional space. We obtained the ultimate decision function as follows:
 . (5)
. (5)
We divided the historical time scale into two parts: one from 1995 to 2009 and the other from 2010 to 2012. We defined the former part as the historical CO2 simulation sample and the latter as the future CO2 predicted sample. Chongqing was approved as a municipality in 1997, hence the former part for this region was from 1997 to 2009. The reason for the division of the time scale is that carbon reduction policies will exert their potential influence from 2010, as mentioned before. To calculate the actual CO2 emission, f(x), we input the four impact indicators (GDP, population, urbanization, and total energy consumption) as x into Eq. (5). We considered data from 1995 to 2009 as the input samples using the SVM method to predict the actual amount of CO2 emissions from 2010 to 2012. Actual CO2 and predicted CO2 are shown in Table 1.
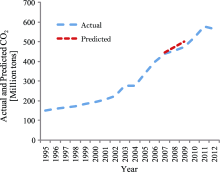
We also provided the calibration analysis of SVM applied to predict the CO2 before we used the predicted CO2 from 2010 to 2012 to evaluate the contribution of carbon reduction policies. The whole time series data were divided into two samples; the first, called the learning sample, was from 1995 to 2006, while the second, called the verification sample, was from 2007 to 2009. We needed to verify whether the data from 2007 to 2009 could fit the true value. Due to the limited space, we only provide the simulated data in Guangdong, which contains the world’ s largest carbon trading market, depicted in Fig. 2. We conclude that the predicted CO2 from 2007 to 2009 is approaching the actual value versus CO2 from 2010 to 2012 significantly larger than the actual value. Not only do the divergences confirm that an SVM applied to predict the historical CO2 has favorable simulated results, but also that mandatory carbon reduction policies did indeed make a theoretical contribution to CO2 abatement from 2010, as mentioned previously. We apply some factors to evaluate the SVM model, that is MAE, RMSE, and E. Of the above factors, E stands for the Nash-Sutcliffe Efficiency Coefficient, which is calculated as
 (6)
(6)
Proposed by Nash and Sutcliffe (1970), the coefficient is defined as one minus the sum of the absolute squared differences between the predicted (Pi) and observed values (Oi) normalized by the variance of the observed values during the period under investigation. Omeanstands for the average of the observed values. The range of E lies between 1.0 (perfect fit) and -∞ .
Table 1
Table 1
 Table 1 Actual CO2 and predicted CO2 (million tons) in six carbon trading schemes.| Year | Area |
|---|
| Beijing | Shanghai | Tianjin | Chongqing | Guangdong | Hubei |
|---|
| Predicted | Actual | Predicted | Actual | Predicted | Actual | Predicted | Actual | Predicted | Actual | Predicted | Actual | | 2010 | 157.43 | 118.43 | 236.05 | 211.91 | 227.09 | 166.17 | 168.57 | 142.61 | 603.57 | 520.64 | 372.40 | 362.56 | | 2011 | 165.02 | 109.17 | 272.50 | 216.85 | 234.51 | 185.12 | 194.49 | 166.62 | 655.20 | 576.21 | 415.29 | 415.89 | | 2012 | 149.36 | 109.93 | 293.50 | 212.51 | 243.80 | 194.97 | 209.19 | 171.17 | 698.04 | 566.06 | 455.24 | 420.17 |
| Table 1 Actual CO2 and predicted CO2 (million tons) in six carbon trading schemes. |
The mean predicted, MAE, RMSE, and E are 473.7527Mt, 18.3791Mt, 20.5125Mt, and -1.317369 respectively. The parameters of the model contains Kernel function which is RBF, penalty coefficient which is 10000, ||ω||2 which is 111.8012, support vectors which are 12 as well as elapsed time which is 1.2286 second.
We drew the conclusion that the SVM could be applied to predict CO2 and produce favorable simulated results by means of multiple evaluating indicators.
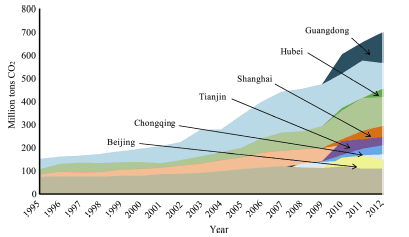
3 ResultsWe assumed that the predicted CO2 was the emissions in the absence of the reduction policies, whereas the actual CO2 was the emissions after implementation of the comprehensive carbon reduction policies. Therefore, the CO2 reduction was obtained by subtracting the predicted from the actual CO2. The size of the CO2 reduction in the six carbon trading pilot schemes is depicted by arrows in Fig. 3.
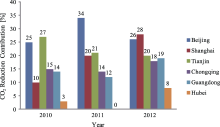
The results clearly show that carbon reduction policies could achieve their purpose, which is CO2 abatement. The actual CO2 was lower than the predicted CO2 after implementation of the carbon reduction policies. However, the contribution of policies to CO2 abatement varied among regions. To further consider the effects of regional policies, Fig. 4 shows that CO2 reduction in Tianjin in 2010 was 27%, which was the highest contribution. The contribution to reduced CO2 descends in the order Beijing, Chongqing, Guangdong, and Shanghai. The effects of policies in Hubei were the smallest over the three years. The most effective carbon trading pilot scheme was Beijing in 2011 and Shanghai in 2012. The average contribution by policies to CO2 reduction from 2010 to 2012 was, in descending order: Beijing (28.3%), Tianjin (22.7%), Shanghai (19.3%), Chongqing (15.7%), Guangdong (15%), and Hubei (3.7%).
We compared the contributions to CO2 abatement in the six carbon trading pilot schemes. The effects on municipality pilot schemes were greater than on provincial pilot schemes. The reasons may be: (1) CO2 emissions are influenced by many factors, such as industrial structure, energy consumption, and economic performance. The proportion of secondary industry in the four municipalities was relatively lower than in Guangdong and Hubei provinces. The proportion of secondary industry in Hubei was almost 44%, meaning that the pressure of CO2 abatement in Hubei was more arduous than in the other five carbon trading pilot regions. (2) The six regions all launched carbon trading schemes, but there were differences among the schemes. The trading systems in Guangdong and Hubei provinces covered more carbon emissions sources and more companies with mandatory CO2 reduction. Carbon reduction policies in Hubei did not highlight their CO2 abatement effects. (3) There were a decreasing number of high-energy-consuming enterprises in the four municipalities. Among the high-energy-consuming companies, some companies aimed to develop low- carbon technology, while others relocated from the cities to surrounding undeveloped areas. The pilot schemes reduced their CO2 emissions, but increased the amount of CO2 in other areas. This transfer of industries may not lower CO2 emissions and energy consumption when considered at the national scale, and may in fact increase emissions in China. This phenomenon is called “ carbon leakage” (Qi, 2014). Carbon reduction in the carbon trading pilot regions can be achieved, although it is difficult to achieve the targets for national CO2 abatement.
4 SummaryThe aim of this study was to assess and compare the contribution of CO2 reduction policies for six pilot carbon trading schemes in regions of China. The actual CO2 was calculated using the IPCC carbon emissions accounting method, and an SVM model was applied to simulate the predicted CO2. We found that carbon reduction policies can achieve CO2 abatement, and that the contribution of policies to CO2 abatement varied among regions, whereby the effects on municipality pilot schemes were greater than on provincial pilot schemes.
However, this study focused on the overall carbon reduction policies, including elimination of backward production capacity, optimization of energy structure, development of low-carbon technologies, and enhancement of carbon sequestration. Quantifying the contribution of a single carbon reduction policy to CO2 abatement will be a core problem in future research. For example, if we calculate the contribution of the carbon trading scheme to CO2 abatement, we might find solutions to the perennial problem of whether the carbon market, which is the dominant policy paradigm to cope with climate change, can achieve CO2 abatement at the designated lower cost. The results of such a calculation might improve the existing carbon market and lay a solid foundation for the national carbon market in China. Besides, as the limited acquisition of official CO2 data in a relatively long time series, the data we used in this paper only cover the sequence from 1995 to 2012. The SVM model would have better simulated results if the time series of official CO2 could be extended, which means the more learning samples in the SVM, the better. Furthermore, predicted CO2 in 2020 or 2030 could provide a theoretical basis for setting regional or national CO2 reduction targets. This will be the focus of our next study.
During the 13th Five-Year Plan for the future, China should continue to strive toward controlling total CO2 emissions and coal consumption, while continuing to implement binding targets of decreased energy consumption and decreased CO2 emissions per GDP (Wang and Zheng, 2013; Dong et al., 2014). At the same time, establishing linking systems (Qi et al., 2013; Pang and Zhou, 2014) among the carbon market schemes and avoiding “ carbon leakage” will enable China to establish a unified carbon market as well as implement a macro strategy in response to the challenge of global climate change.


 , DONG Wen-Jie