

Enhancement of Winter Arctic Warming by the Siberian High over the Past Decade
[FENG Chuan, WU Bing-Yi*  ]
]
]
|
|


In recent decades the Arctic surface air temperature (SAT) in autumn has been increasing steadily. In winter, however, instead of a linear trend, the Arctic SAT shows an abrupt change that occurred in 2004. During the years from 1979 to 2003, the first principle component (PC1) of winter Arctic SAT remains stable, and no significant increasing trend is detected. However, the PC1 changes abruptly from negative to positive phase in the winter of 2004. The enhanced Siberian high may have contributed to this abrupt change because the temporal evolution of Arctic temperature correlates significantly with sea level pressure variation in the northern Eurasian continent, and the atmospheric circulation anomaly related to the Siberian high from 2004 to 2013 favors a warmer Arctic. With the help of the meridional wind anomaly around the Siberian high, warmer air is transported to the high latitudes and therefore increases the Arctic temperature.
The rise in Arctic surface air temperature (SAT) has been almost twice as large as the whole Northern Hemisphere during recent decades (Serreze and Francis, 2006; Serreze et al., 2009; Screen and Simmonds, 2010a)— a phenomenon known as Arctic amplification. Various factors have been shown to have an influence on this rapid warming process, among which the decrease in sea ice is thought to play a key role. In summer, the diminishing sea ice extent leads to excessive absorption of solar radiation into the ocean (Perovich et al., 2008; Steele et al., 2008). This anomalous energy is released back to the atmosphere in autumn (Screen and Simmonds, 2010b), heating the lower troposphere (Serreze et al., 2009). This process could delay the refreezing of the sea ice and reduces ice growth (Markus et al., 2009), leading to a thinning of the sea ice and an enhancement of sea ice melting in summer. This feedback loop results in a longer melting season and further warming in the Arctic area.
Many studies have investigated the influence of the Arctic, especially its sea ice, on the midlatitudes, such as the increase in mean surface temperature and precipitation (Thompson and Wallace, 1998; Parkinson et al., 2001; Singarayer et al., 2006), the warm-Arctic-cold-Siberia anomaly (Inoue et al., 2012), the East Asian winter monsoon (Wu et al., 1999), and the general circulation of the atmosphere across other regions of the Northern Hemisphere from the Arctic to the tropics (Chiang et al., 2003; Chiang and Bitz, 2005). However, few studies have focused on whether midlatitude atmospheric circulation is one of the factors that influence Arctic temperature. In this paper, we investigate the influence of the circulation around the Siberian high on the Arctic warming.
We apply the EOF to winter mean SAT in the Arctic and find that the variation of the first principle component (PC1) does not show a linear increasing trend but, rather, an abrupt change. The area-weighted mean SAT of winter Arctic also changed abruptly in the same year. This paper aims to investigate the possible relationship between the shift of winter Arctic SAT and midlatitude atmospheric circulation, and a possible mechanism— variation in the Siberian high influencing the Arctic SAT— is suggested.
The ERA-Interim reanalysis dataset is the latest global atmospheric reanalysis produced by the European Centre for Medium-Range Weather Forecasts (ECMWF) (Dee and Uppala, 2009). The data used in this study include monthly mean SAT (2 m), sea level pressure (SLP), the 500 hPa geopotential height field, surface sensible heat flux, surface moisture flux, and the wind field from 1000 hPa to 500 hPa, covering the period since 1979. All the data are averages of three winter months (December-January-February; DJF). Furthermore, the Japanese 25-year reanalysis dataset (JRA-25) is used to confirm the abrupt change in SAT.
In addition to the EOF, other statistical techniques such as regression analysis and singular value decomposition (SVD) analysis, are applied in this study. The abrupt change detection methods used include the moving t-test and Mann-Kendall (MK) test.
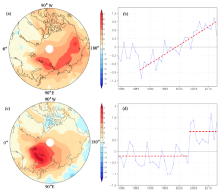
The EOF analysis is applied to the seasonal mean SAT of the Arctic (area north of 65° N excluding the North Pole) from 1979 to 2013. The first three EOFs are separated from each other and other EOFs. Figure 1a shows the spatial distribution of EOF1 in autumn. The pattern presents a latitudinal center of action band to the north of Eurasia, which explains 45.6% of the variance. The corresponding time series (PC1) is characterized by an obvious upward trend since 1987 (Fig. 1b), though the trend in recent years is less significant. For the winter SAT, meanwhile, the spatial distribution of the leading mode (EOF1), which explains 43.3% of the variance, is a mono-pole pattern (Fig. 1c). Its center is located in the northern Barents Sea, which is in good agreement with the area where the warming is most amplified, as reported by Screen and Simmonds (2010b). Importantly, the PC1 of winter SAT shifts from negative to positive phase in 2004, which implies an abrupt change might occur between 2003 and 2004, i.e., the average SAT before and after 2004 may differ significantly.
 | Figure 1 (a) The leading mode of the Arctic surface air temperature (SAT)(units: ° C) in autumn; (b) the first principle component (PC1) of Arctic SAT in autumn; (c) the leading mode of Arctic SAT in winter; (d) the PC1 of Arctic SAT in winter. |
To verify this inference, the MK test and moving t-test are applied to the PC1 of winter Arctic SAT. The result of the MK test (Fig. 2a) demonstrates a significant (at the 95% confidence level) abrupt change occurring in 2004. The results of the moving t-test (Fig. 2b) further confirm the winter of 2004 to be a turning point at the 99% confidence level. The same tests are applied to the PC1 of the JRA-25 data. The trend in autumn and the turning point in winter are exactly the same between the JRA-25 data and the ERA-Interim data.
Previous studies have documented that the increasing oceanic heat loss could influence Arctic temperature (Screen and Simmonds, 2010b). The evidence includes the spatial coherence between the surface temperature trends and surface heat flux trends. The heat that is restored in the ocean in summer is released back to the lower atmosphere when the sea ice recovers (Serreze et al., 2007). The greater input of solar radiation in summer results in a stronger heating in the following months (Serreze and Francis, 2006; Serreze et al., 2009; Screen and Simmonds, 2010a). However, with the ERA-Interim data, the area-weighted upward heat flux of the northern Barents Sea in winter— in the domain of (75-80° N, 25-70° E)— shows no corresponding abrupt change (not shown). Therefore, it can be inferred that the variation in upward heat flux is not responsible for the abrupt change in Arctic SAT.
To explore the possible dynamical linkages between winter Arctic SAT and midlatitude circulation, the winter SLP field and 500 hPa geopotential height field is regressed on the time series of the PC1 of winter Arctic SAT. Figure 3a shows distinct positive correlation between the Arctic SAT and the SLP in northern and northeastern Eurasia. Also, in Fig. 3b, the significantly correlated area in the 500 hPa geopotential height field is mainly located over the Kara Sea and northern Eurasia, which is in agreement with the result for the SLP field. This implies a possible interaction between the Siberian high and the Arctic SAT. The correlation efficient between the PC1 and Siberian high index— defined as the weighted averaged winter SLP in the domain (55-70° N, 45-75° E)— is 0.6, which further indicates that the Arctic temperature and the intensity of Siberian high are strongly correlated (Fig. 2c). The correlation coefficient is 0.59 if the trend is removed.
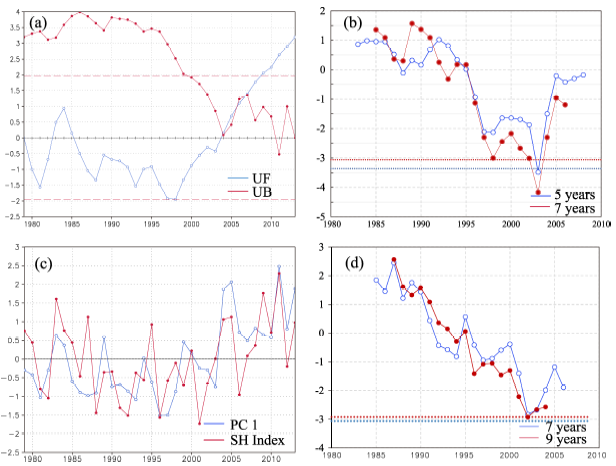 | Figure 2 (a) Mann-Kendall (MK) test and (b) moving t-test of PC1; (c) standardized anomalies of PC1 and Siberian high index; and (d) moving t-test of the Siberian high index. Dashed lines in (a) represent significance at the 95% confidence level. Dashed lines in (b, d) represent statistical significance at the 99% confidence level. |
In addition, SVD is applied to certify the correlation between winter Arctic SAT and SLP in Eurasia (20-87.5° N, 0° -150° E). Similar to EOF1, the leading mode of the winter Arctic SAT (left field) is dominated by positive anomalies, while the leading mode of the SLP field (right field) exhibits a mono-pole distribution whose center is located over northern Eurasia (not shown). These patterns demonstrate that, in a statistical sense, the northward shift and enhancement of the Siberian high favors a warmer Arctic. Although the spatial distribution of the anomalies in the winter SAT slightly differs from EOF1, it is able to demonstrate a significant correlation between the Arctic SAT and variation in the Siberian high.
 | Figure 3 Regression modes of the (a) sea level pressure (SLP) field and (b) 500 hPa geopotential height field on the PC1 of winter Arctic SAT. Light blue and yellow coloring indicates statistical significance at the 95% confidence level, while dark blue and orange coloring indicates significance at the 99% confidence level. |
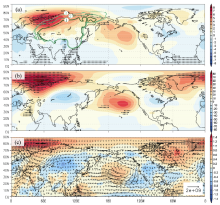
The Siberian high also changes significantly when the PC1 of the winter Arctic SAT moves into positive phase at the beginning of the 21st century. The moving t-test is applied to the time series of the Siberian high index and the results are shown in Fig. 2d. A significant abrupt change in the intensity of the Siberian high occurs in the year 2003— one year earlier than that of the change in winter Arctic SAT. The result of the seven-year moving t-test reaches the 99% confidence level, while the nine-year test exceeds the 95% confidence level. The climatological mean of the extent of the Siberian high (defined as the 1020 hPa isobar) is represented by line 1 in Fig. 4a. When the Siberian high index is in negative phase (1979-2002), the mean extent of the Siberian high is relatively limited. When it turns to positive phase, the corresponding mean extent of the Siberian high extends (line 2 in Fig. 4a) and the SLP in northern Siberia increases significantly (area covered by black dots in Fig. 4a). In particular, in extremely warm years (2004, 2005, 2011, and 2013, when the variation of PC1 is more than 1.5 standard deviations larger than the average), the mean extent is largest compared with that of the other period of time (line 3, Fig. 4a). The positive anomaly in the SLP field and 500 hPa geopotential height field between 2003-2013 and 1979-2002 is located in the northwest of the Eurasian continent, which is shown in Figs. 4a and 4b. These anomalies represent a significant change in the mid-troposphere circulation over northern Eurasia since 2003. The atmospheric circulation related to the enhanced Siberian high may lead to a warmer Arctic by increasing the meridional wind, and therefore enhances the heat and energy exchange between the Arctic and the midlatitudes.
 | Figure 4 Differences in (a) mean SLP (color scale; units: hPa) between 2003-2013 and 1979-2002, (b) mean 500 hPa geopotential height (color scale; units: gpm) between 2003-2013 and 1979-2002, and (c) total energy (color scale; units: 107 J m-2) between 2004-2013 and 1979-2003. Stippling indicates statistical significance at the 99% confidence level in (a, b), but 99.9% in (c). Line 1 represents the climatological mean 1020 hPa isobar; line 2 represents the 10-year mean 1020 hPa isobar from 2004-2013; line 3 represents the four-year mean 1020 hPa isobar of 2004, 2005, 2011, and 2013. Arrows in (c) represent differences of total energy transport anomalies (J m-1s-1) weighted by the cosine of latitude during the two periods of time. |
Figure 4c shows how the energy is transported by the atmospheric circulation anomalies. The atmospheric internal, latent, potential, and kinetic energy per unit mass of air (I, H, Φ , and k) are defined as
I=CpT, (1)
H=Lq, (2)
Φ =gz, (3)
 (4)
(4)
The sum of these quantities yields the total energy per unit mass of air. The total energy for a unit column of air from 1000 hPa to 500 hPa is given by
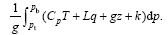 (5)
(5)
The transport of the total energy for a unit column of air from 1000 hPa to 500 hPa is given by
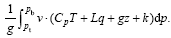 (6)
(6)
In equations above, Cp, T, L, q, z, and v represent the specific heat capacity at constant pressure, temperature, latent heat transfer coefficient, specific humidity, height, and wind velocity vector, respectively; while pt and pb represent 500 hPa and 1000 hPa respectively. The shading in Fig. 4c represents the differences in total energy, and the arrows represent the differences in total energy transport, between 1979-2003 and 2004-2013. The total energy of the atmosphere in the domain of the North Atlantic has increases after 2003. It should also be noted that the interdecadal change of total energy in the area over the Barents Sea occurs in the following year, as shown by the stippling in Fig. 4c. The transport of the total energy weighted by the cosine of latitude (arrows in Fig. 4c) around the Barents Sea is in an anticyclone pattern, which is obviously related to the Siberian high anomaly. Besides, a cyclone pattern of the total energy transport anomaly exists over the Mediterranean Sea. These anomalies convey warmer air from the low- and midlatitudes to the arctic, and therefore increase the SAT in high latitudes.
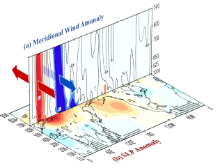
A profile along 65° N illustrates the dramatic change in the meridional circulation since 2004. As shown in Fig. 5, the meridional wind around the Siberian high anomaly is enhanced dramatically. To the west of the SLP anomaly, a significant southerly wind anomaly exists from the ground to the mid-troposphere, while a northerly wind anomaly exists to the east of the anomaly. The energy transport from the midlatitudes to the Arctic is therefore enhanced. As the location of the southerly wind anomaly is near the west coast of the Atlantic Ocean, where the temperature is relatively high, this strong warm advection transports excessive warm air from the midlatitudes to the Arctic, increases the winter Arctic SAT and contributes to the abrupt change in 2004.
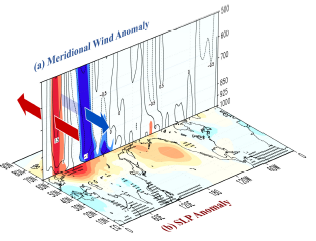 | Figure 5 (a) Meridional wind anomaly along 65° N and (b) the corresponding SLP anomaly field (units: hPa) after 2004. Orange and light blue coloring in (a) indicates statistical significance at the 95% confidence level; red and dark blue coloring indicates significance at the 99% confidence level. Stippling in (b) indicates significance at the 99% confidence level. |
This work provides evidence to support the idea that midlatitude circulation could influence the temporal evolution of winter Arctic SAT. By applying the MK test and moving t-test to the PC1 of winter Arctic SAT, we detect an abrupt change in 2004. To verify the role that midlatitude circulation plays in this change, we begin by confirming the significant relationship between the winter Arctic SAT and the Siberian high by regression analysis and SVD analysis. Then, a corresponding abrupt change in the Siberian high index in 2003 is detected. This change leads to an enhanced meridional wind anomaly around the Siberian high, which is related to an increase in total energy in the Arctic area. The PC1 of winter Arctic SAT moves into positive phase in the following year. Finally, we conclude that the atmospheric circulation anomalies in Northwest Eurasia are favorable for a warmer Arctic. Under the influence of warm advection to the west of the enhanced Siberian high, warm and moist air with massive energy in the midlatitudes is transported to the Arctic area, leading to the increase in Arctic SAT.
Graversen (2006) also investigated the associations between Arctic SAT and midlatitude circulation, and noted that the Arctic SAT is sensitive to variation in midlatitude circulation. Large energy transport usually leads to warming in the following days, especially in the North Atlantic and Pacific sectors. In subsequent work, Graveson et al. (2008) examined the Arctic temperature trends throughout the troposphere as well. They concluded that variation in Arctic temperature is largely caused by horizontal heat flux convergence, not surface forcing, but this was criticized for problems in the data and the limited time period from 1979 to 2001 (Bitz and Fu, 2008; Grant et al., 2008; Thorne, 2008). However, the evidence for the contribution of atmospheric circulation is undeniable. For example, Yang et al. (2010) argued that, in the Arctic, 50% of the decadal warming trend centered in the late 1990s was induced by the increasing poleward energy transport.
On the other hand, previous studies have also investigated the factors that influence the intensity of the Siberian high. North Atlantic sea surface temperature (SST) anomalies in the autumn are thought to play a role in forming winter blocking-like anomalies over the Ural Mountains (Li, 2004), which could result in a strengthened winter Siberian high (Takaya and Nakamuta, 2005). Also, the increasing trend of autumn regional-averaged snow water equivalent (40-60° N, 60-140° E) after 1990 favors the enhancement of the Siberian high (Cohen and Entekhabi, 1999). Wu et al. (2011) documented that the winter Siberian high intensity index shows significant negative correlation with the autumn-winter Arctic sea ice concentration (SIC) in the eastern Arctic and Eurasian marginal seas. The study indicated that both the autumn-winter Arctic SIC and SST anomalies are causes of the winter SH anomalies, which is also supported by numerical experiments. Another possible mechanism for the enhancement of the Siberian high was studied in the work of Jaiser et al. (2012, 2013) and Cohen et al. (2013). Their results showed that the reduction of autumn Arctic sea ice cover may force an atmospheric response through increased snow cover in the Eurasian continent (Cohen et al., 2013) or altered baroclinicity and high pressure around the Barents and Kara seas that forces upward Eliassen-Palm fluxes into the stratosphere. Additional stratospheric heat flux in the polar stratosphere interacts with the stratospheric polar vortex and can trigger a stratospheric warming event. The circulation anomalies that are related to the stratospheric warming propagate back to the surface in the following weeks, contributing to persistent negative North Atlantic Oscillation Oscillation/Arctic Oscillation conditions (Jaiser et al., 2012, 2013). The enhancement of the Siberian high may relate to these factors.
However, the ERA-Interim dataset, which is used in our study, also covers a relatively short time span (1979-2013). Besides, although midlatitude atmospheric circulation influences the winter Arctic SAT, our findings indicate that circulation alone is not enough to explain the variation in Arctic SAT. For example, the Arctic SAT in the winter of 2006 is relatively warm, but the Siberian high is weak, which means other processes also play an important role. Previous studies have investigated the effect from other processes such as the local radiative effects from increased greenhouse gas forcing (Gillett et al., 2008; Stroeve et al., 2012), variation in snow- and ice-albedo feedback caused by a diminishing cryosphere (Winton, 2006; Serreze and Barry, 2011; Screen et al., 2012), and changes in Arctic cloud cover and water vapor content (Francis and Hunter, 2006; Graversen and Wang, 2009; Intrieri et al., 2002). Further study and discussion are still needed to assess the influences of different processes on the Arctic amplification.
| 1 |
|
| 2 |
|
| 3 |
|
| 4 |
|
| 5 |
|
| 6 |
|
| 7 |
|
| 8 |
|
| 9 |
|
| 10 |
|
| 11 |
|
| 12 |
|
| 13 |
|
| 14 |
|
| 15 |
|
| 16 |
|
| 17 |
|
| 18 |
|
| 19 |
|
| 20 |
|
| 21 |
|
| 22 |
|
| 23 |
|
| 24 |
|
| 25 |
|
| 26 |
|
| 27 |
|
| 28 |
|
| 29 |
|
| 30 |
|
| 31 |
|
| 32 |
|
| 33 |
|
| 34 |
|
| 35 |
|
| 36 |
|
| 37 |
|