LIU Chuan-Xi, LIU Yi, ZHANG Yu-Li. Simulation of the Madden-Julian Oscillation in Wintertime Stratospheric Ozone over the Tibetan Plateau and East Asia: Results from the Specified Dynamics Version of the Whole Atmosphere Community Climate Model. Atmospheric and Oceanic Science Letters, 2015, 8(5): 264-270
Permissions
Copyright?2015, Editorial office of Atmospheric and Oceanic Science Letters
This is an Open Access article under the terms of CCAL.
Simulation of the Madden-Julian Oscillation in Wintertime Stratospheric Ozone over the Tibetan Plateau and East Asia: Results from the Specified Dynamics Version of the Whole Atmosphere Community Climate Model
LIU Chuan-Xi1,3, LIU Yi1,3, ZHANG Yu-Li1,2,3
1 State Key Laboratory of Numerical Modeling for Atmospheric Sciences and Geophysical Fluid Dynamics, Institute of Atmospheric Physics, Chinese Academy of Sciences, Beijing 100029, China 2 University of Chinese Academy of Sciences, Beijing 100049, China 3 Key Laboratory of Middle Atmosphere and Global Environment Observation (LAGEO), Institute of Atmospheric Physics, Chinese Academy of Sciences, Beijing 100029, China
The authors examined the Madden-Julian Oscillation (MJO) in stratospheric ozone during boreal winter using a simulation from the Specified Dynamics version of the Whole Atmosphere Community Climate Model (SD-WACCM) in 2004 and 2010. Comparison with European Centre for Medium-Range Weather Forecasts Interim Reanalysis (ERA-Interim) data suggested that the model simulation represented well the three-dimensional structure of the MJO-related ozone anomalies in the upper troposphere and stratosphere (i.e., between 200 and 20 hPa). The negative ozone anomalies were over the Tibetan Plateau and East Asia in MJO phases 3-7, when the MJO convective anomalies travelled from the equatorial Indian Ocean towards the equatorial western Pacific Ocean. Due to the different vertical structures of the MJO-related circulation anomalies, the MJO-related stratospheric ozone anomalies showed different vertical structure over the Tibetan Plateau (25-40°N, 75-105°E) and East Asia (25-40°N, 105-135°E). As a result of the positive bias in the model-calculated ozone in the upper troposphere and lower stratosphere, the amplitude of MJO-related stratospheric ozone column anomalies (10-16 Dobson Units (DU)) in the SD-WACCM simulation was slightly larger than that (8-14 DU) in the ERA-Interim reanalysis.
The Madden-Julian Oscillation (MJO) is a dominant form of intraseasonal variability (30-60 days) in the tropical troposphere, especially during boreal winter (December-February) when the Indo-Pacific warm pool is centered near the equator. The MJO is a large-scale coupled pattern that propagates eastward at approximately 5 m s-1 through the atmosphere above the warm tropical waters in the equatorial Indian and western Pacific oceans (e.g., Madden and Julian, 1971, 1972). The eastward-propagating oscillation in tropical deep convection is coupled with a baroclinic structure of the anomalous wind field (e.g., Lau and Waliser, 2012). The MJO interacts with a wide range of high-impact weather and climate phenomena (e.g., tropical cyclones, El Niñ o-Southern Oscillation, monsoon migration) (e.g., Zhang, 2005, 2013). Recent studies have suggested that the MJO can even disturb the winter stratospheric polar vortex, leading to stratospheric sudden warming events (e.g., Garfinkel et al., 2012; Liu et al., 2014). As a result, the MJO is believed to play a critical role in connecting or bridging the gap between weather forecasting and climate prediction (e.g., Zhang, 2013).
Satellite measurements have been used to examine the footprints of the MJO in atmospheric composition (e.g., Tian and Waliser, 2012). Sabutis et al. (1987) first reported evidence of 30- to 50-day variability in total column ozone from the Nimbus-7 Total Ozone Mapping Spectrometer (TOMS) over specific locations in the southeast Pacific and southern Indian oceans. Gao and Standford (1990) found the existence of low-frequency variations in an eight-year Nimbus-7 TOMS ozone dataset. Ziemke and Chandra (2003) found a significant MJO signal in tropospheric ozone over the equatorial western and eastern Pacific Ocean using satellite measurements. Ziemke et al. (2007) further showed the presence of an MJO signal in ozone and water vapor throughout much of the tropics, including the North Atlantic, which had not been shown in previous studies. Tian et al. (2007) suggested that intraseasonal ozone anomalies are more evident in the subtropics over the Pacific and Eastern Hemisphere. Subtropical total column ozone anomalies possess a systematic relationship with the well-documented equatorial MJO convective anomalies and circulation patterns. The negative (positive) ozone anomalies are typically collocated with the subtropical upper troposphere anticyclonic (cyclonic) anomalies generated by equatorial MJO convective heating, and flank to the west of the equatorial convective anomalies. Li et al. (2012) investigated the vertical structure of MJO-related ozone variations using the vertical ozone profiles from both satellite-borne and in-situ measurements. The study indicated that the MJO-related ozone anomalies in the subtropics maximize approximately in the lower stratosphere (60-100 hPa).
On the other hand, recent studies have suggested that MJO-related convective anomalies can trigger record ozone minimum events over East Asia (Liu et al., 2009, 2010), which may cause an increase in UV radiation at the surface. Given the relatively high predictability of the MJO (e.g., Waliser, 2012), the robust connection between the intraseasonal subtropical stratospheric ozone variations and the MJO implies that the subtropical stratospheric ozone variations and UV radiation at the surface might be predictable with similar lead times. As a result, it is important to examine how well the state-of-the-art community climate models can represent the MJO-related stratospheric ozone variability, especially over East Asia.
In the present reported work, we evaluated the representation of the MJO signal in stratospheric ozone in the global Whole Atmosphere Community Climate Model (WACCM) during boreal winter (December-January- February, DJF) 2004-10, when the MJO was especially active over the warm equatorial Indian and western Pacific oceans. Section 2 introduces the model and datasets used in the study. A comparison between the model simulation and reanalysis data is presented in section 3. Conclusions are summarized in section 4.
2 Data and method
The WACCM is a fully coupled chemistry-climate model (Garcia et al., 2007) developed at the National Center for Atmospheric Research (NCAR). In this study, we examined the MJO in stratospheric ozone during boreal winter 2004-10 from a simulation using the Specified Dynamics version of WACCM (termed SD-WACCM). In the SD-WACMM simulation, the dynamics and temperature in the troposphere and stratosphere were constrained by relaxing the horizontal winds and temperature from the surface to 40 km to the Modern Era-Retrospective Analysis for Research and Applications (MERRA) reanalysis data. The model output had 88 vertical levels with a T63 horizontal resolution (~2° × 2.5° ). Readers are referred to previous literature (e.g., Marsh et al., 2013; Chandran et al., 2014) for more details of the WACCM model and the SD-WACCM simulation. The model simulation was initially designed at the NCAR for comparison with the NCAR’ s Community Climate Model and National Aeronautics and Space Administration's Earth Observing System Aura and Aqua satellite measurements, which largely began in 2004. Therefore, the model simulation was also initialized from 2004.
European Centre for Medium-Range Weather Forecasts Interim Reanalysis (ERA-Interim) data (e.g., Dee et al., 2011) at a horizontal resolution of 1.5° × 1.5° were used to analyze the MJO-related ozone anomalies and circulation anomalies (i.e., horizontal wind and geopotential height).
The MERRA reanalysis was developed by NASA’ s Global Modeling and Assimilation Office and focuses on the satellite era, from 1979 to the present day. An overview of the system, the observations used in the dataset, and aspects of its performance, including quality assessment diagnostics and comparisons with other reanalysis datasets, are provided by Rienecker et al. (2011).
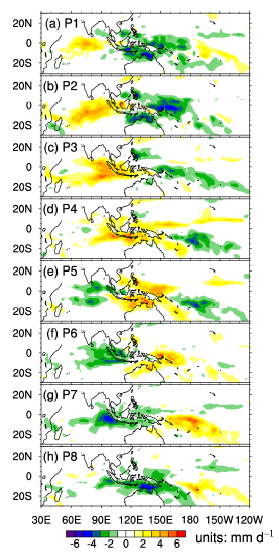
The MJO events and phases were determined by the real-time multivariate MJO (RMM) index (Wheeler and Hendon, 2004). The daily values of RMM1 and RMM2 were obtained from the Australian Bureau of Meteorology website (http://cawcr.gov.au/staff/mwheeler/maproom/ RMM/). The time series of RMM1 and RMM2 vary mostly on intraseasonal timescales (typically 30-60 days). Based on the RMM index, lifecycles of the MJO can be divided into eight phases, indicative of the geographic location of the MJO-related convective anomalies. Figure 1 shows the tropical precipitation anomalies related to each of the eight MJO phases. For example, positive rainfall anomalies develop in the western equatorial Indian Ocean during phase 1 (Fig. 1a) and travel eastward across the equatorial Indian Ocean during phases 2 and 3 (Figs. 1b and 1c). The anomalies arrive at the Maritime Continent in phases 4 and 5 (Figs. 1d and 1e) and travel to the western equatorial Pacific in phases 6 and 7 (Figs. 1f and 1g). Finally, the anomalies weaken upon reaching the central equatorial Pacific in phase 8 (Fig. 1h).
Figure 1 Composite of band-pass-filtered (20-100 days) precipitation anomalies (units: mm d-1) related to each MJO phase ((a-h) P1-P8) during December, January, and February of 2004-2010.
To isolate the MJO signal in stratospheric ozone (i.e., MJO-related ozone anomalies), the daily climatology was removed from the daily mean value, and then a 20- 100-day bandpass filter was applied to the daily anomalies. Stratospheric column ozone anomalies were defined as the integrated ozone anomalies between 20 and 200 hPa.
3 Results
3.1 Horizontal distribution of MJO-related stratospheric ozone anomalies
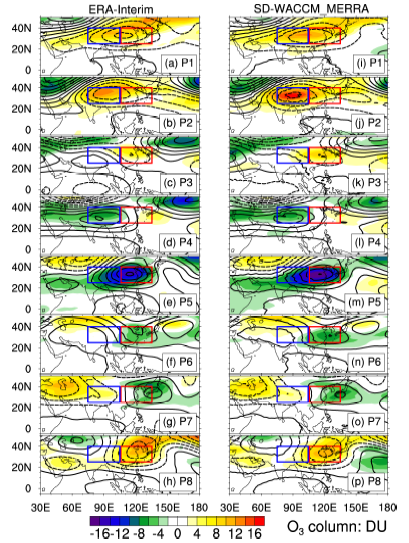
Figure 2 compares the horizontal distribution of MJO- related stratospheric column ozone (200-20 hPa) and geopotential height anomalies from ERA-Interim reanalysis and the SD-WACCM simulation. The patterns of MJO-related anomalies were very similar between the reanalysis data and model simulation. For example, in MJO phases 1-2, there were negative geopotential height anomalies over the Tibetan Plateau and East Asia, leading to positive ozone anomalies over both regions (Figs. 2a-b and 2i-j). As the MJO-related circulation pattern travelled from the equatorial Indian Ocean across the Maritime Continent towards the equatorial western Pacific, there were positive geopotential height anomalies over the Tibetan Plateau and East Asia, leading to negative ozone anomalies over the Tibetan Plateau (MJO phases 3-6) and East Asia (5-7) (Figs. 2c-g and 2k-o). The results were generally consistent with satellite measurements in previous studies (e.g., Tian et al., 2007; Li et al., 2012). Based on the SD-WACCM simulation, the maximum amplitude of stratospheric ozone anomalies over the Tibetan Plateau and East Asia was as much as 10-16 Dobson Units (DU) in MJO phase 5 (Fig. 2m), which was slightly larger than that (8-14 DU) based on ERA-Interim reanalysis data (Fig. 2e).
Figure 2 MJO-related anomalies of ozone column in 200-20 hPa (color-shaded contours; units: DU) and 100 hPa geopotential height (contours; units: m) from (a-h) ERA-Interim reanalysis and (i-p) model simulation. Positive and negative geopotential height anomalies are indicated by solid and dashed contours, with an interval of 10 m. The blue and red boxes mark the geophysical locations of the Tibetan Plateau (25-40° N, 75-105° E) and East Asia (25-40° N, 105-135° E), respectively.
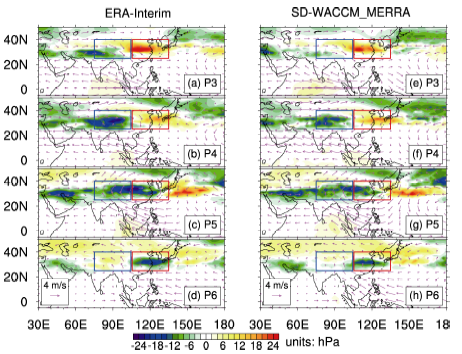
To better understand the MJO-related circulation anomalies responsible for the negative stratospheric column ozone anomalies over the Tibetan Plateau and East Asia (Figs. 2c-f and 2k-n), Fig. 3 shows the 100 hPa horizontal winds and tropopause pressure anomalies related to MJO phases 3-6. Both the reanalysis data and model simulation showed that the negative ozone anomalies shown in Fig. 2 were coupled with negative anomalies in tropopause pressure (i.e., elevated tropopause) and anticyclonic circulation anomalies. The coupled anomalies in tropopause pressure and circulation were maximized over East Asia during MJO phase 5, which corresponded to the pronounced ozone anomalies over the Tibetan Plateau and East Asia (compare Figs. 3c and 3g to Figs. 2e and 2m, respectively). The relationship between the negative ozone anomalies and MJO-related circulation pattern (i.e., elevated tropopause and anticyclonic circulation anomaly) over the Tibetan Plateau and East Asia was consistent with that reported in previous studies (e.g., Liu et al., 2009, 2010).
3.2 Vertical structure of the MJO-related stratospheric ozone anomalies
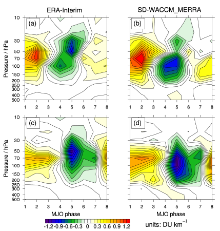
Figure 4 shows the vertical profiles of the MJO-related stratospheric ozone anomalies averaged over the Tibetan Plateau (25-40° N, 75-105° E) and East Asia (25-40° N, 105-135° E). Both the ERA-Interim reanalysis data and SD-WACCM simulation indicated that the negative ozone anomalies occurred in MJO phases 3-6 and 4-7 over the Tibetan Plateau and East Asia, respectively. The results also highlighted the different vertical profiles of the MJO-related stratospheric ozone anomalies over the two regions. The ozone anomalies showed a vertical tilt structure over the Tibetan Plateau (upper panels), but an upright structure over East Asia (lower panels).
Figure 3 MJO-relate tropopause pressure anomalies (color-shaded contours; units: hPa) and 100-hPa wind anomalies (vectors; units: m s-1) in MJO phases P3-P6: (a-d) reanalysis; (e-h) simulation. The blue and red boxes mark the geophysical locations of the Tibetan Plateau (25-40° N, 75-105° E) and East Asia (25-40° N, 105-135° E), respectively.
To explore the mechanism underpinning the different vertical ozone structures shown in Fig. 4, Fig. 5 presents pressure-longitude cross sections of the MJO-related anomalies in ozone concentration and geopotential height averaged in 25-40° N. Both the ERA-Interim reanalysis data and SD-WACCM simulation showed that the eastward propagation of the negative ozone anomalies was coupled with that of positive geopotential height anomalies through MJO phases 2-8 (Figs. 5b-h and 5j-p). However, as the MJO moved eastward, the strength and vertical distribution of MJO-related anomalies in ozone and geopotential height varied. For example, in MJO phases 2-3, the negative ozone anomalies were located between 200 and 50 hPa to the east of Tibetan Plateau (Figs. 5b-c and 5j-k). Starting from MJO phase 4, as the geopotential height anomalies intensified, the MJO-related ozone anomalies extended up to 20 hPa over the Tibetan Plateau and East Asia (Figs. 5d-f and 5l-n). Note that the geopotential height anomalies showed westward tilt with altitude when the positive geopotential height anomalies were centered over the longitudes of East Asia (Figs. 5e-f and 5m-n). Afterwards, as the MJO moved across the equatorial western Pacific, the MJO-related ozone and geopotential height anomalies dissipated (Figs. 5g-h and 5o-p).
Figure 4 Composite of MJO-related ozone anomalies (units: DU km-1) over the (a, b) Tibetan Plateau and (c, d) East Asia for the eight MJO phases from the (a, c) ERA-Interim reanalysis data and (b, d) model simulation.
3.3 Major difference between the model simulation and reanalysis data
The amplitude of the MJO-related ozone anomalies in the ERA-Interim reanalysis data was generally smaller than that in the SD-WACCM simulation (compare the left and right panels in Figs. 3-5). In contrast, the amplitude of the MJO-related circulation anomalies (i.e., geopotential height, tropopause pressure) in the ERA-Interim reanalysis was slightly stronger than that in the SD-WACCM simulation (compare the left and right panels in Figs. 2, 3, and 5). Therefore, the difference in the ozone anomalies could not be explained by the difference in the circulation anomalies between the model simulation and the reanalysis data. To understand the cause of the difference, the daily mean ozone concentrations from the SD-WACCM simulation and the ERA-Interim reanalysis data were compared. The comparison indicated the existence of systematic positive bias in the model-calculated ozone in the upper troposphere and lower stratosphere (not shown). This model bias has been reported previously by Lamarque et al. (2012) in the NCAR’ s Community Earth System Model.
Figure 5 Pressure-longitude cross sections of the MJO-related ozone anomalies (color-shaded contours; units: DU km-1) and geopotential height anomalies (contours; units: m) averaged between 25° N and 40° N from the (a-h) ERA-Interim reanalysis data and (i-p) WACCM simulation. Positive and negative geopotential height anomalies are indicated by solid and dashed contours, with an interval of 10 m. The longitudes of the Tibetan Plateau and East Asia are marked by the blue and red boxes, respectively.
Note also that the MJO-related ozone anomalies in the ERA-Interim reanalysis data were centered around 50 hPa, while the anomalies in the SD-WACCM simulation were centered around 100 hPa (compare the left and right panels in Fig. 4). Thus, further study is needed to uncover the cause of this model bias.
4 Summary and conclusions
In this study, we examined the MJO-related stratospheric ozone anomalies during boreal winter using a SD-WACCM simulation. Comparison with ERA-Interim reanalysis data suggested that the simulation represented well the three-dimensional structure of the MJO-related ozone anomalies in the upper troposphere and stratosphere. The negative ozone anomalies were situated over the Tibetan Plateau and East Asia in MJO phases 3-7, when the MJO convective anomalies travelled from the equatorial Indian Ocean towards the equatorial western Pacific Ocean. Due to the different vertical structures of the MJO-related circulation anomalies, the MJO-related stratospheric ozone anomalies showed a vertical tilt structure over the Tibetan Plateau, but an upright structure over East Asia. The maximum amplitude of MJO-related stratospheric column ozone anomalies (10-16 DU) based on the SD-WACCM simulation was slightly larger than that (8-14 DU) based on the ERA-Interim reanalysis data. This difference could not be explained by the weaker MJO-related circulation anomalies in the SD-WACCM simulation. Further analysis suggested that the difference between the model simulation and reanalysis data was attributable to the positive bias in the model-calculated ozone in the upper troposphere and lower stratosphere.
Given the close connection between stratospheric column ozone and UV radiation at the surface, the encouraging performance of this chemistry-climate model in representing the MJO-related stratospheric ozone variation implies that the influence of the MJO on surface UV radiation might also be predictable by the model.
Reference
1
Chand ranA. , R. L. Collins, and V. L. Harvey, 2014: Stratosphere-mesosphere coupling during stratospheric sudden warming events, Adv. Space Res. , 53, 1265-1289.
2
DeeD. P. , S. M. Uppala, A. J. Simmons, et al. , 2011: The ERAInterim reanalysis: Configuration and performance of the data assimilation system, Quart. J. Roy. Meteor. Soc. , 137, 553-597.
3
GaoX. H. , J. L. Stanford, 1990: Low-frequency oscillations in total ozone measurements, J. Geophys. Res. , 95, 13797-13806.
4
GarfinkelC. I. , S. B. Feldstein, D. W. Waugh, et al. , 2012: Observed connection between stratospheric sudden warmings and the Madden-Julian Oscillation, Geophys. Res. Lett. , 39, L18807, doi: DOI:10.1029/2012GL053144.
5
GarciaR. R. , D. R. Marsh, D. E. Kinnison, et al. , 2007: Simulation of secular trends in the middle atmosphere, 1950-2003, J. Geophys. Res. , 112, D09301, doi: DOI:10.1029/2006JD007485.
6
LamarqueJ. -F. , L. K. Emmons, P. G. Hess, et al. , 2012: CAM-chem: Description and evaluation of interactive atmospheric chemistry in the Community Earth System Model, Geosci. Model Dev. , 5, 369-411.
7
LauW. K. M. , D. E. Waliser, 2012: Intraseasonal Variability in the Atmosphere-Ocean Climate System (2nd ed. ), Springer, Heidelberg, 581pp.
8
LiK. -F. , B. Tian, D. E. Waliser, et al. , 2012: Vertical structure of MJO-related subtropical ozone variations from MLS, TES, and SHADOZ data, Atmos. Chem. Phys. , 12, 425-436.
9
LiuC. , Y. Liu, Z. Cai, et al. , 2009: A Madden-Julian Oscillation-triggered record ozone minimum over the Tibetan Plateau in December 2003 and its association with stratospheric “low-ozone pockets”, Geophys. Res. Lett. , 36, L15830, doi: DOI:10.1029/2009GL039025.
10
LiuC. , Y. Liu, Z. Cai, et al. , 2010: Dynamic formation of extreme ozone minimum events over the Tibetan Plateau during northern winters 1987-2001, J. Geophys. Res. , 115, D18311, doi: DOI:10.1029/2009JD013130.
11
LiuC. , B. Tian, K. -F. Li, et al. , 2014: Northern Hemisphere mid-winter vortex-displacement and vortex-split stratospheric sudden warmings: Influence of the Madden-Julian Oscillation and Quasi-Biennial Oscillation, J. Geophys. Res. , 119, 12599-12620, doi: DOI:10.1002/2014JD021876.
12
MaddenR. A. , P. R. Julian, 1971: Detection of a 40-50 day oscillation in zonal wind in tropical Pacific, J. Atmos. Sci. , 28, 702-708.
13
MaddenR. A. , P. R. Julian, 1972: Description of global-scale circulation cells in tropics with a 40-50 day period, J. Atmos. Sci. , 29, 1109-1123.
14
MarshD. R. , M. J. Mills, D. E. Kinnison, et al. , 2013: Climate change from 1850 to 2005 simulated in CESM1(WACCM), J. Climate, 26(19), 7372-7391.
15
RieneckerM. M. , M. J. Suarez, R. Gelaro, et al. , 2011: MERRA: NASA's modern-era retrospective analysis for research and applications, J. Climate, 24, 3624-3648, doi: DOI:10.1175/JCLI-D-11-00015.1.
16
SabutisJ. L. , J. L. Stanford, and K. P. Bowman, 1987: Evidence for 35-50 day low frequency oscillations in total ozone mapping spectrometer data, Geophys. Res. Lett. , 14, 945-947.
17
TianB. , Y. L. Yung, D. E. Waliser, et al. , 2007: Intraseasonal variations of the tropical total ozone and their connection to the Madden-Julian Oscillation, Geophys. Res. Lett. , 34, L08704, doi: DOI:10.1029/2007GL029451.
18
TianB. , D. E. Waliser, 2012: Chemical and biological impacts, in: Intraseasonal Variability in the Atmosphere-Ocean Climate System (2nd ed. ), W. K. M. Lau and D. E. Waliser (Eds. ), Springer-Verlag, Berlin, Heidelberg, 569-585.
19
WaliserD. E. , 2012: Predictability and forecasting, in: Intraseasonal Variability in the Atmosphere-Ocean Climate System (2nd ed. ), W. K. M. Lau and D. E. Waliser (Eds. ), Springer-Verlag, Berlin, Heidelberg, 433-476.
20
WheelerM. C. , H. H. Hendon, 2004: An all-season real-time multivariate MJO index: Development of an index for monitoring and prediction, Mon. Wea. Rev. , 132, 1917-1932.
ZiemkeJ. R. , S. Chand ra, M. R. Schoeberl, et al. , 2007: Intra-seasonal variability in tropospheric ozone and water vapor in the tropics, Geophys. Res. Lett. , 34, L17804, doi: DOI:10.1029/2007GL030965.
1
2014
1.238
0.0
... Chandran et al ...
1
2011
0.0
0.0
... , Dee et al ...
1
1990
3.44
0.0
1
2012
4.456
0.0
... , Garfinkel et al ...
1
2007
3.44
0.0
... 2 Data and methodThe WACCM is a fully coupled chemistry-climate model (Garcia et al ...
1
2012
6.086
0.0
1
2012
0.0
0.0
... , Lau and Waliser, 2012) ...
1
2012
5.298
0.0
... Li et al ...
2
2009
4.456
0.0
... On the other hand, recent studies have suggested that MJO-related convective anomalies can trigger record ozone minimum events over East Asia (Liu et al ...
... , Liu et al ...
2
2010
3.44
0.0
... , 2009, 2010), which may cause an increase in UV radiation at the surface ...
... , 2009, 2010) ...
1
2014
3.44
0.0
... Liu et al ...
1
1971
3.036
0.0
... , Madden and Julian, 1971, 1972) ...
1
1972
3.036
0.0
... , Madden and Julian, 1971, 1972) ...
1
2013
4.904
0.0
... , Marsh et al ...
1
2011
0.0
0.0
... An overview of the system, the observations used in the dataset, and aspects of its performance, including quality assessment diagnostics and comparisons with other reanalysis datasets, are provided by Rienecker et al ...
1
1987
4.456
0.0
1
2007
4.456
0.0
... , Tian et al ...
2
2012
0.0
0.0
... , Tian and Waliser, 2012) ...
... , Waliser, 2012), the robust connection between the intraseasonal subtropical stratospheric ozone variations and the MJO implies that the subtropical stratospheric ozone variations and UV radiation at the surface might be predictable with similar lead times ...
1
2012
0.0
0.0
... The MJO events and phases were determined by the real-time multivariate MJO (RMM) index (Wheeler and Hendon, 2004) ...
1
2004
0.0
0.0
... , Zhang, 2005, 2013) ...
2
2005
0.0
0.0
... , Zhang, 2005, 2013) ...
... , Zhang, 2013) ...
1
2013
0.0
0.0
1
2003
4.456
0.0
1
2007
4.456
0.0
Simulation of the Madden-Julian Oscillation in Wintertime Stratospheric Ozone over the Tibetan Plateau and East Asia: Results from the Specified Dynamics Version of the Whole Atmosphere Community Climate Model


 , LIU Yi