


Influence of Graupel/Hail Parameters on the Simulation of a Convective System over Coastal South China in Summer
[GUO Chun-Wei1, 2 , XIAO Hui1, *  , FENG Liang
1, 2 , YANG Hui-Ling1 , ZHU Yun3 , LI Zong-Fei4 ]
, FENG Liang|
|


This paper discusses the effect of graupel/hail parameters on a convective system in Yangjiang, Guangdong Province. The simulation results using the original model settings were similar to observations in terms of radar reflectivity and sea level pressure, as well as the identification of hydrometeor particle classification by X-band dual-polarization radar data. Sensitivity tests using changed parameters of graupel/hail indicated that a size distribution with larger and denser but fewer hail hydrometers resulted in a weaker development of the convective system in the horizontal and vertical directions. With a large terminal velocity of hail, the melting rate of graupel and evaporation rate of rain were the lowest. Hail could reach the ground and the mixing ratio of rain was the largest near the ground. Precipitation, including rainwater and hail, was the largest. However, a size distribution with smaller and lighter but numerous graupel hydrometers resulted in a stronger development of the convective system. The melting rate of graupel and evaporation rate of rain were the largest. More graupel particles were stranded in the air for a longer time—and the maximum mixing ratio of rain was the largest. The precipitation amount, including rainwater only, was the smallest. The changes to graupel parameters also led to differences in microphysical processes.
The selection of characteristic parameters of precipitation particles has a substantial effect on the results of numerical simulation, especially the ice-phase particles (Cotton et al., 1982; Ferrier et al., 1995; Gilmore and Straka, 2004; Adams-Selin et al., 2013). Different numerical models possess different microphysical parameterization schemes, and these schemes are also different in the calculation of the terminal velocity of ice-phase particles. The methods for calculating terminal velocity devised by Locatelli and Hobbs (1974), Lin et al. (1983), and Rutledge and Hobbs (1983) are the most widely used. Khvorostyanov and Curry (2002) unified the calculation formulae for the terminal velocity of liquid- and ice-phase particles. Dudhia et al. (2008) improved the terminal velocity calculation method in the Weather Research and Forecasting (WRF) model single-moment six-class (WSM6) microphysical scheme. The new method takes the mixing ratio as the weight, unifying the terminal velocity of graupel and snow. Luo et al. (2010) replaced the calculation formula for graupel fall speed in the Morrison scheme (Morrison et al., 2005) with that in the Lin scheme (Lin et al., 1983). They found that the stratiform precipitation amount was reduced, the latent heating rate was intensified, and the ice mixing ratio was reduced, compared to the result using the original formula.
Meanwhile, the category of graupel/hail also plays an important role in the simulation results of convective storms. Gilmore and Straka (2004) and van Weverberg et al. (2012) found that the dynamical and precipitation processes varied greatly with a change to the density and intercept parameters of graupel/hail. Bryan and Morrison (2012) simulated an ideal squall line. The results showed that the convective line was thinner, and the radar echo stronger, when using the microphysical scheme that included hail but not graupel. Tao et al. (2013) reported that the dissipation time of precipitation became advanced, the updraft suppressed, and the cloud top lowered, when tested using large hail. Seigel and van den Heever (2013) noted increased rear-to-front and front-to-rear flows in tests with smaller, less dense hail.
The above-mentioned studies demonstrate that appropriate graupel/hail parameters are very important to the numerical prediction of severe weather. The occurrence and development of strong convective precipitation systems bears a close relationship with the parameters of graupel/hail. Thus far, however, the focus has mainly been on the effects on precipitation and macrophysical structure. Previous research on convective systems in China has lacked quantitative calculations and in-depth analysis of every transformation rate in cloud microphysical processes. Therefore, in this paper, the influence of graupel/hail parameters on the structure and microphysical processes of a convective system in Yangjiang, Guangdong Province, is discussed by using the WRF model.
This study used the WRF model (version 3.3.1) with the double-moment six-class (WDM6) microphysical scheme (Lim and Hong, 2010). WDM6 utilizes an inverse exponential Marshall-Palmer size distribution for rain, snow, and graupel. The initial and boundary field data were all obtained from National Centers for Environmental Prediction (NCEP) 1° × 1° six-hourly dataset. The related settings are shown in Table 1. To obtain a better understanding of the microphysical processes in the convective system, we added the output of the conversion amounts of the microphysical processes in WDM6. A detailed description of the microphysical processes is provided in the Appendix, and in Guo et al. (2014, 2015).
| Table 1 Simulating scheme design in the Weather Research and Forecasting (WRF) model. |
Gilmore and Straka (2004) classified graupel/hail into nine types, from large hail to small graupel. Every type has its own density and intercept parameter. The two extreme types in their paper were selected to perform the sensitivity tests in the present study, so that the influence of graupel/hail parameters on convective structure and microphysical processes could be analyzed. The experimental design is detailed in Table 2. CTL stands for control test, N2R9 represents the test with a high density and small intercept parameter of graupel/hail, and N8R4 expresses the test with a low density and large intercept parameter of graupel/hail. A decrease in the hydrometeor intercept parameter will yield more large-sized hydrometeors and fewer small-sized hydrometeors, with all else being equal. This will also lead to an increase in terminal velocity and a shorter residence time in the air when they fall in downdrafts (Gilmore and Straka, 2004). On the contrary, an increase in the hydrometeor intercept parameter will yield fewer large-sized hydrometeors and more small-sized hydrometeors. Thus, a decrease in the terminal velocity of hydrometeors will arise.
| Table 2 Experimental design. |
Yangjiang is located on the southwest coast of Guangdong Province in southern China, 247 km from Guangzhou, and adjacent to the Pearl River Delta. On the morning of 28 July 2010, Yangjiang was under the control of an eastward march of the subtropical high at 500 hPa and enhancement of southwest winds at the 850 hPa level. There was a plentiful supply of warm moist air entering into the Yangjiang area. According to the sounding data observed at Yangjiang meteorological station at 0800 Beijing Standard Time (BST), the convective available potential energy was 2526 J kg-1.
A heavy convective system occurred on 28 July. The mobile X-band polarimetric radar (21.82° N, 111.98° E) of the Institute of Atmospheric Physics, Chinese Academy of Sciences, observed the whole process. A strong convective line entered the radar detection range from the west at 1324 BST. The convective line possessed a structure of cumulus embedded in stratus. The convective line appeared as an arc type and was oriented south and north, with a length of greater than 150 km and width of 10 km. The convective line then moved slowly east and, at 1420 BST, its forward part was 65 km west from the radar station. At 1606 BST, the convective line passed over the radar station. Then, it moved out of Yangjiang gradually and degenerated (figures omitted). The system caused a total rainfall amount of 10.53 mm, according to the Passivel disdrometer at Yangjiang Station.
The simulated radar reflectivity distributions at 1510 (Fig. 1a) and 1530 (Fig. 1c) BST were consistent with observations (Figs. 1b and 1d) in shape and trend, although the location showed some deviation. Furthermore, the X-band radar showed some attenuation far from the radar station, so the simulation results were a little wider in extent than observed. Figures 1e and 1f show the cross section between points A and B in Figs. 1c and 1d, respectively, and indicate the vertical structures were generally similar. Figures 1g and 1h show the related particle-phase distribution results. Although the simulation results (Fig. 1g) could not provide as detailed a classification of the hydrometeor particles as the X-band radar (Fig. 1h) did, the structure of graupel and snow above the freezing level, as well as the rain below the freezing level, agreed well with observations. Meanwhile, the simulated sea level pressure was similar to the observation at Yangjiang meteorological station (Fig. 1i).
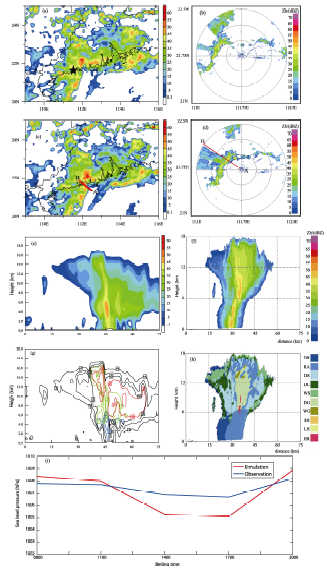 | Figure 1 Radar reflectivity at 1510 BST in the (a) simulation (black star: radar station) and (b) observation. Radar reflectivity at 1530 BST in the (c) simulation, (d) observation, (e) cross section along A-B in (c), and (f) cross section along A-B in (d). (g) Simulated mixing ratio of particles (blue line: rain; green line: graupel; red line: snow; black line: total hydrometeors; units: g kg-1). (h) X-band particle phase identification (DR: drizzle; RA: rain; DS: dry snow; DC: dry ice crystal; WS: wet snow; DG: dry graupel; WG: wet graupel; SH: small hail; LH: large hail; HR: hail and rain mixture). (i) Simulated and observed sea level pressure at Yangjiang meteorological station (Station No. 59663). |
At 1600 BST 28 July, the CTL system revealed a structure of cumulus embedded in stratus. Most areas possessed a radar reflectivity of 20-30 dBZ, with an extreme value of 50-55 dBZ (Fig. 2a). The N2R9 system was smaller in extent, especially its stratus extent. Furthermore, the radar reflectivity intensity was weaker, with an extreme value of only 45-50 dBZ (Fig. 2b). Meanwhile, the N8R4 system was the strongest in its intensity of radar reflectivity, with an extreme value of 55-60 dBZ, and largest in horizontal extent (Fig. 2c). The cross sections through Yangjiang along points A to B in Figs. 2a-c were analyzed. In the CTL test, a multi-cell structure was apparent (Fig. 2d); in the N2R9 test, there was a weak multi-cell structure (Fig. 2e); while in the N8R4 test, it was a clearer multi-cell structure, and the vertical development of the convective system was the strongest among the three tests (Fig. 2f). The strong radar reflectivity zone, of greater than 40 dBZ, was able to reach up to 6-10 km in height in the CTL test (Fig. 2d), over 14 km in the N8R4 test (Fig. 2f), but only 6 km in N2R9 (Fig. 2e). The strong radar reflectivity that extended higher and wider in the N8R4 test, relative to the CTL and N2R9 tests, was related to both stronger updrafts and a slower fall speed of graupel in the N8R4 test. In the N2R9 test, the updrafts were the weakest among the three tests, while the fall speed of hail was fastest (14.64 m s-1 for a hail mixing ratio of 0.7 g kg-1, compared to 1.09 m s-1 for graupel of the same mass mixing ratio in N8R4), making it difficult for hail particles to strands in the air for a long time (figures omitted). These results suggest that the specification of graupel/hail parameters in cloud microphysics schemes can substantially influence the properties and evolution of rainy storms in modelling simulations.
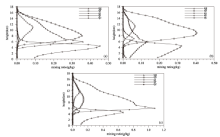
Figure 3 shows the vertical distribution of domain-averaged mixing ratios of hydrometeors at 1600 BST. Ice crystals and snow mainly appeared over the heights of 6.0 km and 4.5 km, respectively. As the graupel/hail density decreased and the intercept parameter increased, the maximum mixing ratio of ice crystals increased, while that of snow decreased gradually. The vertical distributions of graupel/hail and rain were the most sensitive to the parameters of graupel/hail. Graupel appeared over the height of 4 km in the CTL and N8R4 tests. For the low terminal velocity of graupel in the N8R4 test, more particles stranded in the air for longer time and the maximum mixing ratio of graupel in the N8R4 test reached 1.08 g kg-1— three times that in the CTL test. In the N2R9 test, fewer hail particles remained airborne, and the particles were able to reach the ground at a high terminal velocity. The maximum mixing ratio of rain appeared at 4.5 km (around the melting level) in the three tests, and its value was 0.32, 0.45, and 0.66 g kg-1 in N2R9, CTL, and N8R4, respectively. This was due to the different contribution from the melting rate of graupel/hail particles in each test (Figs. 2g-i and Table 3). The mixing ratio of rain near the ground prompted the opposite conclusion. In N2R9, the mixing ratio of rain near the ground was 0.19 g kg-1— the maximum value of the three tests. There were two reasons for this. First, in the N2R9 test, a few large hail particles could melt into rain during descent (Fig. 2h). Second, and most importantly, its evaporation rate was the lowest among the three tests (Fig. 2h and Table 3).
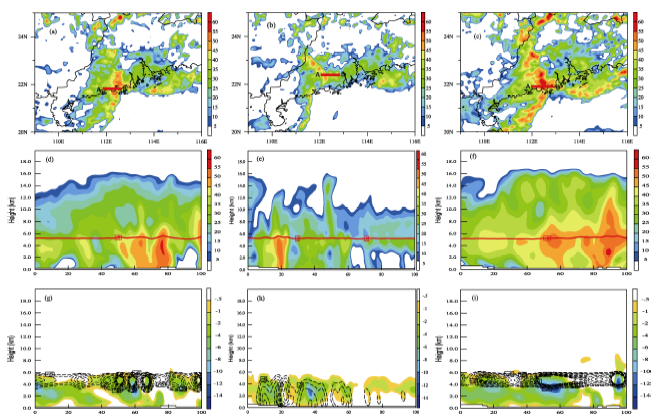 | Figure 2 Radar reflectivity at 1600 BST 28 July 2010 in (a) CTL, (b) N2R9, and (c) N8R4. Cross section along A-B (d, e, f) in (a, b, c), respectively (melting rate of graupel/hail (lines) and evaporation rate of rain (color scale; units: K h-1)); Cross section along A-B in (a, b, c): (g) CTL; (h) N2R9; (i) N8R4. |
The domain-averaged precipitation from 1600 to 1700 BST was 8.35, 9.58, and 6.64 mm in CTL, N2R9, and N8R4, respectively. Furthermore, the extent of heavy rain was the largest in N2R9 (Fig. 4). Although the melting rate was high in N8R4, it was countered by a higher evaporation rate, which led to the smallest precipitation amount. The precipitation amount in N2R9 was largest among the three tests, for which there might be two reasons. First, large-sized hail particles would have possessed smaller area-to-volume ratios, which in turn would have led to the lower evaporation rate of rain compared to the other tests (Fig. 2h and Table 3). And second, with a high terminal velocity, the hail particles could have reached the surface without even completely melting. In this way, the precipitation amount increased in the N2R9 test. Furthermore, the precipitation was composed of two parts, rain and hail, in the N2R9 test.
| Table 3 Domain-integrated temperature change due to melting and evaporation at 1600 BST 28 July 2010. |
 | Figure 3 Vertical distribution of the domain-averaged mixing ratio of hydrometeors at 1600 BST 28 July 2010 in (a) CTL, (b) N2R9, and (c) N8R4. |
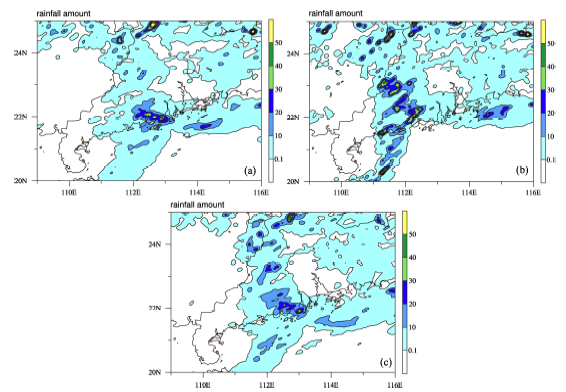 | Figure 4 Rainfall amount from 1600 to 1700 BST 28 July 2010 in (a) CTL, (b) N2R9, and (c) N8R4 (units: mm). |
From 1600 to 1700 BST, the main source of cloud water was the condensation of water vapor (cond) in the three tests. In the CTL test, according to the calculation (Table 4), the main sources of rain were the melting of graupel/ hail (gmlt), melting of snow (smlt), and accretion of cloud water by rain (racw), accounting for 65.22%, 13.83%, and 17.7% of the total rainwater amount, respectively. In N2R9, the percentages of the three sources were 48.83%, 21.32%, and 24.48%, respectively. With a high terminal velocity, the melting of hail became reduced, which led to the decreased melting rate (see Table 3). In N8R4, the proportions of the three sources were 81.4%, 2.59%, and 12.74%, respectively. With a low-terminal velocity, more graupel particles were remained airborne for a long time, which led to the increased melting rate of graupel. For graupel (Table 4), the main sources in CTL were the aggregation of rain by graupel (gacr) and aggregation of snow by rain (racs), accounting for 68.17% and 13.56% of the total graupel amount, respectively. In N2R9, the sources of hail were the aggregations of rain by graupel (gacr), snow (sacr), and aggregation of snow by rain (racs), accounting for 34.94%, 34.15%, and 22.01% of the total graupel amount, respectively. In N8R4, the main source of graupel was gacr, accounting for 91.19% of the total graupel. The sources of snow were the aggregation of ice by snow (saci), aggregation of cloud water by snow (sacw), autoconversion of ice into snow (saut), and deposition of water vapor into snow (sdep) (Table 4). The saci process accounted for 38.24%, 57.57%, and 66.94% of the total snow amount in N2R9, CTL, and N8R4, respectively, while the sacw process accounted for 26%, 10.93%, and 2.3%, respectively. The main source of ice in the three tests was the deposition of water vapor on the ice nuclei (igen).
| Table 4 Accumulated vertically integrated conversion amounts of hydrometeor sources at 1600 BST 28 July 2010 (units: 109kg). The acronyms of microphysical processes not descripted in the text are listed below the table. |
(1) The simulation results using the original model settings were similar to observations of radar reflectivity, sea level pressure, and hydrometeor particle phase identification.
(2) Sensitivity tests in which the parameters of graupel/hail were changed indicated that the convective system in the test with smaller and lighter, but more numerous, graupel hydrometeors, developed stronger in horizontal and vertical directions, while the opposite was found in the test with larger and denser, but fewer, hail hydrometeors, as compared with the CTL test.
(3) More graupel particles were stranded in the air for a long time in the test with smaller and lighter, but more numerous, graupel hydrometers because of the lower terminal velocity. In the test with larger and denser, but fewer, hail hydrometeors, the hail particles were able to fast reach the surface because of their higher terminal velocity. The maximum mixing ratio of rain was largest in the small-graupel test. Meanwhile, near the ground, the mixing ratio of rain was largest in the hail-like test because of the less melting of graupel near the ground and the low evaporation rate of rain.
(4) The domain-averaged precipitation amount was largest in the test with larger and denser, but fewer, hail hydrometeors, including rainwater and hail. Meanwhile, the domain-averaged precipitation amount was smallest in the test with smaller, lighter, but more numerous, graupel because of the high evaporation rate of rain.
(5) The contribution of the melting of graupel to rain-water was greatest in the test with smaller and lighter, but more numerous, graupel hydrometeors, because more small graupel particles airborne were melted completely and the test had a high melting rate. The opposite condi-tions were found in the test with larger and denser, but fewer, hail hydrometeors. The sources of graupel and snow were also different in each of the three tests.
Overall, some interesting results were obtained from the tests performed in this study. The highlight is the relationships among radar structure, precipitation, and graupel/hail parameters. Therefore, the selection of ice-particle parameters is very important in model simulations and weather forecasting. Appropriate choices must be taken.
| 1 |
|
| 2 |
|
| 3 |
|
| 4 |
|
| 5 |
|
| 6 |
|
| 7 |
|
| 8 |
|
| 9 |
|
| 10 |
|
| 11 |
|
| 12 |
|
| 13 |
|
| 14 |
|
| 15 |
|
| 16 |
|
| 17 |
|
| 18 |
|
| 19 |
|
| 20 |
|
| 21 |
|
| 22 |
|
| 23 |
|