

Impacts of Two Ice Parameterization Schemes on the Cloud Microphysical Processes and Precipitation of a Severe Storm in Northern China
[YANG Hui-Ling1  , XIAO Hui
1 , GUO Chun-Wei1, 2 ]
, XIAO Hui|
|


A severe storm that occurred over Beijing in northern China on 23 June 2011 was simulated with two different ice crystal parameterization schemes (the DeMott scheme and Meyers scheme) by using the Regional Atmospheric Modeling System. Compared with the DeMott scheme, the simulation results with the Meyers scheme have the following characteristics: (1) Updrafts are stronger and more numerous; (2) The cloud is better organized and contains a greater peak of ice-phase hydrometeor mixing ratios; (3) Cloud water and hail mixing ratios increase while graupel mixing ratios decrease; (4) The surface precipitation is initially greater. However, at the end of the simulation, less precipitation is produced. In short, the differences between the two schemes are not obvious, but the DeMott scheme has a relatively more reasonable result.
The formation of ice particles in the Earth's atmosphere strongly affects the properties of clouds and their impact on climate. Despite the importance of ice formation in determining the properties of clouds, the Intergovernmental Panel on Climate Change (IPCC) was unable to assess the impact of atmospheric ice formation in their most recent report because our basic knowledge is insufficient (IPCC, 2007). Part of the problem is the paucity of quantitative information on the ability of various atmospheric aerosol species to initiate ice formation. Ice formation in clouds strongly impacts the properties of clouds and plays a major role in precipitation formation (Yin et al., 2002; Guo et al., 2014).
Saleeby and Cotton (2008) examined the relative impacts of ice forming nuclei (IFN) number concentrations on total snowfall near the Park Range of Colorado. The results showed that the enhancement of IFN displays a modest increasing trend in total precipitation. Rosenfeld and Nirel (1996) suggested that desert dust serving as giant cloud condensation nuclei (GCCN) and IFN can enhance precipitation and thereby influence the effectiveness of cloud seeding experiments. However, Li et al. (2006) studied the impacts of IFN number concentrations on precipitation of sand and dust weather, and the results showed that greater number concentrations of IFN result in the production of many smaller ice crystals, reducing the seeder-feeder mechanism, all of which act to suppress the precipitation. Therefore, the impacts of IFN number concentrations on precipitation are uncertain for different weather conditions.
Van den Heever (2006) found that variations in heterogeneous IFN, cloud condensation nuclei (CCN) and GCCN concentrations can have significant effects on both dynamical and microphysical processes of convective storms that form over Florida. Specifically, cloud-resolving model simulations showed that increasing aerosol concentrations at levels up to 4 km lead to stronger and more numerous updrafts, while enhancing ice nuclei (IN) concentrations produces ice particles at warmer temperatures, generates deeper anvils, and accelerates precipitation processes. Model studies also suggest that higher concentrations of IN cause precipitation to occur earlier in convective clouds and greatly affect their anvil development and structure. Higher concentrations of GCCN and IFN result in greater accumulated surface precipitation initially. By the end of the simulation, however, the accumulated precipitation is the greater for the scheme in which the aerosol concentrations are lower.
Cloud model simulations by Fridlind et al. (2004) and Phillips et al. (2005) emphasized the role of secondary activation by aerosols entrained into cumuli from the middle troposphere on impacting a predominant homogeneous freezing process and thereby determining the ice crystal distributions in some strong convective clouds over the Florida area. These results were supported by detailed analyses of cloud microphysical data (Heymsfield et al., 2005), but this latter study also pointed out that the more dominant homogeneous freezing process in initial cloud turrets impacts ice formation processes at later times or in subsequent cloud turrets.
Anthony et al. (2007) examined the potential effects of Saharan dust intrusions on the microphysical structure and optical properties of anvil-cirrus clouds. Enhancing IFN concentrations had an important impact on the mass fraction of pristine ice but a negligible effect on aggregates.
The effects of IFN on cloud characteristics and precipitation processes have received relatively little attention compared with CCN. This study examines the relative impacts of IFN number concentrations on cloud microstructure and precipitation of a severe storm in northern China.
The Regional Atmospheric Modeling System (RAMS) developed at Colorado State University (Saleeby and Cotton, 2004, 2005) was used in this study. Three two- way interactive nested model grids with horizontal grid spacings of 9, 3, and 1 km were employed (Fig. 1). A total of 42 vertical levels with variable grid spacing were employed, and the model top extended to ~20.5 km above the ground. The minimum grid spacing at the lowest level was 75 m, and the model used vertical grid stretching with a stretch ratio of 1.1 and maximum vertical grid spacing of 750 m. The complicated microphysical processes (condensation, sublimation, nucleation, ice multiplication, melting, collision and coalescence, auto-conversion, and evaporation) are presented. Detailed descriptions of the microphysical processes of the RAMS model can be found in the literature (Walko et al., 1995; Meyers et al., 1997; Cotton et al., 2003; Saleeby and Cotton, 2004; Yang et al., 2011, 2012). The model configuration used for the simulations is summarized in Table 1.
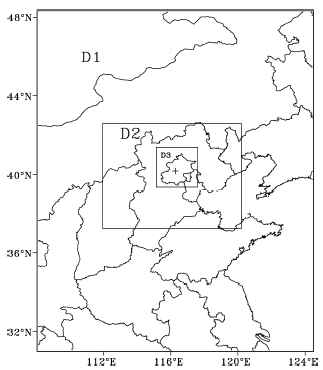 | Figure 1 Locations of the three nested domains. D1, D2, and D3 represent domain 1, domain 2, and domain 3, respectively. The mark “ +” stands for Beijing Haidian Station. |
| Table 1 The Regional Atmospheric Modeling System (RAMS) model configuration and options. |
Explicit activation of CCN and GCCN were simulated based on Saleeby and Cotton (2004). The CCN and GCCN number concentrations (NCCN and NGCCN, respectively) were initialized horizontally homogeneous with a vertical profile that decreased linearly with heightup to 4 km AGL (above the ground level). Such a distribution of CCN approaches some in situ observations (Van den Heever et al., 2006; Yang et al., 2011, 2012). Initial surface NCCN were specified at 1000 cm-3 and NGCCN of 10 m-3. The details are described in the literature (Yang et al., 2011, 2012).
In the simulations, the IFN were represented as a density-weighted decaying concentration profile of NIFN × ρ 5.4 with a maximum number concentration of 100 L-1; the maximum number of IFN to nucleate is dependent upon supersaturation with respect to ice and is given as:
NIN(Meyers)=NIFN× ρ 5.4× exp(12.96× (Si-0.40)), (1)
NIN(DeMott)=NIFN× ρ 5.4× exp(12.96× (Si-0.40)) × 10(-4.077× Si+0.0975) (2)
The two formulas above provide the maximum number of ice crystals to nucleate via deposition condensation freezing upon IFN, where NIN represents the number of pristine ice crystals predicted due to deposition-condensation freezing, NIFN is IFN number concentrations, Si is the ice supersaturation with respect to ice predicted by the model, and ρ represents air density. The DeMott formula, Eq. (2), indicates less ice forming activity than the Meyers formula, Eq. (1).
An ensemble of 18-h simulations was conducted for a squall line event that occurred in Beijing on 23 June 2011 (Yang et al., 2015). The model was initialized with real-time National Centers for Environmental Prediction reanalysis data from 0000 UTC 23 June 2011 (1° × 1° spatial resolution, 6-h time interval).
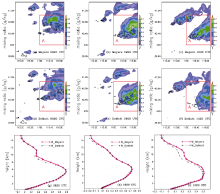
Figure 2 shows comparisons of radar echo intensity and 6-h accumulated precipitation amount between observations and simulations (Meyers and Demott schemes). The locations of the strong radar echo regions in the simulation are close to those observed (Figs. 2a-c). The maximum radar reflectivity is larger than 50 dBZ both in the observation and the simulation. The regional distributions of the simulated and observed precipitation are similar (Figs. 2d-f), and the maximum precipitation in both is approximately 80 mm. Thus, overall, the simulation is a close and reasonable representation of the observed conditions.
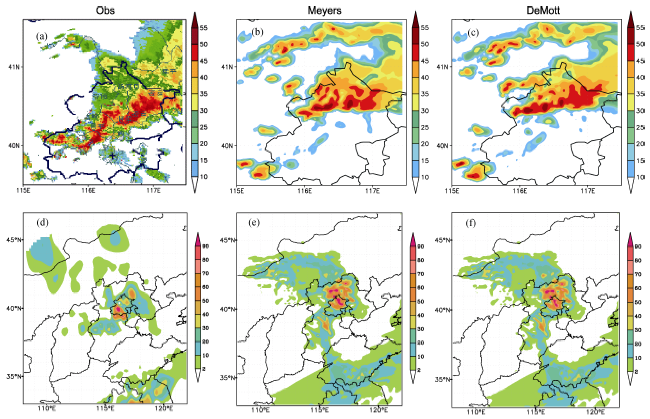 | Figure 2 (a) Observed and simulated ((b) Meyers, (c) Demott) radar reflectivity (units: dBZ). The times for (a) and (b, c) are 0800 and 0820 UTC 23 June 2011, respectively. (d) Observed and simulated ((e) Meyers, (f) DeMott 6-h (0600-1200 UTC) accumulated precipitation (units: mm); (a-c) show radar reflectivity and (d-f) present accumulated precipitation. |
The updrafts and vertically averaged mixing ratios of pristine ice, snow, and aggregates for the Meyers and DeMott schemes are shown in Fig. 3. Convection moves from northwest to southeast in both schemes. Comparing the Meyers and DeMott simulations, it is apparent that the Meyers scheme achieves greater maximum ice condensate amounts and is better organized than the DeMott scheme. Compared to the DeMott scheme, the Meyers scheme therefore increases the total mixing ratios of pristine ice, snow, and aggregates.
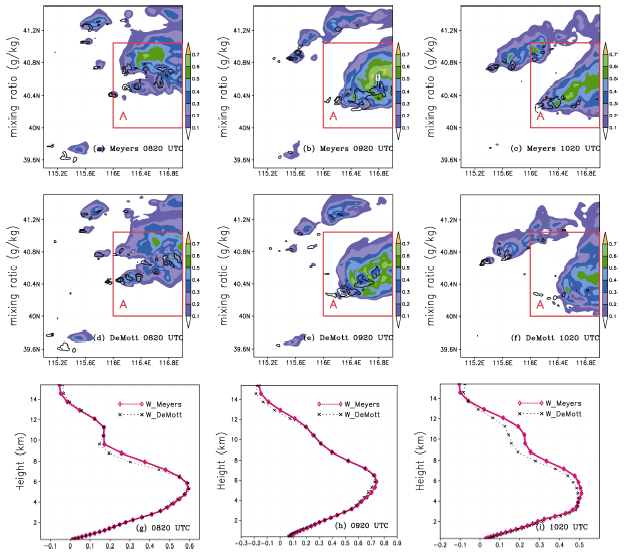 | Figure 3 Vertical velocity (lines; isolines at values of 1, 5, and 10 m s-1) averaged between ~5500 and 20000 m above ground level (AGL) and the total mixing ratios of pristine ice + snow + aggregates (mixing ratio values greater than 0.1g kg-1 are shaded) for the (a-c) Meyers and (d-f) DeMott schemes at hourly intervals from 0820 to 1020 UTC 23 June 2011. Horizontally (area A in (a)) averaged velocities within the updraft for the Meyers (W_Meyers) and DeMott (W_DeMott) schemes at hourly intervals starting at 0820 UTC. |
The updrafts are wider, stronger, and with a closer proximity in the Meyers scheme compared with those in the DeMott scheme. To further investigate the updraft characteristics, Figs. 3g-i show horizontally averaged velocities within the updraft for the Meyers (red lines) and DeMott (black lines) schemes at hourly intervals. Averaging the vertical velocities over the convective cores (area A) also demonstrates that the updrafts are stronger in the Meyers scheme. The maximum updrafts occur between 5 and 7 km AGL for the sensitivity tests throughout most of the simulation. This is due to the increase in the latent heat release associated with the formation of liquid and ice hydrometeor species by using the Meyers scheme. Comparing the developing, mature, and dissipating stages of the strong convection, it appears to have the greatest impact on the updraft during the dissipating stage using the Meyers scheme.
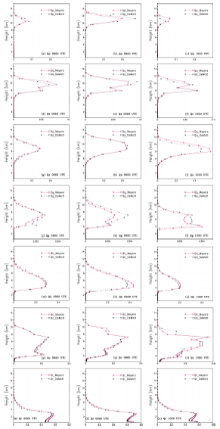
Vertical profiles of horizontal averages of the liquid water and ice hydrometeors within the convective updrafts are shown in Fig. 4.
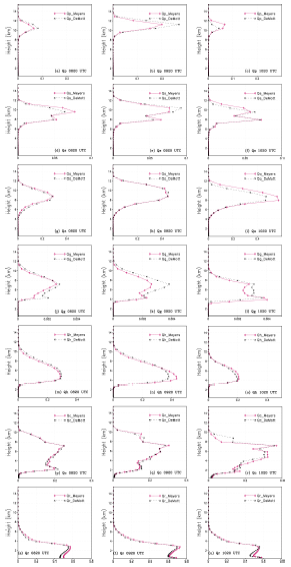 | Figure 4 Horizontally averaged mixing ratios of pristine ice (Qp), snow (Qs), aggregates (Qa), graupel (Qg), hail (Qh), cloud (Qc), and rain (Qr) at hourly intervals starting from 0820 UTC 23 June 2011 for the Meyers (red line) and DeMott (black line) schemes. The abscissa is mixing ratio (g kg-1) and the ordinate is height (km). |
The mixing ratio of pristine ice for the initial and mature stages is smaller in the Meyers scheme compared with the DeMott scheme. The mixing ratios of snow and aggregates, however, are greater in the Meyers scheme throughout the simulation due to the presence of enhanced IFN concentrations, which enhance heterogeneous nucleation. The greater amounts of supercooled liquid water in the Meyers scheme also facilitate the homogeneous freezing of pristine ice and riming of snow particles, both of which will increase ice mass. Higher IFN number concentrations mean increased competition for the vapor and supercooled water, a more efficient collection process of pristine ice, snow and other aggregates by aggregates themselves.
The graupel mixing ratio maxima are greater for all stages in the DeMott scheme, whereas hail mixing ratios are larger in the Meyers scheme. The hail in RAMS represents high-density frozen raindrops or hailstones. Graupel defined in RAMS can only withstand a modest amount of riming, after which it is transferred to the hail category. The greater cloud waters and associated riming in the Meyers scheme result in more graupel being transferred to hail.
Comparing the cloud water and rain mixing ratios for the Meyers and DeMott schemes demonstrates that the cloud water and rain mixing ratios are greater in the Meyers scheme throughout all the stages due to the presence of IFN with increased concentrations. Cloud water extends above the freezing level (~4 km AGL) in both schemes, thus providing supercooled liquid water for collision and riming processes. The rain mixing ratio in the Meyers scheme is greater than that in the DeMott scheme.
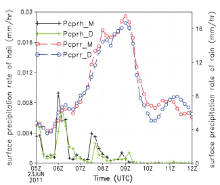
The regionally averaged surface precipitation rates for the convective area for each of the sensitivity tests are shown in Fig. 5. It is apparent that the most surface precipitation of rain and hail occurs in the Meyers scheme. This demonstrates increased surface precipitation with higher IFN concentrations. The result is similar to dynamic seeding concepts in which enhanced glaciations of convective clouds leads to dynamical invigoration of the clouds, larger amounts of processed water, and thereby increased rainfall at the ground (Simpson et al., 1967; Rosenfeld and Woodley, 1989, 1993). The Meyers scheme results in greater accumulated surface precipitation initially. By the end of the simulation period, however, the accumulated precipitation is greater for the simulations with the DeMott scheme.
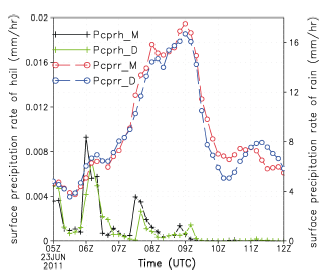 | Figure 5 Regionally averaged surface precipitation rate of rain (Pcprr) and hail (Pcprh) in Domain 3 for the Meyers (subscript M) and DeMott (subscript D) schemes.40 μ m to 80 μ m in diameter), rain, and snow all contribute to pristine ice generation. |
The available hydrometeors were considered to be transferred from one hydrometeor category to another within a cloud. Cloud1 (small cloud droplets, from 2 μ m to 40 μ m in diameter), cloud2 (large cloud droplets from Regarding pristine ice formation in this study, the dominant hydrometeor types (cloud1, cloud2, and snow) provide insight into the relative contributions of each hydrometeor to the pristine ice generation. Table 2 shows the domain-summed and time-averaged relative contributions of each particle type to pristine ice generation. The values of Lic1 and Lic2 signify the relative contribution of cloud1 and cloud2 to pristine ice, which are achieved by two major processes. One process is ice nucleation and the other is ice crystals growing up by sublimation. The variable Lis represents the contributions of snow to pristine ice generation. The major process to produce ice crystals is snow rupture, which is an ice crystal multiplication process.
| Table 2 Transfer amount (g kg-1) averaged over time over area A of each particle in the cloud to pristine ice in the two experiments. |
The result reveals that the contribution of each hydrometeor to pristine ice is altered in the two experiments. The total ice crystals are higher with the Meyers scheme compared with the DeMott scheme. In the Meyers scheme, the contributions of cloud1, cloud2, and snow to ice crystals are 3.12 g kg-1 (Lic1), 3.02 g kg-1 (Lic2), and 0.32 g kg-1 (Lis), and the corresponding contribution rates are 48.3%, 46.7%, and 5.0%, respectively. In the DeMott scheme, the contributions of cloud1, cloud2, and snow to ice crystals are 3.03 g kg-1 (Lic1), 2.98 g kg-1 (Lic2), and 0.28 g kg-1 (Lis), and the contribution rates are 48.2%, 47.4%, and 4.4%, respectively. The relative contributions of cloud1 and snow to pristine ice decrease in the Meyers scheme compared to the values associated with the DeMott scheme. However, the relative contributions of cloud2 to pristine ice in the Meyers scheme increase compared to those in the DeMott scheme. The contribution of liquid hydrometers to pristine ice formation is greater than that of the ice-phase hydrometeor particles in the two experiments.
The results demonstrate that the variations in ice parameterization schemes have some different impacts on both microphysical and dynamical characteristics of convective storms in northern China, as well as on the surface precipitation rate.
It is apparent from the results that the updraft structure of the storm is influenced by varying ice parameterization schemes. The updrafts are stronger and more numerous in the Meyers scheme compared with the DeMott scheme, being driven by the latent heat release due to freezing of larger amounts of supercooled water associated with higher IFN concentrations. The microphysical characteristics are affected by the variations of ice parameterization schemes. The cloud is organized better and contains a larger peak of ice condensate with the Meyers scheme. Compared to the DeMott scheme, the mixing ratios of cloud water and hail augment, while graupel mixing ratios reduce, in the Meyers scheme. The surface accumulated precipitation is initially larger in the Meyers scheme. However, at the end of the simulation, the precipitation becomes greater for the simulations with the DeMott scheme. In short, the differences between the two schemes are not obvious, but the DeMott scheme has a relatively more reasonable result.
| 1 |
|
| 2 |
|
| 3 |
|
| 4 |
|
| 5 |
|
| 6 |
|
| 7 |
|
| 8 |
|
| 9 |
|
| 10 |
|
| 11 |
|
| 12 |
|
| 13 |
|
| 14 |
|
| 15 |
|
| 16 |
|
| 17 |
|
| 18 |
|
| 19 |
|
| 20 |
|
| 21 |
|
| 22 |
|
| 23 |
|
| 24 |
|