

Source Sector Contributions to Aerosol Levels in Pakistan
[Muhammad Zeeshaan SHAHID1, 2 , LIAO Hong1, *  , QIU Yu-Lu
1, 2 , Imran SHAHID3 ]
, QIU Yu-Lu|
|


Urban air pollution in Pakistan is a serious challenge and it causes significant damage to human health and ecosystems. This paper presents a modelling study using the Weather Research and Forecasting Model coupled with Chemistry (WRF-Chem) to simulate the spatial distributions and temporal variations of aerosol concentrations over Pakistan, focusing on contributions of domestic emission sectors (transport, industry, residential, and energy) to mass concentrations of sulfate (SO42-), nitrate (NO3-), ammonium (NH4+), black carbon (BC), and organic carbon (OC) during the months of January, April, July, and October in 2010. Sensitivity studies indicate that, averaged over January, April, July, and October of 2010, energy and industry sectors have the largest contributions to SO42- concentrations, each of which contributes about 10%-20% to SO42-over the polluted eastern Pakistan. The contributions from residential and transport sectors to NO3- concentrations reach 40%-50% in central Pakistan. The residential sector has the highest contribution of 50%-80% to BC and OC loading in northeastern and southern Pakistan. Examination of sector contributions to aerosol levels in Lahore, the most polluted city in Pakistan, suggests that reductions in emissions in the residential sector should be an efficient measure for improving particulate matter air quality in this region.
Atmospheric aerosols are solid and liquid particles suspended in the air that are chemically complex in nature. The sources of aerosols are both natural and anthropogenic (Dockery et al., 1993; Seaton et al., 1995). Atmospheric pollutants in Pakistan are emitted from different sectors, such as power plants, industry, combustion of fossil fuels in vehicles, petroleum refineries, and fertilizer plants (Ghauri et al., 1994; Qadir and Zaidi, 2006; Biswas et al., 2008). Raja et al. (2009) reported high concentrations of pollutants in industrial areas across northeastern Pakistan’ s border and neighbouring areas of India such as Amritsar, Chandigarh, Bathinda, and Nangal. According to the 2012 Environmental Performance Index (Emerson et al., 2012), which tracked national environmental performance on a quantitative basis for 132 countries, Pakistan was ranked at 120 and hence was among the weakest countries.
Studies that attribute the sources of aerosols are quite limited in Pakistan. Lodhi et al. (2009) observed high PM2.5 concentrations of 53-476 µ g m-3 in Lahore (the second largest but the most polluted city in Pakistan) during November 2005 to March 2006. Their analyses, by using the positive matrix factorization (PMF) model, showed that the contributions of road dust, primary industrial emissions, and secondary aerosol (sulfate, nitrate, and ammonium) formation contributed 18%, 26%, and 51% to PM2.5 in Lahore, respectively. Mansha et al. (2012) performed a similar study for Karachi (the largest and the second most polluted city in Pakistan) by using the PFM model, and showed road dust, primary industrial emissions, and secondary aerosol (sulfate, nitrate, and ammonium) formation contributed, respectively, 16%, 53%, and 12% to PM2.5 in Karachi during January 2006 to January 2008. Alam et al. (2014) reported that PM10 concentrations varied from 254-555 µ g m-3 in Lahore in March of 2010. They also estimated the sources of aerosols by using the PMF model and reported that emissions from industrial dust, transportation, biofuel, and re-suspended dust contributed to 18.2%, 26.5%, 24.3%, and 4.6% of PM10 mass concentrations in Lahore, respectively. Such observational studies, however, have mostly been limited to a particular time period or location.
In this paper, we present the first modelling study to examine contributions of domestic emission sectors of transport, industry, residential, and energy to mass concentrations of sulfate (SO42-), nitrate (NO3-), ammonium (NH4+), black carbon (BC), and organic carbon (OC) during the months of January, April, July, and October in 2010, by using the Weather Research and Forecasting Model coupled with Chemistry (WRF-Chem) (Grell et al., 2005). This study builds on our previous work (Shahid et al., 2015), which examined the contributions of domestic anthropogenic emissions and transboundary transport to aerosol concentrations in Pakistan.
Version 3.6 of the WRF-Chem model was used to simulate aerosols over Pakistan. The model is fully coupled with meteorology, aerosols, cloud, and radiation (Grell et al., 2005; Fast et al., 2006; Gustafson et al., 2007; Chapman et al., 2009). The physical schemes include the modified Purdue Lin microphysics module (Lin et al., 1983), the Goddard shortwave radiation scheme (Chou et al., 1998), and the Rapid Radiative Transfer Model longwave radiation scheme (Mlawer et al., 1997). The gas- phase chemistry uses the Carbon-Bond Mechanism, version Z (CBM-Z) (Zaveri and Peters, 1999). Photolysis rates are calculated using the Fast-J scheme (Wild et al., 2000). The aerosol module is the Model for Simulating Aerosol Interactions and Chemistry (Zaveri et al., 2008) with eight size bins (0.039-0.078, 0.078-0.156, 0.156- 0.3125, 0.3125-0.625, 0.625-1.25, 1.25-2.5, 2.5-5.0, and 5.0-10 μ m). This model, with these configurations, was used to simulate aerosols over Pakistan, with 31 vertical layers that covered from the surface to 10 hPa and a horizontal resolution of 30 km.
Anthropogenic emissions for NOx, CO, non-methane volatile organic compounds (NMVOCs), SO2, BC, NH3, and OC are taken from the Hemispheric Transport of Air Pollution (HTAP) emissions for 2010 (http://www.htap.org/). The HTAP datasets have a grid resolution of 0.1° × 0.1° . The emissions of these chemical species are provided for sectors including energy (power industry), industry (manufacturing, mining, metal, cement, chemical, solvent industry, etc.), transport (ground transport include road, rail, pipeline, inland waterways, etc.), residential (heating/cooling of buildings and equipment/lighting of buildings and waste treatment) and agriculture. As shown in Table 1, transportation and energy are the largest emission sources of NOx, accounting for 58.5% and 19.5% of total NOx emission in Pakistan, respectively. Residential activities are the largest sources of emissions of CO, NMVOCs, BC, and OC, which contribute, respectively, 56.8%, 46.9%, 66.6%, and 88.5% to the annual total emissions of these species. Energy and industry are the two major sources of SO2 emissions, accounting for 55.5% and 33.3% of the total SO2 emission in Pakistan. Emissions of NH3 in Pakistan are mainly from agricultural and residential sectors, which contribute 79.6% and 20.3% of the total NH3 emission, respectively.
| Table 1 Summary of hemispheric transport of air pollution (HTAP), annual emissions of NOx, CO, NMVOC, SO2, BC, OC, and NH3 for Pakistan from different sectors. Units: Tg yr-1. |
The following WRF-Chem simulations were performed to examine the contribution from each emission sector to aerosol concentrations in Pakistan:
CTRL: Control simulation of SO42-, NO3-, NH4+, BC, and OC for four months (i.e., January, April, July, and October) of the year 2010 by using the HTAP monthly emissions of aerosols and aerosol precursors from all sectors of transport, industry, residential, energy, and agriculture over the model domain.
TRA_off: The same as the CTRL simulation except that emissions from the transportation sector in Pakistan were set to zero.
IND_off: The same as the CTRL simulation except that emissions from the industry sector in Pakistan were set to zero.
RES_off: The same as the CTRL simulation except that emissions from the residential sector in Pakistan were set to zero.
ENE_off: The same as the CTRL simulation except that emissions from the energy sector in Pakistan were set to zero.
The contributions to aerosol concentrations from each domestic sector of transportation, industry, residential, and energy can be quantified by ((CTRL - TRA_off )/ CTRL × 100%), ((CTRL - IND_off)/CTRL × 100%), ((CTRL - RES_off)/CTRL × 100%), and ((CTRL - ENE_off)/CTRL × 100%), respectively. For both the CTRL and sensitivity studies, the model was spun up for seven days for simulation of each of the four months in the year 2010. The initial and lateral boundary conditions for meteorological parameters were derived from the National Centers for Environmental Prediction Final Analysis (FNL) data, with horizontal resolution of 1° and temporal resolution of 6 h. All the simulations used the same initial and lateral boundary conditions for trace gases, aerosols, and meteorological variables. The chemical initial and lateral boundary conditions for trace gases and aerosols were derived from the Model for Ozone and Related Chemical Tracers, version 4 (Emmons et al., 2010).
The capability of the WRF-Chem model to simulate the meteorological parameters and aerosol concentrations in Pakistan has been evaluated in our previous study (Shahid et al., 2015). The model evaluation in Shahid et al. (2015) indicated that the WRF-Chem model is able to capture the distributions and seasonal variations of meteorological parameters, aerosol concentrations, and aerosol optical depth. Here, we perform an additional model evaluation by comparing simulated surface air temperature and relative humidity (RH) against the observed datasets in Lahore obtained from the Pakistan Meteorological Department (http://pmd.gov.pk/), considering that Lahore is the most polluted city in Pakistan. Figure 1 compares simulated and observed daily mean surface air temperature and RH for January, April, July, and October of 2010 in Lahore (31° 32′ N, 74° 22′ E). Simulated temperatures correlate well with observed values, with correlation coefficients in the range of 0.84-0.96 for January, April, July, and October of 2010. Simulated surface-layer RH also captures the daily variations, with correlation coefficients of 0.90, 0.70, 0.80, and 0.82 for January, April, July, and October of 2010, respectively.
 | Figure 1 Simulated and observed daily variations in (a-d) surface air temperature (° C) and (e-h) relative humidity (%) over Lahore for January, April, July, and October of the year 2010. |
Figure 2 (column (a)) shows the simulated concentrations of SO42-, NO3-, NH4+, BC, and OC from the CTRL simulation, which are averaged over January, April, July, and October of 2010. In the CTRL simulation, the aver-age sulfate concentration is about 3 µ g m-3 over a large fraction of Pakistan. Adhikary et al. (2007) simulated sulfate aerosol concentrations over South Asia by using the Sulfur Transport and Deposition Model (STEM) and reported that the average sulfate concentration over Pakistan over the months of November 2004, April 2005, and July 2005 was about 5 µ g m-3. They argued that the sulfate levels in South Asia were underestimated and could be due to a systematic underestimation in SO2 emissions or the underestimation of sulfate production rates. Simulated concentrations of NO3-, NH4+, BC, and OC are the largest over northeastern Pakistan, because of the high emissions in Lahore (the second largest city) and its surrounding areas. Over northeastern Pakistan, the maximum concentrations of NO3-, NH4+, BC, and OC were 5-10, 2-4, 4-5, and 20-25 µ g m-3, respectively.
Figure 2 also shows the percentage contributions of the domestic emission sectors of transport, industry, residential, and energy to mass concentrations of SO42-, NO3-, NH4+, BC, and OC, on the basis of the sensitivity studies described in section 2.3. The percentage contributions are calculated as (CTRL - sensitivity study)/CTRL × 100%. Averaged over the four months of January, April, July, and October of 2010, the energy and industry sectors have the largest contributions to SO42- concentrations, each of which contributes about 10%-20% to SO42-over the polluted eastern Pakistan. Note that the sum of contributions from all of the sectors of transport, industry, residential, and energy to SO42-are less than 50% because of the nonlinearity in chemical reactions.
 | Figure 2 (a) Simulated surface-layer mass concentrations (μ g m-3) of SO42-, NO3-, NH4+, BC, and OC in the CTRL simulation. Contributions (%) to mass concentrations of SO42-, NO3-, NH4+, BC, and OC from the emission sectors of (b) transport, (c) industry, (d) residential, and (e) energy. All the model results are averages over January, April, July, and October of the year 2010. |
With respect to the sector contributions to NO3-concentrations, the contributions from the residential and transport sectors reach 40%-50% in central Pakistan. Over northeastern Pakistan, where simulated nitrate concentrations are the highest, the contributions from the residential, transport, energy, and industry sectors are about 30%-50%, 20%-40%, 5%-20%, and 1%-10%, respectively. Although NOx emissions from the residential sector accounts for only 19.5% of total NOx emission in Pakistan (Table 1), the residential sector has the largest contribution to NO3-concentrations because of the relatively large emissions of NH3 (20.3%) from the residential sector.
The transport, residential, and energy sectors contribute almost equally to NH4+ concentrations in Pakistan, with contributions of 20%-40% in northeastern Pakistan and 5%-20% in southern parts of Pakistan. The industry sector has the smallest contribution, of less than 10%, to NH4+ levels in Pakistan.
The magnitudes and spatial distributions of sector contributions to BC are similar to those to OC concentrations in Pakistan. The residential sector has the highest contribution of 50%-80% to BC and OC loading in northeastern and southern Pakistan. The transport and industry sectors contribute about 5%-20% to BC and OC concentrations in Pakistan. Emissions from the energy sector have very small contributions (less than 1%) to BC and OC levels.
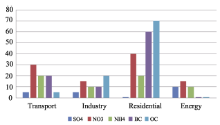
We also examine (Fig. 3) the sector contributions to aerosol concentrations in the most polluted city of Lahore. Averaged over the four months, the residential sector is the most significant contributor to aerosol concentrations at Lahore, which contributes, respectively, 40%, 60%, and 70% to NO3-, BC, and OC concentrations in Lahore. The energy sector has the largest contribution of 10% to SO42-. The largest contributions to NH4+ concentrations in Lahore are from the transport and residential sectors, with each sector contributing 20%.
 | Figure 3 Contributions (%) to mass concentrations of SO42-, NO3-, NH4+, BC, and OC over Lahore from the emission sectors of transport, industry, residential, and energy. All the model results are averages over January, April, July, and October of the year 2010. |
In this work we examine the contributions of the do-mestic emission sectors of transport, industry, residential, and energy to mass concentrations of SO42-, NO3-, NH4+, BC, and OC in Pakistan in the year 2010 by using the WRF-Chem model. Anthropogenic emissions for NOx, CO, NMVOCs, SO2, BC, NH3, and OC are taken from the HTAP emissions for 2010. In Pakistan, transportation is the largest emission source of NOx, which accounts for 58.5% of total NOx emission. Residential activities are the largest sources of emissions of CO, NMVOCs, BC, and OC, which contribute, respectively, 56.8%, 46.9%, 66.6%, and 88.5% to the annual total emissions of these species. Energy and industry are the two major sources of SO2 emissions, accounting for 55.5% and 33.3% of the total SO2 emission in Pakistan. Emissions of NH3 in Pakistan are mainly from the agricultural sector, which contributes to 79.6% of the total NH3 emission.
Sensitivity studies indicate that, averaged over January, April, July, and October of 2010, the energy and industry sectors have the largest contributions to SO42- concentrations, each of which contributes about 10%-20% to SO42- over the polluted eastern Pakistan. The contributions from the residential and transport sectors to NO3- concentrations reach 40%-50% in central Pakistan. The residential sector has the highest contribution of 50%- 80% to BC and OC loading in northeastern and southern Pakistan.
We also examine the sector contributions to aerosol concentrations in the most polluted city of Lahore. The residential sector is simulated to be the most significant contributor to aerosol concentrations at Lahore, which contributes, respectively, 40%, 60%, and 70% to NO3-, BC, and OC{Invalid MML}concentrations in Lahore. Considering that NO3-, BC, and OC are the most abundant aerosol species in northeastern Pakistan in our simulation, our model results suggest that reductions in emissions in the residential sector should be an efficient measure for improving particulate matter air quality in Pakistan.
| 1 |
|
| 2 |
|
| 3 |
|
| 4 |
|
| 5 |
|
| 6 |
|
| 7 |
|
| 8 |
|
| 9 |
|
| 10 |
|
| 11 |
|
| 12 |
|
| 13 |
|
| 14 |
|
| 15 |
|
| 16 |
|
| 17 |
|
| 18 |
|
| 19 |
|
| 20 |
|
| 21 |
|
| 22 |
|
| 23 |
|