
Interannual and Decadal Variations of Surface Solar Radiation over East China in the First Half of the 20th Century
[FEI Ye1, 2 , XIA Xiang-Ao1, 3, *  ]
]
]
|
|


Variability and long-term trends of sunshine duration (SSD) and total cloud cover (TCC) were studied based on surface observations from 10 meteorological stations over East China in the first half of the 20th century. The correlation coefficients between SSD and diurnal temperature range (DTR), as well as TCC, were analyzed. SSD experienced a significant increasing trend (0.16 h d-1 per decade) from 1908 to 1936, and the maximum brightening was in autumn (0.33 h d-1 per decade). The good agreement between the variability of SSD and DTR, supported by the correlation coefficient between them of 0.72, implies that the SSD measurements were reliable. TCC showed a decreasing trend (-0.93% per decade) and was significantly inversely related to SSD (-0.74), indicating the variation of SSD was attributable to changes in cloud cover. The result was obviously different to that since the 1960s, when clouds could not account for the decadal trend of surface solar radiation in China.
Solar radiation incident at the Earth’ s surface, known as surface solar radiation (SSR), is the fundamental source of energy in the climate system, and consequently the source of life on the planet (Wild, 2009, 2012). Widespread measurements of SSR with thermopile pyranometers were initiated during the International Geophysical Year projects in 1957 and 1958. Furthermore, historical measurements from more than 1500 observation stations throughout the world were compiled in the Global Energy Balance Archive by the World Radiation Committee (Ohmura et al., 1989; Gilgen et al., 1998), which laid a firm foundation of data for numerous studies, such as examinations of long-term SSR change, verification of regional and global climate model simulation outputs, as well as verification of satellite remote sensing products. Therefore, most studies of SSR variations have focused on the period since the 1950s (Stanhill and Cohen, 2001; Wild, 2009) and only very few studies have analyzed the SSR change in the first half of the 20th century (e.g., Ohmura, 2006). Numerous studies have reported there was a decrease in SSR (“ global dimming” ), at a rate of 1%-3% per decade from the 1950s to the 1980s (e.g., Che et al., 2005; Liang and Xia, 2005; Wild, 2009, and references therein). Whereas, more recent observations show a partial recovery in SSR (“ global brightening” ) since the mid-1980s (e.g., Wild et al., 2009). Furthermore, global dimming may have counteracted, and global brightening may have added to, the greenhouse effect during recent decades (Wild et al., 2007), thus impacting upon the components and intensity of the hydrological cycle (Ramanathan et al., 2001).
Based on a dataset of sunshine duration, Sanchez- Lorenzo and Wild (2012) pointed out there was decadal variation of SSR from the 1900s to the 1950s in Europe, and cloud cover changes seemed to explain the major part of the SSR decadal variability in this period, which may be different to that since the 1960s. However, because of the scarcity of long-term time series of SSR before the second half of the 20th century, our knowledge on trends in SSR involves uncertainties. Compared with the situation in the past few decades, industrialization was quite limited and the influence of human activities on the atmospheric environment was relatively low in the first half of the 20th century. Analysis of radiation and cloud data before the 1950s can provide a reference for research focusing on the period since the 1960s.
To overcome the major limitation in the dimming/ brightening issue, i.e., the lack of SSR data available before the 1950s, we used proxy sunshine duration (SSD) data to evaluate the SSR trend. SSD is defined as the time span, usually expressed in number of hours, that direct solar radiation exceeds a threshold of 120 W m-2. Many studies have proven that SSD is an excellent proxy measure of solar radiation, and plays an important role in the description of dimming/brightening (Stanhill, 1998, 2003, 2011; Stanhill and Cohen, 2001, 2005; Liang and Xia, 2005; Sanchez-Lorenzo et al., 2009; Sanchez-Lorenzo and Wild, 2012).
The main objective of our study was to analyze the decadal trends of SSD, as well as the relationship between SSD and total cloud cover (TCC), in the first half of the 20th century, which may be a good reference for a better understanding of long-term SSR variation since the 1960s.
The meteorological data used in this study were from two long-term instrumental databases compiled by the Institute of Atmospheric Physics in accordance with a joint research agreement signed by the United States Department of Energy and the Chinese Academy of Sciences (CAS) in 1987. CAS provided records from 265 stations, partitioned into networks of 60 and 205 stations, each providing good geographical coverage of China. The data of the 60-station network contain monthly measurements of barometric pressure, air temperature, precipitation amount, relative humidity, SSD, cloud amount, wind direction and speed, and number of days with snow cover. The data of the 205-station network contain monthly mean temperature and precipitation; however, station histories are not available. Thirteen stations in the 60-station datasets have temperature records that begin prior to 1900. The data analyzed in the present study were from the 60-station network database, which represents the most comprehensive, long-term (especially cover the first half of the 20th century) instrumental Chinese climate data presently available (Tao et al., 1997).
According to the 60-station dataset, the stations that included SSD observations were as many as 10 around 1908. Besides, there were quite a few missing values during 1937 to 1945. Considering the above limitations, observations (including SSD, diurnal temperature range (DTR), and TCC) covering the period 1908 to 1936 were used in the analysis.
Prior to analysis, all data were converted to departures from the norm (anomalies), with the norm approximated by period means of SSD, DTR, and TCC data. This allowed the combination of data from adjacent months into seasonal relationships. The monthly anomalies of SSD, TCC, and DTR were averaged by season (winter was defined as December-February, spring as March-May, summer as June-August, and autumn as September-November), and an annual average was obtained from the average of the four seasons. If there were two or three instances of missing data in one season, the seasonal mean was set to the missing value. If there was only one instance of missing data, it was replaced by the multi-annual mean value in this month firstly, and then the seasonal mean was calculated. The annual mean was calculated from the seasonal values in more than two seasons. There were only 10 stations with observations overlapping for at least 20 years among the 60-station dataset. Details of the stations are shown in Table 1. The linear trends of each series were calculated by means of least-squares linear fitting and their significance estimated by the Mann- Kendall nonparametric test (e.g., Sneyers, 1992).
| Table 1 Details of the 10 stations over East China used in this study, including the start year for sunshine duration (SSD), total cloud cover (TCC), and diurnal temperature range (DTR) measurements at each station. |
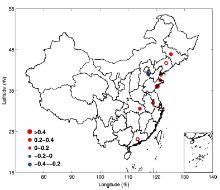
Figure 1 presents the spatial distribution of the trend slopes of the annual anomaly of SSD at 10 stations in East China from 1908 to 1936. SSD at all stations showed an increasing trend, except Tianjin (-0.22 h d-1 per decade). The most significant increase was in Qingdao (0.54 h d-1 per decade), and the overall trend for the 10 stations was 0.16 h d-1 per decade.
 | Figure 1 Spatial distribution of the trend slopes of the sunshine duration annual anomaly at 10 stations in East China from 1908 to 1936. Filled circles indicate statistical significance at 0.05 level using Mann-Kendall tests. |
Figure 2 presents the annual and seasonal SSD and DTR series, together with their fits from the robust locally weighted regression algorithm “ Lowess” for a better visualization of long-term and decadal variability (Makowski et al., 2009). SSD showed different seasonal trends and the most significant increasing trend (0.33 h d-1 per decade) occurred in autumn. The trends of SSD in summer and spring were 0.24 and 0.12 h d-1 per decade, respectively. Seasonal SSD in winter tended to decrease (-0.07 h d-1 per decade), although this was not significant at 0.05 level.
 | Figure 2 Time series plots of average anomalies of sunshine duration (SSD) and diurnal temperature range (DTR), plotted together with the smoothed series using the robust locally weighted regression algorithm “ Lowess” . |
A good relationship was found between SSR and DTR (the difference between daily maximum and minimum temperature, 2 m above the surface). Bristow and Campbell (1984) pointed out that DTR allows the separation of solar and thermal radiative influences, which affect the DTR in different ways. SSR is only present during daylight, and it affects the daily maximum temperature much more than the daily minimum temperature. On the other hand, the nighttime minimum temperature is mainly influenced by thermal radiative exchanges. After subtraction of the minimum temperature from the maximum temperature (just as DTR), thermal effects can, to a large extent, be eliminated from the data, thus leaving the solar influences as a major forcing factor of DTR. Indeed, many studies have shown a close correlation between observed records of SSR and DTR (e.g., Roderick and Farquhar, 2002; Liu et al., 2004; Makowski et al., 2009). Liu et al. (2004) reported a correlation of 0.88 between annual mean DTR and SSR based on 85 radiation stations in China. Therefore, we tested the reliability of SSD records by analyzing the interannual and decadal variations of DTR and SSD together.
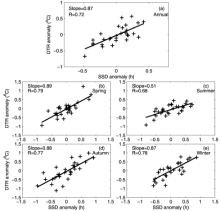
As shown in Fig. 2 and Table 2, strong correlation coefficients were found between annual SSD and DTR for the period 1908 to 1936 in terms of the annual anomaly (0.72), and also for the four seasons: 0.79 (spring); 0.68 (summer); 0.77 (autumn); 0.78 (winter). All correlations were significant at 0.05 level. This result is consistent with previous findings (Makowski et al., 2009; Wang and Dickinson, 2013), which suggests that SSD variations can be verified by DTR and SSD records during 1908 to 1936. The quality of the correlation is described by the correlation coefficient, while the strength is described by the slope of the regression line. As shown in Fig. 3a, DTR increased by 0.87° C when SSD increased by 1 h. Figures 3b-e present the different season cycles. The slope in summer was relatively small, meaning that DTR in summer was less influenced by SSD. We speculate that SSD was longest in summertime as a result of higher solar elevation, while DTR was relatively low in moist summers because a small fraction of SSR was partitioned into sensible heat. For this reason, the correlation coefficient was lowest in summertime and DTR was less sensitive to SSD.
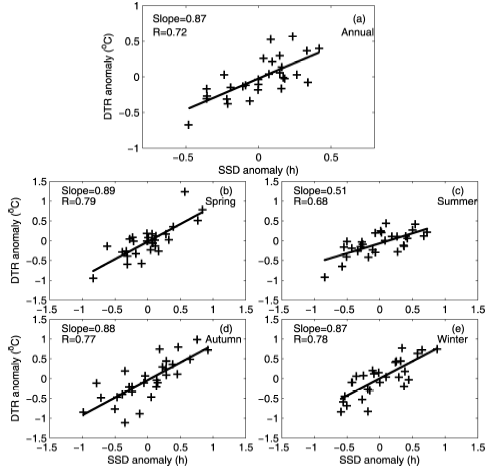 | Figure 3 Scatterplots of annual anomalies of DTR as a function of the (a) annual and (b-e) seasonal anomalies of SSD from 1908 to 1936. The plots include a best-fit regression line and its slope, as well as the corresponding correlation coefficient (R). |
| Table 2 Trends in the annual and seasonal time series of SSD, DTR, and TCC during 1908-36, as well as the correlation coefficients between SSD and both DTR and TCC. Values given in bold are statistically significant at 0.05 level using Mann-Kendall tests. |
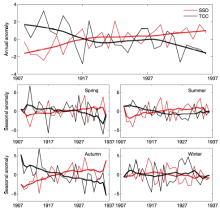
Given that clouds are one of the most important factors modulating SSR and, therefore, SSD is expected to be inversely related to TCC. As shown in Fig. 4 and Table 2, a strong inverse relationship was found between SSD and TCC during 1908-36. The TCC time series showed a decreasing trend of -0.93% per decade from 1908 to 1936. On the seasonal scale, the trends were quite different, ranging from -1.91% per decade in autumn to 0.02% per decade in winter. The decreasing trend of TCC was in good agreement with the brightening, mentioned above, indicating that TCC change accounted for the brightening. The correlation coefficients between SSD and TCC were -0.79, -0.64, -0.78, and -0.81 in spring, summer, autumn and winter, respectively, and -0.79 for the annual mean. We can explain why the minimum correlation was found for summer using the prevailing local convective clouds. These clouds would have contributed to the TCC observations but would not have greatly affected SSD observations. Compared with the coefficient between SSD and TCC (0.23) during 1954-2005 (Xia, 2010), TCC showed an obvious inverse relationship with SSD during 1908-36. TCC could explain the SSD variation well during 1908-36, which was totally different to the period after the 1950s. We suggest that, owing to industrialization having been quite limited before the 1950s, and because of the relatively minor influence of human activities on the atmospheric environment at that time, cloud cover variation would thus have been the main factor driving the decadal trend of surface solar radiation.
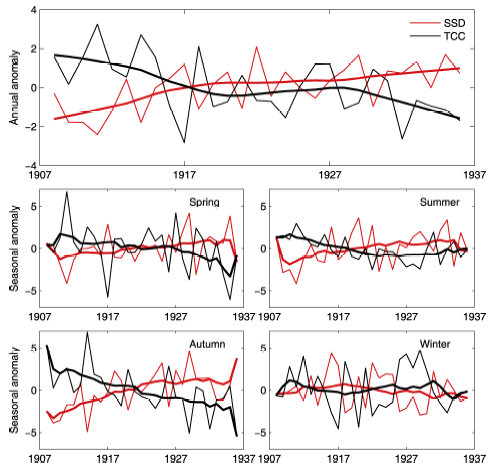 | Figure 4 Time series plots of average anomalies of SSD and total cloud cover (TCC), plotted together with the smoothed series using the robust locally weighted regression algorithm “ Lowess” . |
Based on surface observations from 10 meteorological stations over East China in the first half of the 20th century, the long-term trends in SSD, DTR, and TCC were analyzed, as well as the relationships between SSD and both DTR and TCC. SSD experienced a significant increasing trend (0.16 h d-1 per decade) from 1908 to 1936, and the maximum brightening was in autumn (0.33 h d-1 per decade). The good agreement between the variability of SSD and DTR, supported by the good correlation coefficient between them of 0.72, implies that the SSD measurements were reliable. TCC showed a decreasing trend (-0.93% per decade) and was significantly inversely related to SSD (-0.74), indicating the variation in SSD is attributable to cloud cover changes. The result is obviously different to the conclusion that cloud can barely explain the decadal changes in surface solar radiation since the 1960s in China.
| 1 |
|
| 2 |
|
| 3 |
|
| 4 |
|
| 5 |
|
| 6 |
|
| 7 |
|
| 8 |
|
| 9 |
|
| 10 |
|
| 11 |
|
| 12 |
|
| 13 |
|
| 14 |
|
| 15 |
|
| 16 |
|
| 17 |
|
| 18 |
|
| 19 |
|
| 20 |
|
| 21 |
|
| 22 |
|
| 23 |
|
| 24 |
|
| 25 |
|