An Idealized Numerical Study of the Effects of Uniform Zonal Winds on Tropical Cyclogenesis
[CAO Xi ]
]
]
|
|


The effect of uniform zonal winds on tropical cyclone (TC) genesis is examined on a beta plane using an idealized mesoscale model. The simulation results show that uniform easterly and westerly flows are both favorable for TC genesis. However, uniform easterly flows result in a faster TC genesis rate compared with uniform westerly flows. It is found that faster TC genesis is associated with greater surface heat fluxes and convection during the early stage. The superposition of uniform easterly flows and the beta effect results in greater surface heat fluxes and convection around the TC center compared with uniform westerly flows. Meanwhile, TC genesis is closely associated with the size and intensity of a mid-level circulation. The joint greater convection induced by the easterly flows and beta effect results in enhancement of the vertical temperature gradient, which is associated with the intensification of mid-level circulation. The strong and compact mid-level circulation is more favorable for efficient conversion of latent heat energy to the kinetic energy of the lower-level cyclonic winds. Thus, uniform easterly flows are more favorable for TC genesis than uniform westerly flows.
Tropical cyclone (TC) genesis is characterized by random cumulus-scale convective systems developing into a warm-core and cyclonic system in favorable large-scale conditions. The degree of development of a weak disturbance into a TC is influenced by the internal dynamics of the vortex and the external effect of the environmental flows. Due to a lack of reliable data over open oceans and complex multi-scale interactions, the mechanisms that induce TC genesis remain unclear.
The effects of vertical wind shear on TC genesis have been extensively studied in recent years (e.g., Tuleya and Kurihara, 1981; Frank and Ritchie, 2001; Montgomery et al., 2010; Nolan and McGauley, 2012; Ge et al., 2013). Although these idealized and real-case simulations were used with different versions of a model or different initial vortex structures, Nolan and McGauley (2012) concluded that these results support a consistent finding that moderate wind shear can accelerate TC genesis, but will suppress further TC development. In addition to vertical wind shear, mid-level relative humidity (McBride and Zehr, 1981; Ge et al., 2013) and monsoon gyres (Liang et al., 2014) also have strong effects on TC genesis. While these processes have been extensively studied, the effect of uniform zonal flows on TC genesis is still unclear. For example, Tuleya and Kurihara (1981) firstly studied the development of an initial disturbance with a maximum velocity of 5 m s-1 embedded in uniform easterly and westerly flows. They found that a greater intensification for non-zero uniform flows and attributed the result to greater energy exchange at the sea surface due to increased wind speed. They also found that uniform westerly flow is more favorable for TC genesis than easterly flow of the same strength, which is due to stronger vertical coupling between lower-level disturbance and the upper-level warm area produced by convection in westerly flows. However, the mechanisms that cause the difference of TC genesis under uniform westerly and easterly winds have yet to be explained in detail. On the other hand, many studies have focused on intensity and structural changes of mature TCs, and not on TC genesis based on numerical simulation of a TC embedded in uniform zonal winds (Peng et al., 1999; Dengler and Keyser, 2000; Kwok and Chan, 2005). As an example, Dengler and Keyser (2000) applied a numerical three-layer shallow- water model with a maximum wind of 15 m s-1 and found a consistent result with Tuleya and Kurihara (1981)— that a westerly flow is more favorable for TC intensification, but the maximum intensity is weaker than that in a no- flow case. They explained that a region of convectively stable air is formed to the left of the uniform flow vector. This convectively stable air penetrates into regions of boundary layer convergence and reduces vortex intensity.
Based on previous studies, several intriguing questions naturally arise: Is uniform westerly wind more favorable for TC genesis than that of uniform easterly wind, just as in previous studies on TC intensity change? If not, what mechanism is responsible for the TC genesis under different uniform winds? In fact, Tuleya and Kurihara (1981) found that an initial weak perturbation develops stronger under uniform westerly flows. However, their model used a horizontal resolution of approximately 70 km, 11 vertical levels, and a fairly simple convective parameterization. The rather coarse resolution suggests that their results deserve further investigation. Therefore, it is necessary to reexamine TC genesis in this simplest flow condition on a beta plane using a high-resolution model.
The remainder of this paper is organized as follows: The model configuration and initial conditions are illustrated in section 2. In section 3, the temporal evolutions of vortices are shown based on the results of three experiments. According to the temporal evolutions of vortices, efforts are then made to explain the difference in TC genesis under uniform easterly and westerly flows. Finally, in section 4, the key findings of the study are summarized and a simple discussion given.
The results presented in this paper are based on three idealized numerical simulations. The numerical experiments were conducted with the non-hydrostatic Advanced Research Weather Research and Forecasting model (version 3.3.1), developed by the National Center for Atmospheric Research (Skamarock et al., 2008). The model is triple-nested with two-way interaction, in which the mesh sizes are 331 × 331, 241 × 241, and 331 × 331, with
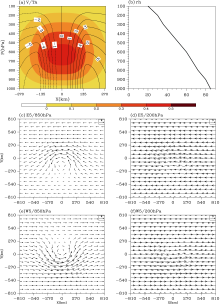
horizontal grid sizes of 27, 9, and 3 km, respectively. The locations of the 9- and 3-km domains were different in the various experiments. In the two inner domains the TCs moved in a large outermost domain to ensure that TC centers stayed away, by at least 250 km, from the lateral boundaries of both inner models. There were 35 levels in the vertical direction. The Kain-Fritch convective scheme was applied in the two outer meshes (Kain and Fritsch, 1993) and an explicit microphysics scheme (Lin et al., 1983) used in all three meshes. A fixed lateral boundary condition was used; that is, the tendency of the prognostic variable in the lateral boundary was set to zero. The model was set on a beta plane with a weak vortex placed at 20° N initially, and a constant sea surface temperature of 29° C was specified. All experiments were initialized with the same axisymmetric vortex. The maximum wind of the vortex was initially 8 m s-1 at a radius of 150 km at the surface, which satisfied both the hydrostatic and gradient wind balances (Wang, 1995). The wind gradually decreased upward. Figure 1a shows the vertical profile of meridional wind and the temperate anomaly in the west-east direction across the center of the vortex. The background relative humidity is horizontally homogeneous and has a vertical profile typical of January mean observations at Willis Island, which is shown in Fig. 1b (Holland, 1997). Details regarding other modeling configurations and the vertical structure of the initial vortex can be referred to in the studies of Cao et al. (2014a, b).
 | Figure 1 (a) Vertical-longitude cross section of meridional wind (contours, m s-1) and the temperate anomaly (color scale, K). (b) Vertical profile of relative humidity (%) in the CTL run. (c, d) 850- and 200-hPa wind fields (vectors) of the initial vortex in the E5 run in the outermost domain. (e, f) As in (c, d) but for the W5 run. |
The effects of uniform zonal flows were studied by comparing the results of three experiments. In the control experiment (CTL), a weak vortex in a resting environment was specified. In the second experiment (E5), a weak vortex with uniform easterly flows of 5 m s-1 was employed. The zonal wind was constant with altitude. The third experiment (W5) was the same except with uniform westerly flows of 5 m s-1 specified. The experiments were also performed with different zonal winds, such as 1 and 3 m s-1, and little difference was found in terms of TC development under weaker easterly and westerly winds (figure not shown). The experiments with stronger zonal winds failed to run because domains 2 and 3 did not successfully follow the weak vortex. Figures 1c-f show the initial wind fields at 850 hPa and 200 hPa in the E5 and W5 runs. It is clear that there are stronger easterly (westerly) winds in the north (south) of the vortex in E5 (W5) in the lower level and relatively uniform easterly (westerly) winds in the upper level.
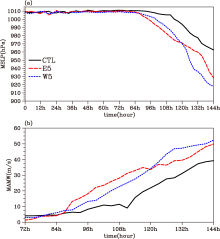
Figure 2 shows the temporal evolutions of the minimum sea level pressure (MSLP) and maximum azimuthal-mean wind of the vortex at 10 m height in CTL, E5, and W5. The vortex in the first 72 hours barely develops, after which follows rapid development in each of the three experiments. The evolution of the vortex depends on the direction of the imposed uniform zonal flows. The experiments indicate that there are faster genesis rates for non-zero uniform zonal flows, which is consistent with the result of Tuleya and Kurihara (1981). This is mainly due to the stronger surface heat fluxes under the superposition of the vortex and uniform zonal flows. However, in the early stage, the TC genesis rate is larger in E5 than that in W5, which appears to be opposite to the result of Tuleya and Kurihara (1981). At the time t = 96 h, the MSLP of the TC in the CTL, E5, and W5 experiments is 1008.7, 997.9, and 1003.2 hPa, respectively, while the maximum azimuthal mean wind is 8.3, 18.2, and 13.2 m s-1. Subsequently, the intensification rate of the TC in E5 is slightly weaker relative to that in W5 between t = 108 h and t = 144 h. At t = 120 h, the TC reaches the same intensity, with an MSLP of 970 hPa, in E5 and W5. At the end of the 144 h simulation, the intensity of the TC in CTL, E5, and W5 is 962.5, 928.6, and 918.1 hPa, respectively. The intensification rate of the TC in E5 and W5 after t = 120 h is consistent with the result of Peng et al. (1999), who showed that westerly flows imposed on a beta plane are more favorable for TC intensification than easterly flows of the same speed after the vortex reaches a relatively strong magnitude. Why then, do uniform zonal flows contribute differently to TC development during the genesis stage and during the intensification stage in E5 and W5?
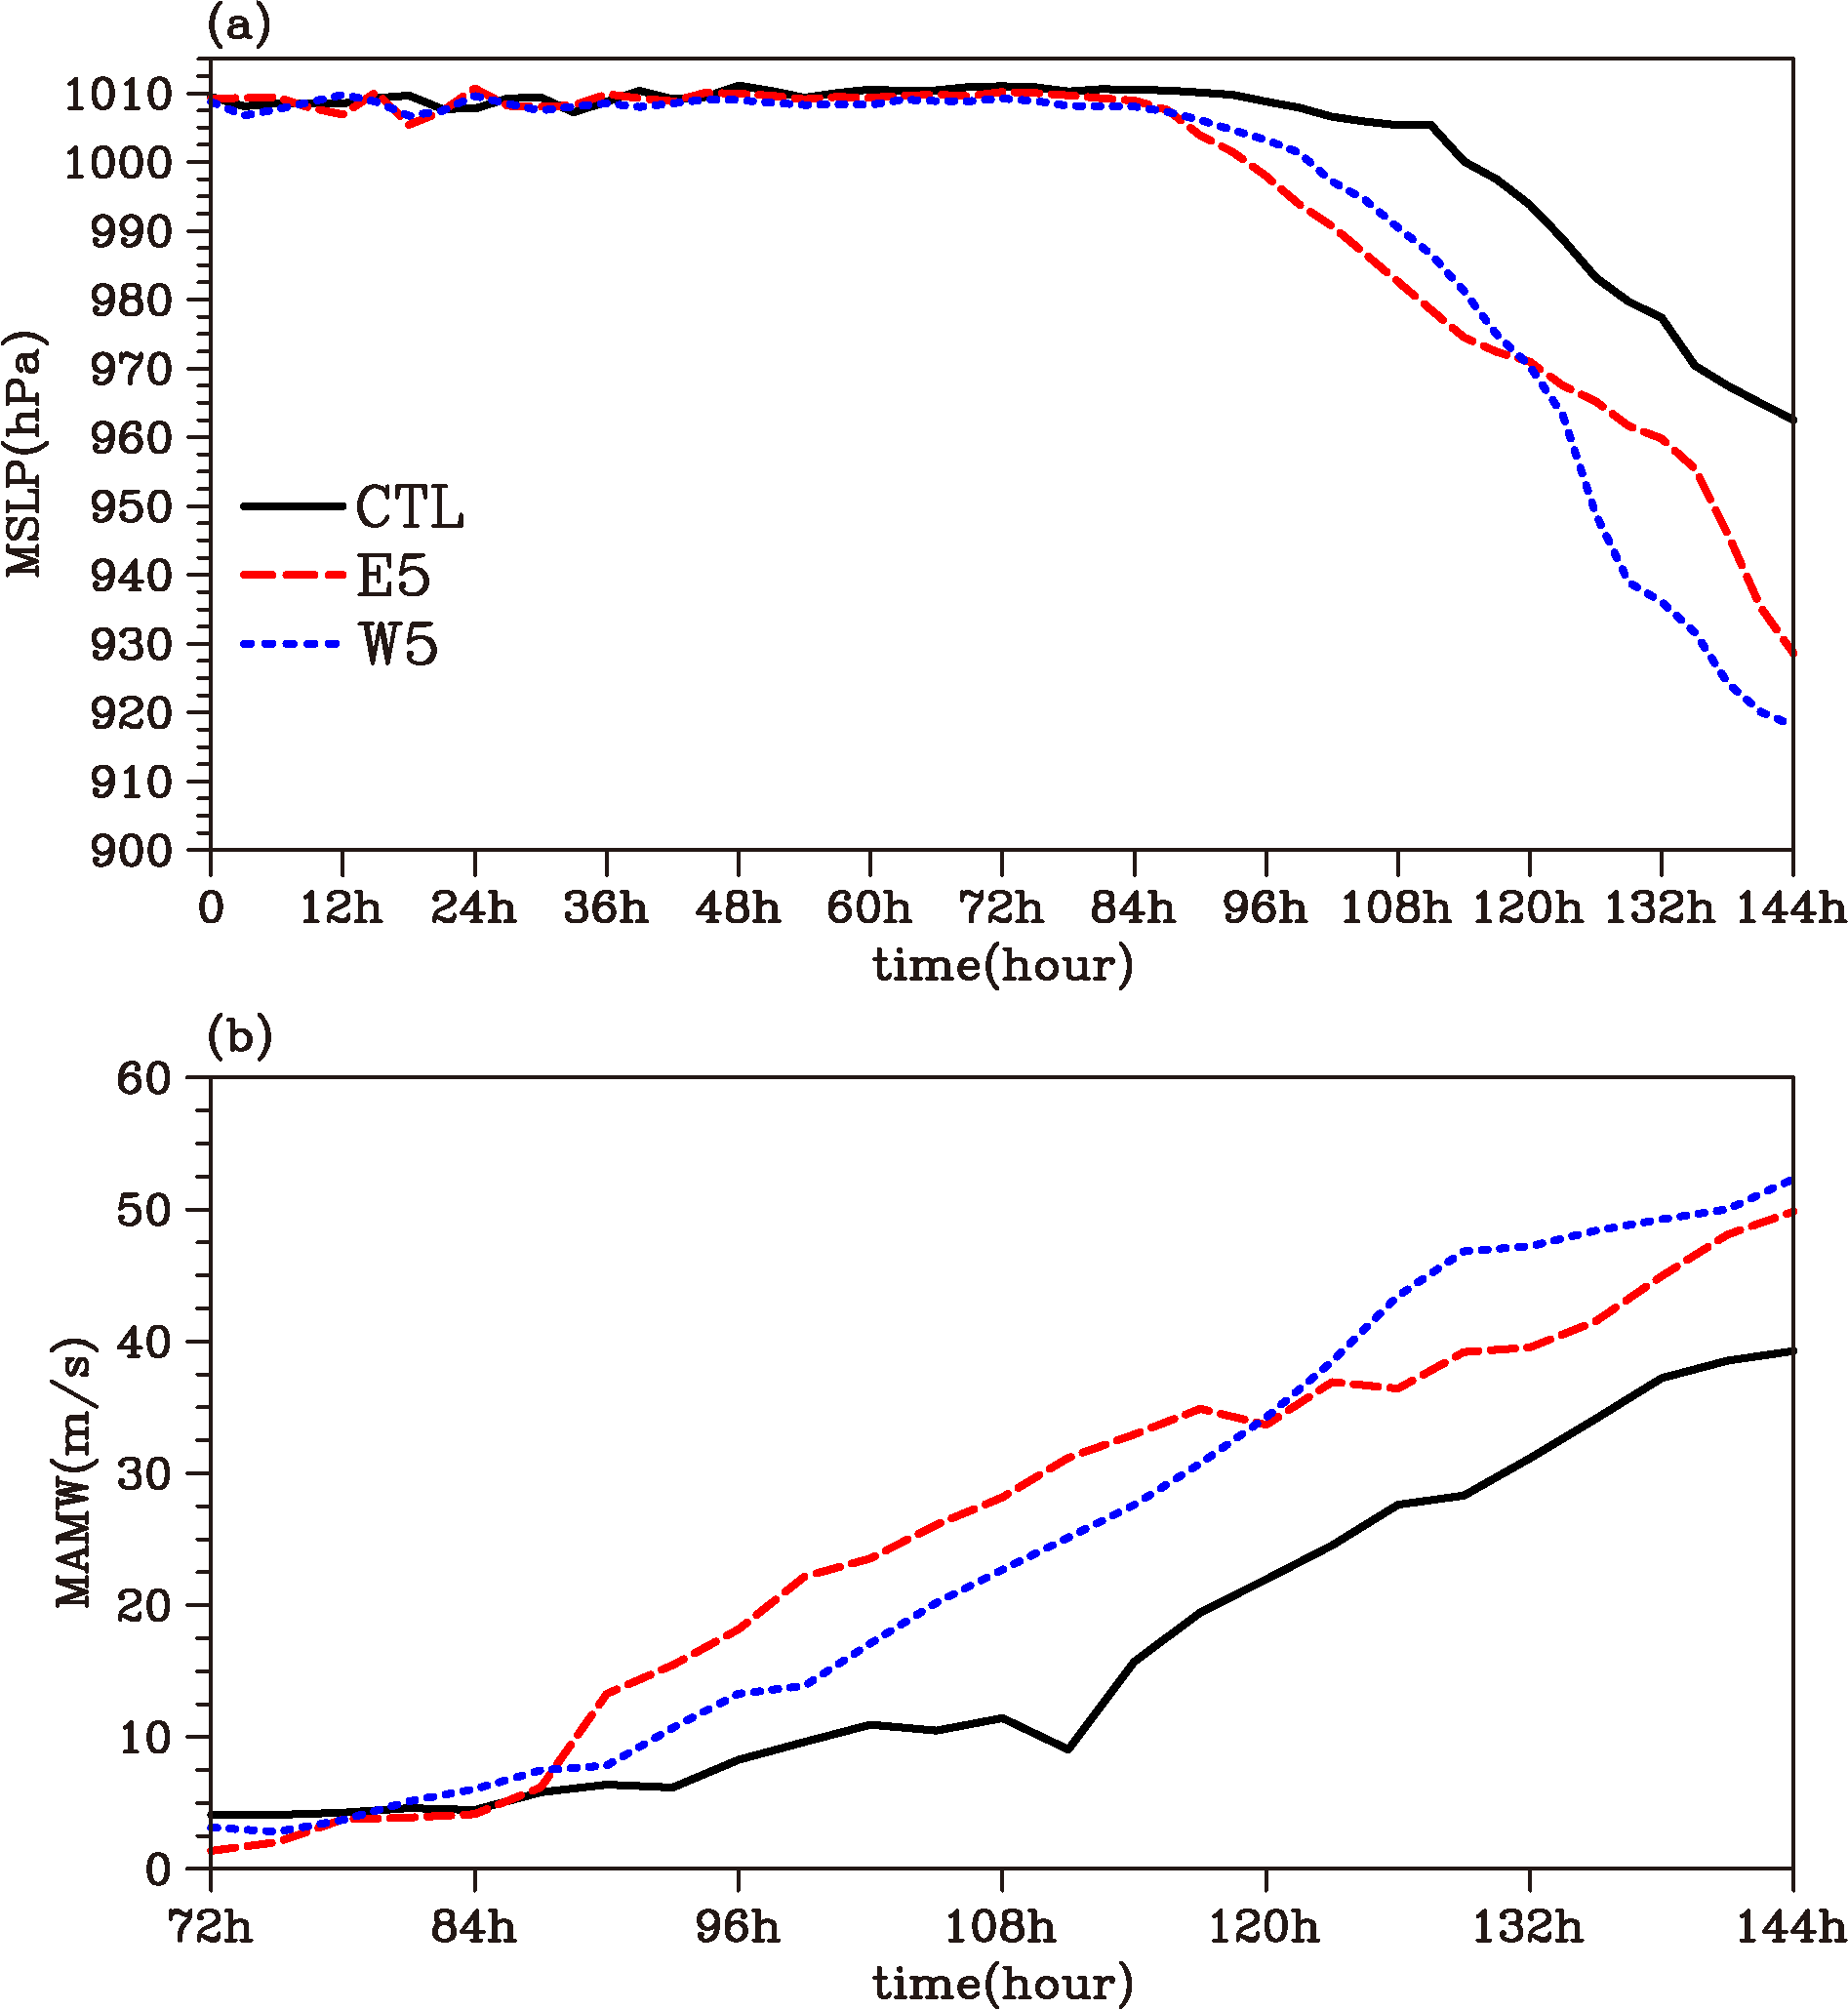 | Figure 2 Temporal evolution of the (a) minimum sea level pressure (MSLP) (hPa) and (b) maximum azimuthal mean wind speed (m s-1) at 10 m height in the CTL (black solid), E5 (red dashed), and W5 (blue dotted) experiments. The abscissa represents time (h), while the ordinate corresponds to the value of intensity. |
Based on previous studies and the above results, the following hypothesis is formulated: As described by Peng et al. (1999), on a beta plane a wavenumber-one wind circulation oriented from southeast to northwest is induced (Fiorino and Elsberry, 1989). In the genesis stage of weak vortices, uniform zonal flows imposed into vortices produce substantial upward heat and moisture fluxes from the ocean. The superposition of the easterly flows and beta effect could enhance the magnitude of symmetric surface heat fluxes and convection around the TC center, as compared with westerly flows. The stronger diabatic heating in the high level and cooling in the lower level induces a greater vertical temperature gradient, which is favorable for the enhancement of mid-level circulation. Then, the strong mid-level circulation enhances the efficiency of the conversion of latent heat energy to the kinetic energy of the cyclonic winds (Nolan et al., 2007). However, in the intensification stage of TCs, when the asymmetry of convection produced by the uniform zonal flows and beta effect is strong enough, it leads to the development of vertical wind shear, as described by Wong and Chan (2004) and Li et al. (2014), which is considered a destructive factor for weakening TCs. This vertical wind shear difference results in the subsequent TC intensification rate difference. This second process during the intensification stage of a TC can be referred to in the studies of Peng et al. (1999) and Kwok and Chan (2005). They found that easterly uniform flows tend to strengthen the beta-induced vertical shear, whereas uniform westerly flows appear to reduce it by altering the magnitude and direction of the shear vector. For brevity, the following analysis in this paper focuses on the first process of this hypothesis.
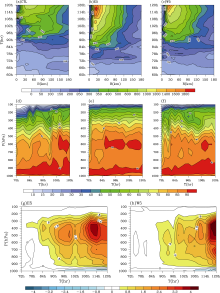
Figure 3 (top) shows the time radial cross section of azimuthal-mean surface heat fluxes in CTL, E5, and W5 from t = 60 h to t = 120 h. The surface heat fluxes include the sensible and latent heat components. When uniform easterly winds are imposed onto the beta plane, the maximum flows are generated on the north side. In this respect, the maximum surface heat fluxes are located on the north side of the TC center. Whereas, the beta effect and uniform westerly winds together produce the maximum surface heat fluxes on the south side of the vortex (figure not shown). It is found that non-zero uniform flows induce greater azimuthal-mean surface heat fluxes in E5 and W5 compared to CTL (Figs. 3a-c). Meanwhile, the azimuthal-mean surface heat fluxes in E5 are relatively stronger than those in W5 beginning from t = 72 h (Figs. 3b and 3c). This indicates that the superposition of the uniform easterly flows and beta effect enhances the magnitude of symmetric surface heat fluxes compared with uniform westerly flows. Accordingly, the relative humidity field also has different features in E5 and W5. For instance, the contour of 90% relative humidity begins to appear around 600 hPa at t = 84 h in E5 (Fig. 3e), while its development delays to t = 108 h in W5 (Fig. 3f). It is the setup of the moist air column that preconditions the outbreak of convection and the genesis of a TC (Nolan, 2007; Cao et al., 2014b). Figure 3 (bottom) shows the vertical-time cross section of diabatic heating averaged over 120 × 120 km centered on the TC center from t = 72 h to t = 120 h for E5 and W5. It is found that diabatic heating develops earlier and becomes stronger in E5 than that in W5 before t = 114 h (Figs. 3g and 3h). This indicates that the greater surface heat fluxes give rise to more moisture in the atmosphere from the ocean in E5 than in W5. The enhanced atmospheric moisture can support stronger convection with strengthened diabatic heating. However, the development of diabatic heating after t = 114 h in E5 and W5 implies a subsequently faster intensification rate of the TC in W5 than in E5, which is consistent with previous studies (Peng et al., 1999; Kwok and Chan, 2005). This difference during the genesis and intensification periods indicates that different processes control TC evolution. The surface heat fluxes and vertical wind shear may be two factors responsible for TC development during both periods in E5 and W5. Figures 4a and 4b display the vertical-time cross section of the temperature anomaly from t = 72 h to t = 90 h in E5 and W5.
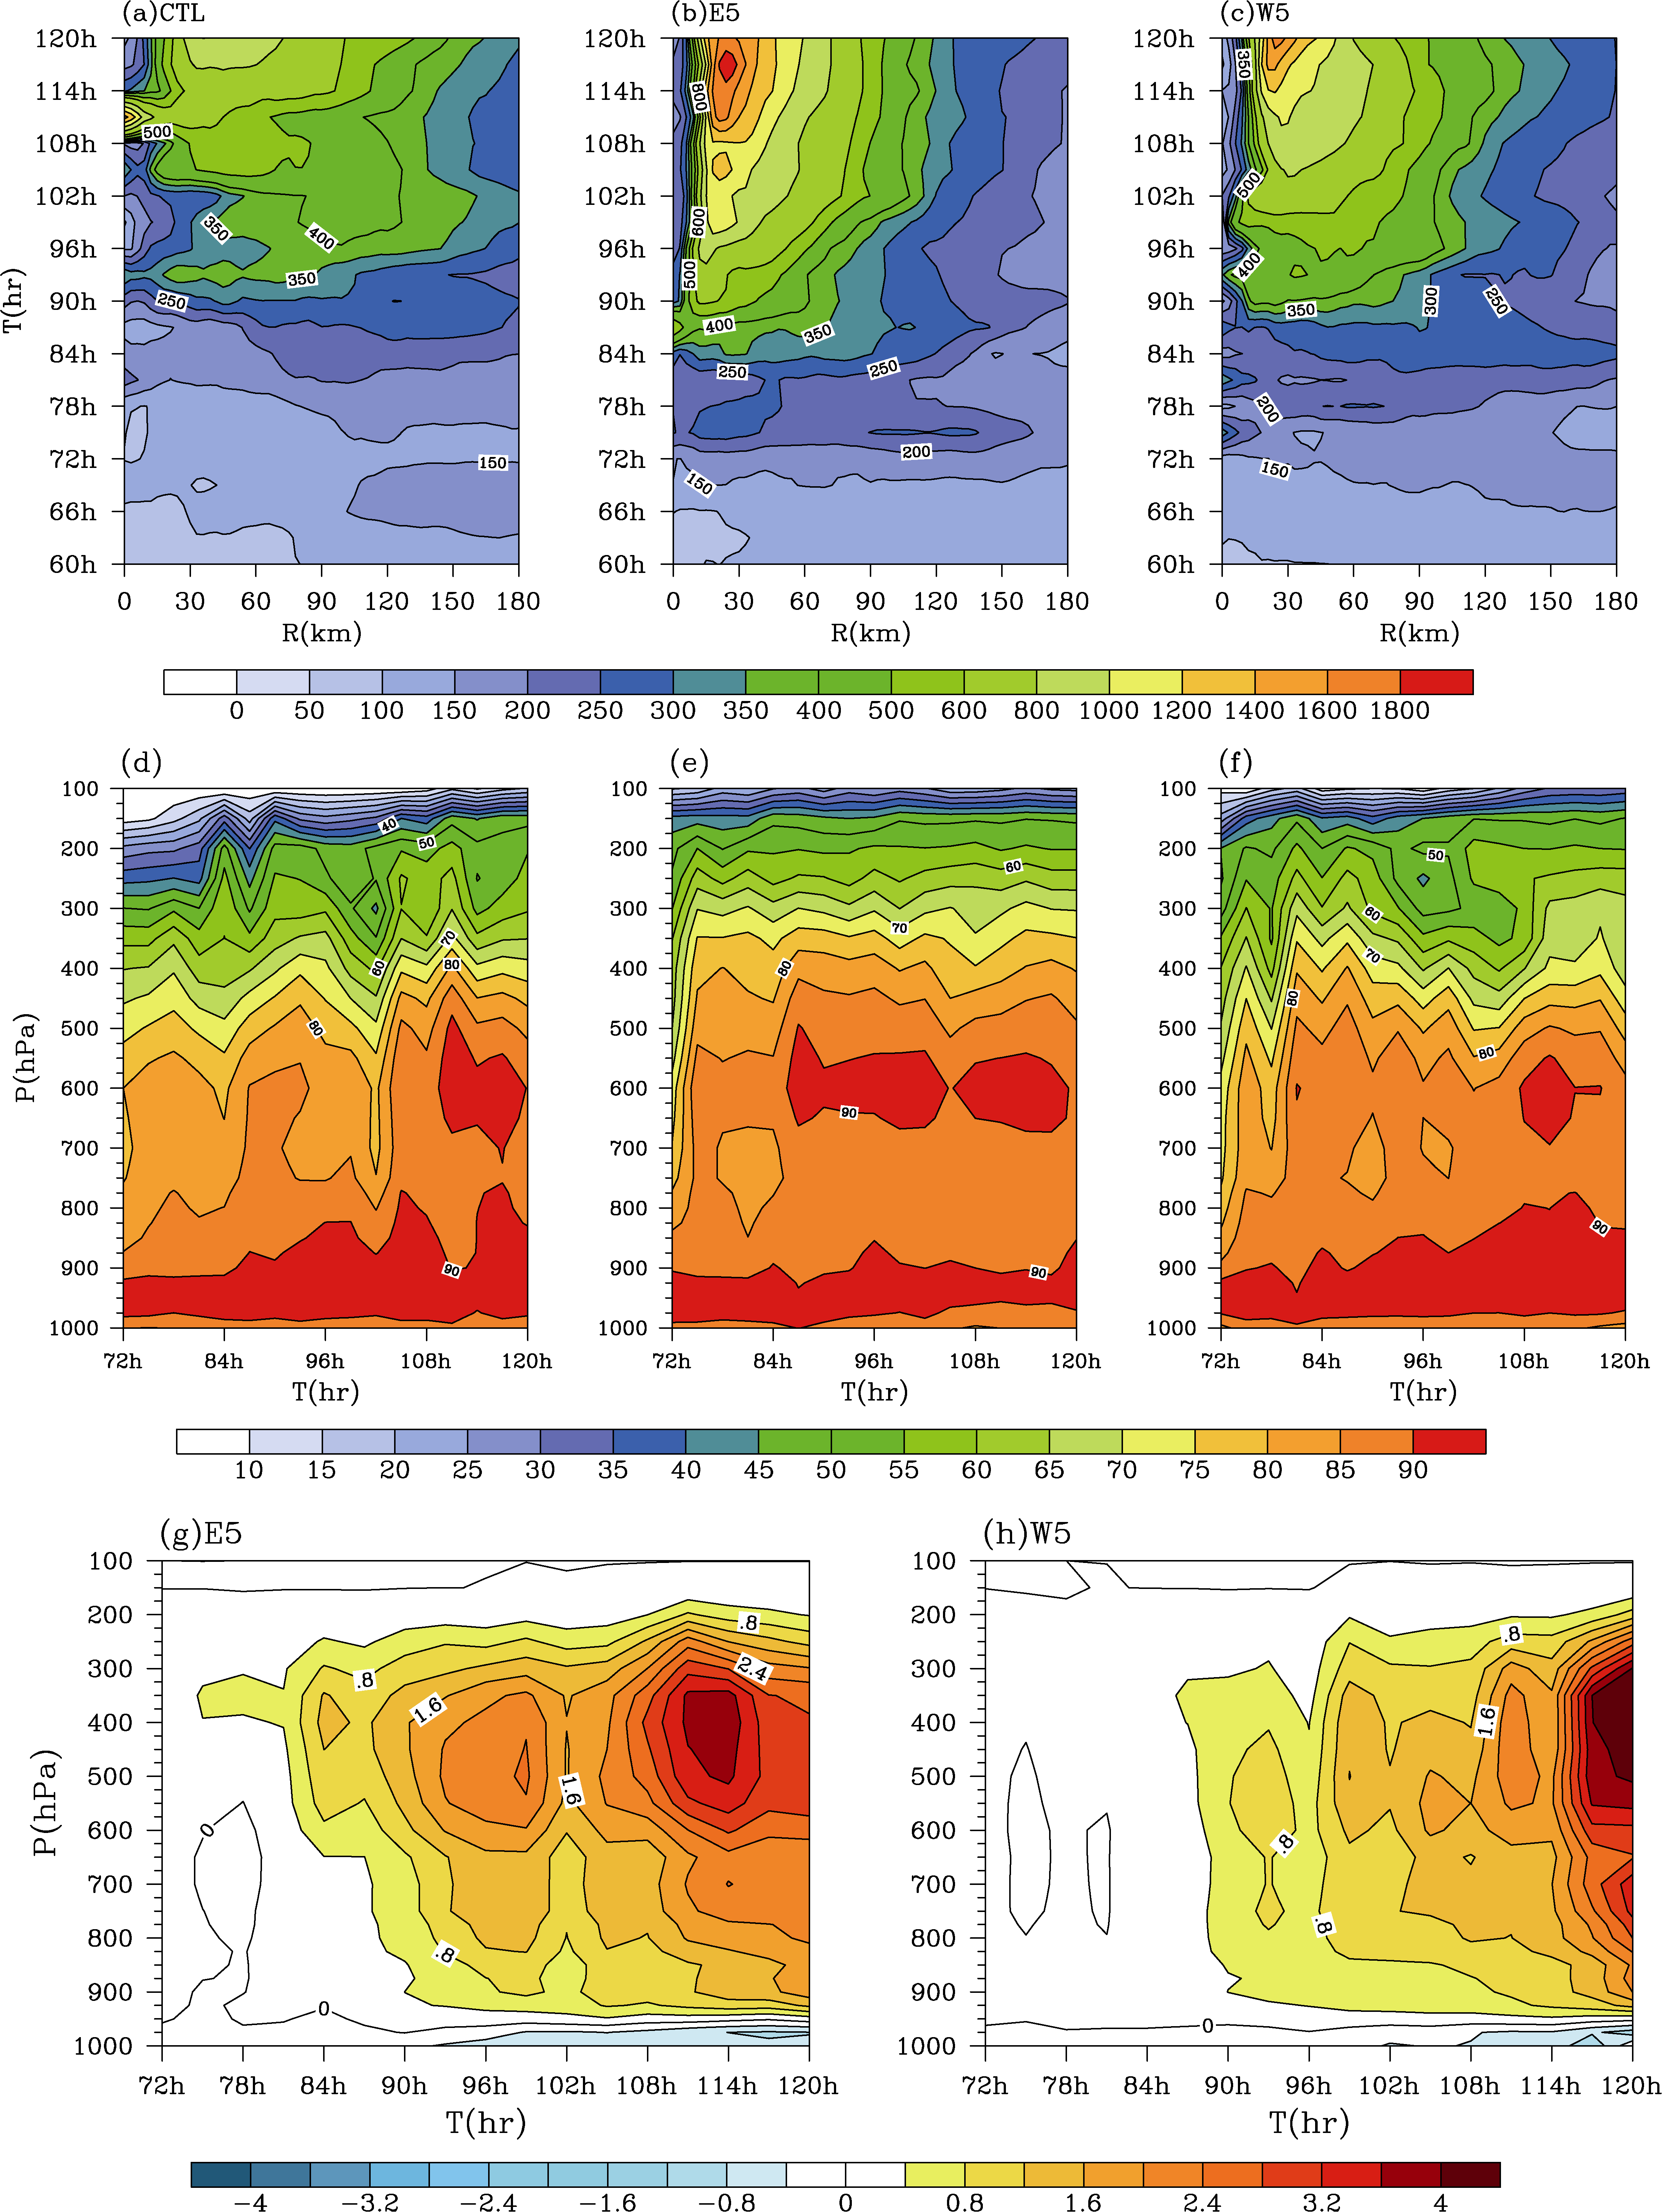 | Figure 3 Top: time-radial cross section of the azimuthal-mean surface heat flux (W m-2) in (a) CTL, (b) E5, and (c) W5 from t = 60 h to t = 120 h. Middle: vertical-time evolution of area-averaged (180 × 180 km) relative humidity (%) from t = 72 h to t = 120 h in (d) CTL, (e) E5, and (f) W5. Bottom: as in (e, f) but for diabatic heating (10-3 K s-1) for (g) E5 and (h) W5. |
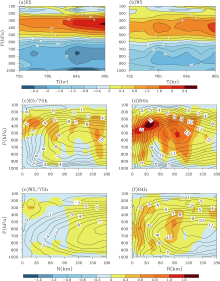
 | Figure 4 Top: vertical-time cross section of perturbation temperature (K) averaged over 120 × 120 km centered on the TC from t = 72 h to t = 90 h for (a) E5 and (b) W5 subtracted from the area-averaged temperature over the whole innermost domain. Middle-bottom: vertical-radial cross section of azimuthal-mean tangential wind (contours, m s-1) and diabatic heating (color scale, 10-3 K s-1) at (c, e) t = 75 h and (d, f) t= 84 h for (c, d) E5 and (e, f) W5. |
Herein, the temperature anomaly is defined as the departure from the mean temperature over the whole innermost domain. It is clear that the temperature vertical gradient is larger in E5 than in W5, which is associated with the development of mid-level circulation (Houze, 2004). Figures 4c-f further show the vertical-radial cross section of azimuthal-mean tangential wind and diabatic heating at t = 75 h and t= 84 h in E5 and W5. At t = 75 h, the maximum of mid-level tangential wind is 10 m s-1 in E5 (Fig. 4c), whereas it is 8 m s-1 in W5 (Fig. 4e). Afterwards, the mid- level circulation develops strongly in E5, with a maximum wind of 14 m s-1 (Fig. 4d). Meanwhile, the distribution of diabatic heating is more compact and concentrated at t = 84 h in E5 than in W5 (Figs. 4d and 4f). It is noteworthy that the positions of the positive temperature anomaly and diabatic heating in E5 are higher than in W5 (Figs. 4a-f). Thus, the mid-level circulation in E5 is lifted higher and, correspondingly, the tangential wind in the lower level is weaker in E5 than that in W5 before t= 84 h (Fig. 2). According to the hydrostatic equation, given the same pressure difference, the positive temperature anomaly in the higher level is associated with the greater vertical geopotential difference. This may be favorable for the subsequent development of lower-level inflow and upper-level outflow, resulting in the faster development of the vortex in E5 than in W5.
Previous studies on the effects of uniform zonal winds on TC vortices have focused on the intensity and structural changes of the TC, not on TC genesis (Peng et al., 1999; Dengler and Keyser, 2000; Kwok and Chan, 2005). Although in the real atmosphere TCs rarely exist in constant uniform zonal flows, idealized modeling provides insights into the interaction between uniform zonal flows and TCs on a beta plane so that TC genesis in such an idealized background can be examined in detail.
Model results show that, during the genesis stage of a TC, uniform easterly flows can result in a faster genesis rate of the TC due to the superposition of uniform easterly winds and beta effect. The beta effect generates maximum surface heat fluxes in the northeastern quadrant of the vortex. The uniform easterly flows can enhance the magnitude of symmetric surface heat fluxes compared with uniform westerly flows. During the early stage, when the vertical wind shear is not strong enough, the greater symmetric surface heat fluxes can induce enhanced convection and diabatic heating. Afterwards, the azimuthal- mean diabatic heating above and cooling below are increased, which is associated with the enhanced mid-level circulation during the early stage. The strong and compact mid-level vortex is more favorable for the efficient conversion of latent heat energy to the kinetic energy of the TC. The above processes resulted in a faster genesis rate of TC in E5 than in W5 in the present study.
Even though the cases examined in the present study were under idealized conditions, the difference in TC genesis between conditions of uniform westerly and easterly flows may provide some guidance in terms of the real atmosphere. Because easterly flow is associated with subtropical anticyclones, they could be a useful factor in predicting the characteristics of TC genesis. In terms of future work, the intension is to carry out a series of experiments to investigate the sensitivity of vortex development to the magnitudes of uniform zonal winds and the various physics schemes of the mesoscale model.
| [1] |
|
| [2] |
|
| [3] |
|
| [4] |
|
| [5] |
|
| [6] |
|
| [7] |
|
| [8] |
|
| [9] |
|
| [10] |
|
| [11] |
|
| [12] |
|
| [13] |
|
| [14] |
|
| [15] |
|
| [16] |
|
| [17] |
|
| [18] |
|
| [19] |
|
| [20] |
|
| [21] |
|
| [22] |
|
| [23] |
|