Change in Sea Ice Cover is Responsible for Non-Uniform Variation in Winter Temperature over East Asia
[LI Fei1  , WANG Hui-Jun
1, 2, 3 , GAO Yong-Qi1, 4 ]
, WANG Hui-Jun|
|


Observed winter (December-February) surface air temperature over East Asia (0°-60°N, 100- 140°E) ( TEA) shows non-uniform variation during 1979- 2013, with cooling and weak warming north and south of 40°N. To understand this, the authors perform statistical analysis (linear regression and composite) on the observed data. The results suggest that reduced (increased) autumn sea ice cover in the Barents-Kara Sea (BK-ASIC) lowers (warms) TEAover northern East Asia, which is consistent with previous studies. In comparison, increased (decreased) winter sea ice cover in the Sea of Okhotsk (O-WSIC), warms (cools) the air over southern East Asia. The mechanism can be described as follows: When the BK-ASIC decreases, the East Asian winter monsoon tends to be stronger with an intensified Siberian high, leading to cooling over northern East Asia. An O-WSIC increase is associated with cold anomalies north of 50°N, altering the meridional temperature gradient between the midlatitudes and tropics, and leading to a northward shift of the East Asian jet steam in the upper troposphere. In the low atmosphere, anomalous northeasterly winds prevail north of 50°N and anomalous southerly winds control the southern coast of East Asia, contributing to the weak warming over southern East Asia. Version 3 of the Community Atmosphere Model also provides evidence for the impact of increased O-WSIC on the warm southern mode of TEA.
The East Asian winter temperature (TEA) is influenced by the East Asian winter monsoon (EAWM) system, which includes the Siberian high in the low atmosphere, the East Asian trough in the middle troposphere, and the East Asian jet stream in the high troposphere, and is one of the most active climate systems during boreal winter. Using atmospheric reanalysis data, Wang et al. (2010) found that TEA variation shows two distinct principal modes, with large negative amplitudes north and south of 30° N, which together account for 74% of the TEA variance for the period 1957-2006. They also indicated that the northern mode is preceded by excessive autumn snow cover over the Eurasian continent, whereas the southern mode is preceded by development of La Niñ a episodes on the interannual timescale.
Sea ice plays an important role in the climate system due to its high albedo and its insulation of the direct exchange of energy and mass between the atmosphere and the ocean. Satellite observations (from 1979 to present) have indicated that Arctic sea ice cover has declined over recent decades and that the rate of decline is increasing (e.g., Comiso et al., 2008). Thus, the climate impacts from declining Arctic sea ice cover by analyzing observational data and performing numerical simulations have become a major focus of recent climate research (e.g., Li and Wang, 2012, 2014; Wu et al., 2013; Vihma, 2014; Gao et al., 2015; Wang et al., 2015). Honda et al. (2009) revealed that the remote response in early winter is regarded as a stationary Rossby wave generated thermally through anomalous turbulent heat fluxes as a result of anomalous ice cover over the Barents-Kara Sea in late autumn, which tends to induce an amplification of the Siberian high, causing colder conditions over the Far East for the period 1978-2007. Wu et al. (2011) also revealed that autumn- winter heavy ice cover in the eastern Arctic and Greenland-Barents-Kara seas cause winter negative sea level pressure (SLP) anomalies over northern Eurasia and the northern North Atlantic. These anomalies lead to a weakened Siberian high and strengthened westerlies over the mid-high latitudes of Eurasia for the period 1979-2009. Liu et al. (2012) suggested that the atmospheric circulation change linked to the reduction of autumn Arctic sea ice cover (ASIC) shows more frequent episodes of blocking patterns that lead to increased cold surges over large parts of northern continents.
It should be noted that winter climate (e.g., atmospheric circulation and cold extremes) changes are also associated with winter Arctic sea ice cover (WSIC) reduction through an apparently distinct mechanism from that related to ASIC loss (Honda et al., 1999; Li and Wang, 2013; Tang et al., 2013). Wu et al. (1999) showed that the variation of WSIC in the Barents-Kara Sea is closely associated with that of the EU teleconnection pattern at 500 hPa and EAWM intensity for the period 1953-1989. Mori et al. (2014) found that the atmospheric response to WSIC reduction in the Barents-Kara Sea is approximately independent of the Arctic Oscillation for the period 1979- 2012. They suggested that ice cover decline leads to more frequent Eurasian blocking situations, which favor cold- air advection to Eurasia and hence severe winters.
In this study, we attempt to examine the effects of ASIC and WSIC anomalies on the non-uniform variation of TEA on the interannual timescale. Based on the study results, we claim that the ASIC and WSIC are relatively independent in influencing the northern and southern modes of TEA, through distinct mechanisms.
The two datasets employed in this research include European Center for Medium-Range Weather Forecasts Interim Reanalysis (ERA-Interim) (Simmons et al., 2006), using variables including 1000 hPa air temperature (T1000), SLP, 1000 and 850 hPa zonal and meridional winds (UV1000 and UV850), 500 hPa geopotential height (Z500), and 200 hPa zonal wind (U200); and version 1 of UK Meteorological Office Hadley Centre Sea Ice and SST (HadISST1) (Rayner et al., 2003). All data cover the period from December 1979 to February 2014. Winter (December-February) seasonal mean data are used for analysis. The Niñ o3.4 index is available from http://www.cpc.ncep.noaa.gov/products/analysis_monitoring/ensostuff/ensoyears.shtml. In this paper, all data (e.g., atmosphere, sea ice) and indices have been detrended prior to analysis.
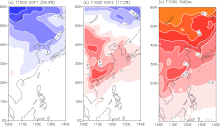
We perform EOF analysis on winter T1000 anomalies in the EAWM domain (0° -60° N, 100-140° E) during 1979-2013. The first EOF mode (Fig. 1a) accounts for 59.0% of the total temperature variance and reflects a consistent negative anomaly pattern over northern East Asia (north of 40° N), with the magnitude decreasing southward. The second EOF mode (Fig. 1b) explains 17.2% of the total temperature variance. It indicates a pattern with opposite variation north and south of 50° N, with a strong positive anomaly over southern East Asia. Analysis of the eigenvalues suggests that the two leading modes are significantly distinct from each other and from the rest of the eigenvectors in terms of sampling error above the 95% confidence level (North et al., 1982). Similar results were presented in Wang et al. (2010) based on 2 m air temperature. As shown in Fig. 1c, the areas with large variation in surface air temperature (greater than 1.2 standard deviation) are located over northern and southern East Asia. Figure 2 illustrates the corresponding principal components (PCs) of the two modes (black line). PC1 and PC2 clearly show strong interannual variation.
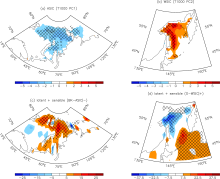
It is of interest to see whether these two modes are related to the Arctic sea ice cover anomalies. Figure 3 illustrates the anomalous ASIC and WSIC regressed against standardized T1000 PC1 and PC2, respectively. When T1000 PC1 is high (corresponding to the cold northern mode of TEA), a negative ASIC anomaly area is obvious in the Barents-Kara Sea only (Fig. 3a). The T1000 PC1 has no significant correlation with the WSIC anomaly (figure not shown), suggesting its independence from WSIC. In comparison, when the T1000 PC2 is high (corresponding to the warm southern mode of TEA), the WSIC anomaly with the largest extent appears in the Sea of Okhotsk (Fig. 3b). Meanwhile, the WSIC anomaly in the Arctic region is sporadic, located in the Barents-Kara Sea and marginal seas of Greenland (figure not shown). Considering the potential impact of winter sea ice in the Greenland-Barents Sea has been well documented by Claude et al.(2014), in the present study we focus mainly on the winter sea ice in the Sea of Okhotsk. According to Figs. 3a and 3b, the negative averaged ASIC in the Barents-Kara Sea (70-85° N, 25-125° E) and positive averaged WSIC in the Sea of Okhotsk (45-63° N, 135-160° E) are defined as the BK-ASIC|- (Fig. 2a, blue line) and O-WSIC|+ (Fig. 2b, red line) indices, respectively.
 | Figure 1 The (a) first and (b) second modes of the EOF analysis (× 100) for the winter T1000 anomalies in the East Asian winter monsoon domain (0° -60° N, 100-140° E) during 1979-2013. The numbers in brackets indicate the fractional variance of the EOF modes. (c) Standard deviation for the winter T1000 during 1979-2013. All data and indices have been detrended. |
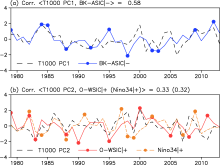
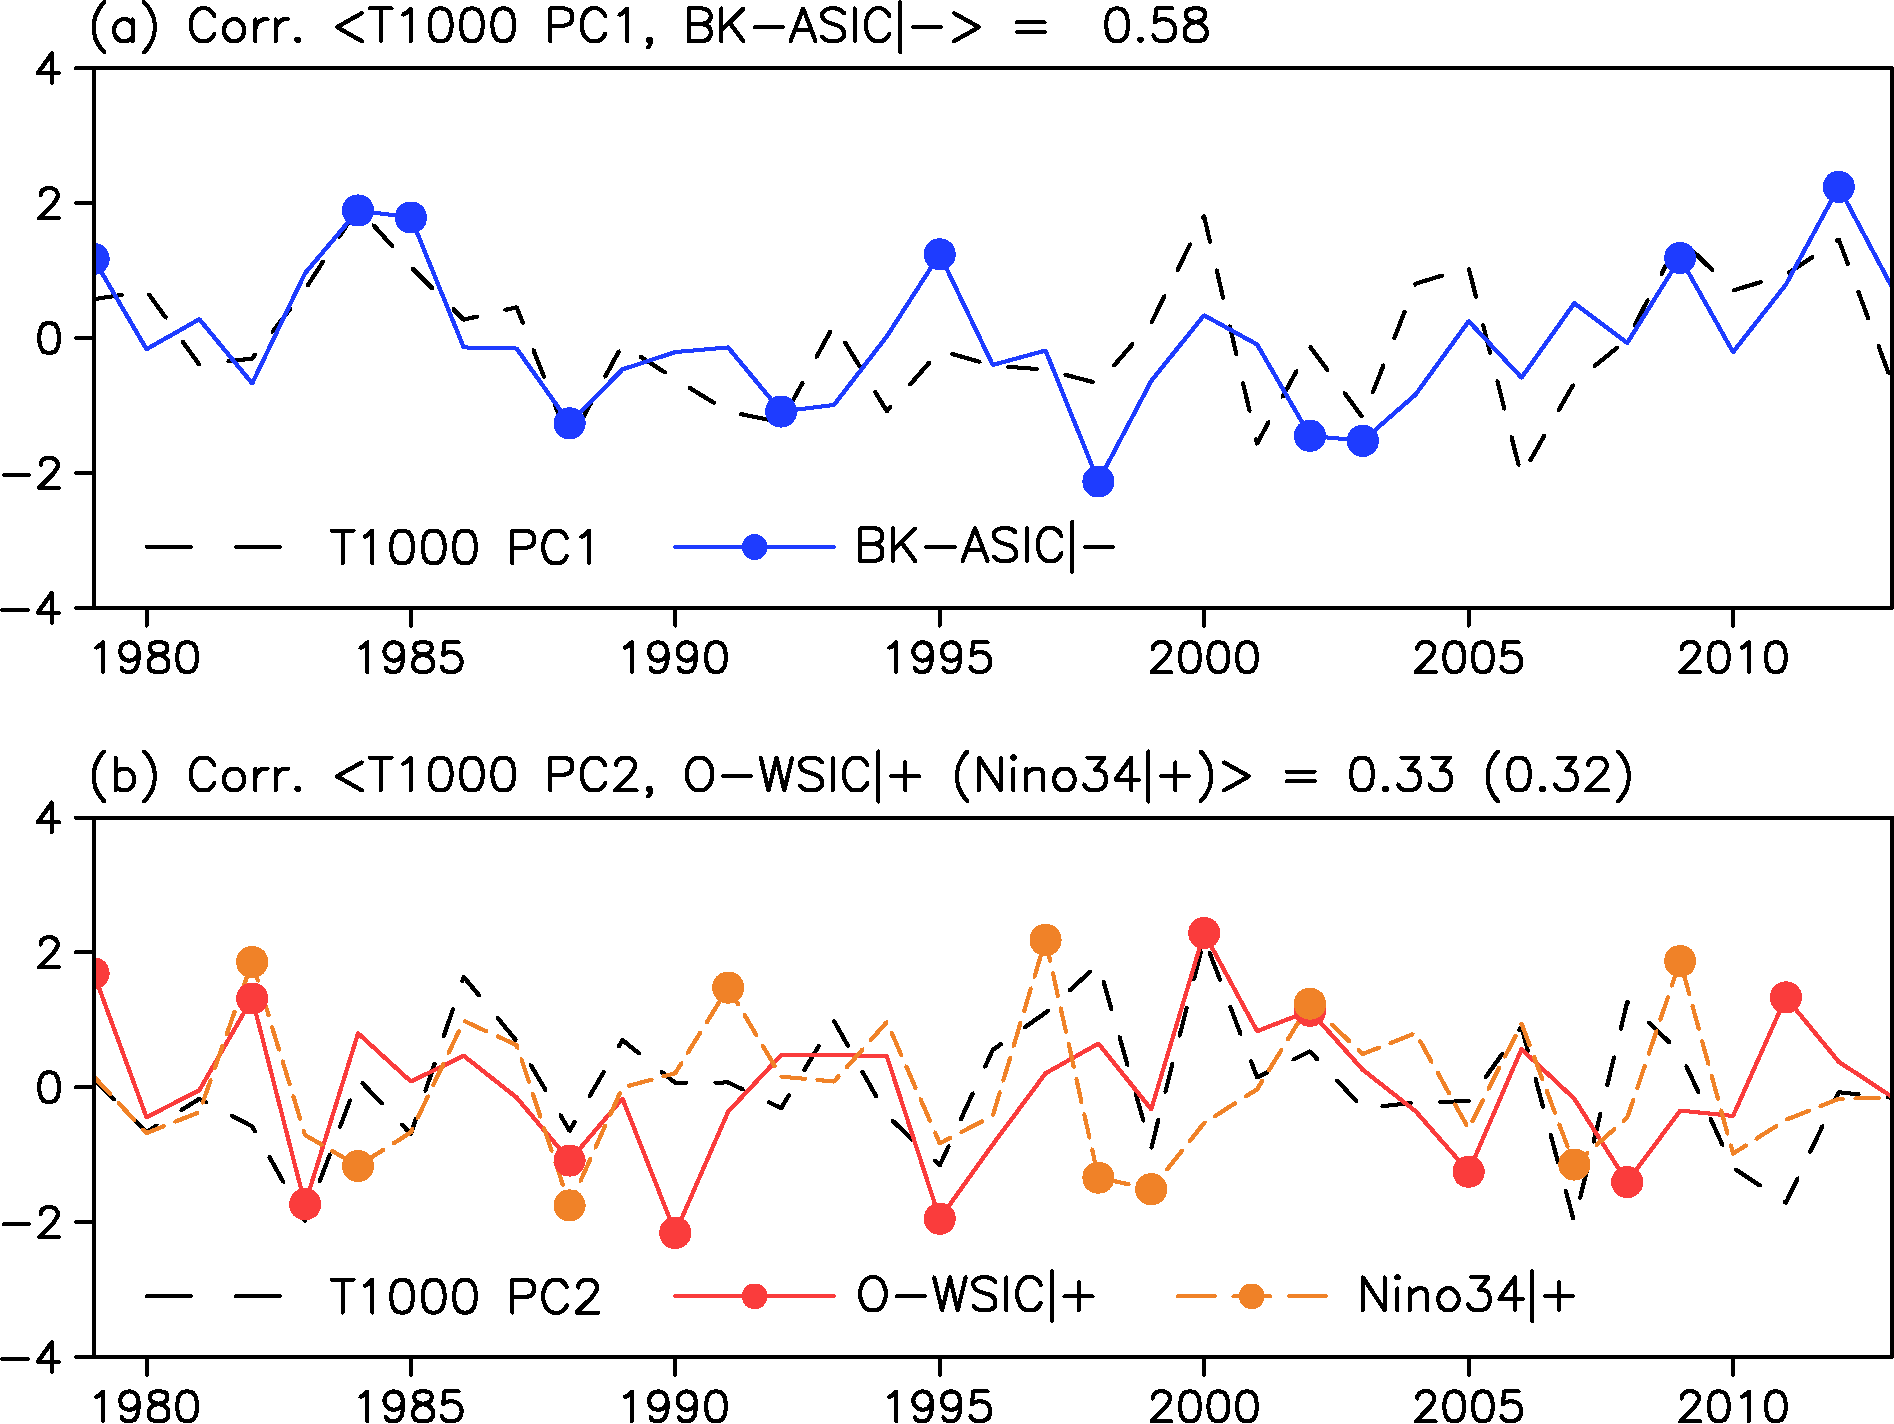 | Figure 2 (a) The corresponding principal component (PC) of the EOF1 mode (T1000 PC1, black line) and the negative averaged autumn-mean sea ice cover in the Barents and Kara seas (BK-ASIC|-, blue line, in the domain of (70-85° N, 25-125° E)) index for 1979-2013. (b) The corresponding PC of the EOF2 mode (T1000 PC2, black line), the positive averaged winter sea ice cover in the Sea of Okhotsk (O-WSIC|+, red line, in the domain of (45-63° N, 135-160° E)) and the winter Niñ o3.4|+ (orange line) indices. Both (a) and (b) are in units of standard deviation. |
To further explore whether changes in sea ice can influence the overlying atmosphere by changing the surface albedo and air-sea turbulent fluxes, the lower panel of Fig. 3 illustrates the anomalous autumn and winter surface turbulent heat flux (latent + sensible) against standardized BK-ASIC|- and O-WSIC|+, respectively. Positive values indicate above-normal heat transfer from the ocean to the atmosphere. As anticipated, where the sea ice is reduced (enhanced), there are simultaneous above- normal (below-normal) heat flux anomalies. The largest heat flux change can be ~20 (-45) W m-2 in the Barents-Kara Sea (Sea of Okhotsk). Taken together, reduced ASIC in the Barents-Kara Sea (BK-ASIC|-) is significantly related to the cold northern mode of TEA, but the WSIC anomaly has no significant effect on the cold northern mode. The warm southern mode can be mainly attributed to increased WSIC in the Sea of Okhotsk (O-WSIC|+).This suggests that the non-uniform change in the spatial distribution of TEAcan likely be explained by the changes in the BK-ASIC and O-WSIC.
 | Figure 3 Regression patterns of (a) autumn and (b) winter Arctic sea ice cover (color scale; units: 102 km2) anomalies against standardized T1000 PC1 and PC2 during 1979-2013, respectively. Hatched regions indicate significant values based on the (a) 95% and (b) 90% confidence level from a two-tailed Student’ s t-test. Regression patterns of (c) autumn and (d) winter surface turbulent heat flux (colour scale; units: W m-2) anomalies against standardized BK-ASIC|- and O-WSIC|+, respectively. Hatched regions indicate significant values based on the 95% confidence level from a two-tailed Student’ s t-test. |
It is noted that the BK-ASIC|- (blue line) is in phase with the T1000 PC1 (Fig. 2a). The correlation coefficient between the BK-ASIC|- and T1000 PC1 is 0.58 (statistically significant at p < 0.05). The O-WSIC|+ (red line) is in phase with the T1000 PC2 (Fig. 2b), with a coefficient of 0.33 (statistically significant at p < 0.1). Furthermore, we note that the BK-ASIC|- and O-WSIC|+ vary inconsistently. They correlate near zero (Table 1), indicating that they are relatively independent in influencing the TEA.
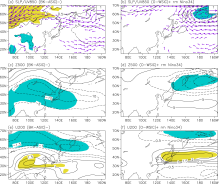
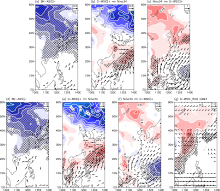
Next, we investigate changes in large-scale atmospheric circulation associated with BK-ASIC|- and O-WSIC|+. Figure 4 illustrates the anomalous SLP/UV850, Z500, and U200 regressed against standardized BK-ASIC|- and O-WSIC|+. Please note that we linearly removed the ENSO signal (represented by the Niñ o3.4 index) before performing the regression. The regressed SLP/UV850 against the BK-ASIC|- (Fig. 4a) shows a large-range continental anticyclonic anomaly north of 40° N, indicating a stronger Siberian high. At the eastern margin of the strengthened Siberian high, anomalous northerly winds intrude into northern East Asia. In the middle troposphere, the East Asian trough, which is climatologically anchored along the coast of East Asia, becomes deeper (Fig. 4c). In the upper troposphere, the East Asian jet stream near 25-45° N accelerates, and a westerly flow to the north weakens (Fig. 4e). In contrast, the regressed SLP/UV850 against the O-WSIC|+ (Fig. 4b) shows a significantly extratropical marine cyclonic anomaly north of 40° N. That is to say, the Aleutian low appears deeper and more northward. A slight and insignificant high-pressure anomaly center is also seen in the Sea of Okhotsk. Along the northern margin of the northward shifted Aleutian low, anomalous northeasterly winds are significantly north of 50° N, whereas anomalous southerly winds control the southern coast of East Asia. Consistently, the main features in the middle and upper troposphere are northward shifts of the East Asian trough and East Asian jet stream near 30-50° N, respectively (Figs. 4d and 4f).
| Table 1 Correlation coefficients (Corr.) among the T1000 PC1 and PC2, BK-ASIC|-, O-WSIC|+, and Niñ o3.4|+ indices for the period 1979-2013. |
Taken together, in correspondence with BK-ASIC|-, the EAWM system, including the Siberian high, East Asian trough, and East Asian jet stream, tends to be stronger. Anomalous northerly winds dominate northern East Asia, bringing cold air from high latitudes and leading to a decrease in air temperatures. These results are consistent with Honda et al. (2009), but different from Wu et al. (2011), because we emphasize the remote atmospheric response in winter due to BK-ASIC|- (without successive BK-WSIC|-). Corresponding to O-WSIC|+, the Aleutian low, East Asian trough and East Asian jet stream appear more northward. Anomalous northeasterly winds prevail north of 50° N and anomalous southerly winds control the southern coast of East Asia, facilitating warm air transport from the tropical oceans to southern East Asia.
 | Figure 4 Regression patterns of winter (a, b) sea level pressure (contours; units: hPa)/UV850 (vectors; units: m s-1), (c, d) Z500 (contours; units: gpm), and (e, f) U200 (contours; units: m s-1) anomalies against standardized BK-ASIC|- (left column) and O-WSIC|+ (right column) (Niñ o3.4|+ removed) during 1979-2013. Yellow and blue shaded regions indicate significant positive and negative values based on the 95% confidence level from a two-tailed Student’ s t-test. For display, the zero line is ignored. |
The upper panel of Fig. 5 illustrates the regression patterns of anomalous T1000/UV1000 against standardized BK-ASIC|-, O-WSIC|+ (Niñ o3.4|+ removed) and Niñ o3.4|+ (O-WSIC|+ removed). As anticipated, the structures shown in Figs. 5a and 5b closely resemble the structures of the northern and southern modes (Figs. 1a and 1b). A minor difference is apparent in Fig. 5b, in which the largest positive anomaly is located in the East China Sea. Further evidence comes from the composite patterns of anomalous T1000/UV1000 around standardized BK-ASIC|-, O-WSIC|+ (Niñ o3.4|+ removed), and Niñ o3.4|+ (O-WSIC|+ removed) (Fig. 5, lower panel). According to the temporal behavior of the three indices, we select high (low) cases based on the absolute values of the indices > 1.0 (< 1.0) standard deviation (Table 2). Again, Figs. 5d and 5e share the same structures of the northern and southern modes (Figs. 1a and 1b), with the largest positive anomaly loading in the East China Sea. It is worth noting that the O-WSIC|+ induces cold anomalies north of 50° N, altering the meridional temperature gradient between the midlatitudes and tropics, and leading to a northward shift of the East Asian jet steam in the upper troposphere, which may be a reason why the O-WSIC|+ is significantly associated with the warm southern mode of TEA.
 | Figure 5 Regression patterns of winter T1000 (colour scale; units: ° C)/UV1000 (vectors; units: m s-1) anomalies against (a) standardized BK- ASIC|-, (b) O-WSIC|+ (Niñ o3.4|+ removed), and (c) Niñ o3.4|+ (O-WSIC|+ removed) during 1979-2013. Hatched regions indicate significant values based on the (a, c) 95% and (b) 90% confidence level from a two-tailed Student’ s t-test. (d-f) As in (a-c) but for composite patterns. (g) Difference in patterns of surface temperature (color scale; units: ° C)/UV850 (vectors; units: m s-1) between the perturbed experiment forced by O-WSIC|+, which is obtained from the regression analysis in Fig. 3b, and the control experiment simulated by version 3 of the Community Atmosphere Model. |
| Table 2 Selected anomalous years based on the BK-ASIC|-, O-WSIC|+, and Niñ o3.4|+ indices. |
To assess the contribution of the O-WSIC|+ to the formation of the warm southern mode of TEA, we use version 3 of the National Center for Atmospheric Research Community Atmospheric Model (NCAR CAM3) (Collins et al., 2006) to perform two simple experiments, each with 20 members. The simulation configuration has a horizontal resolution of approximately 2.8° and 26 vertical levels extending up to 3.5 hPa. The control experiment is integrated with given climatological SST and sea ice distribution (1979-2010). In the perturbed experiment, the O-WSIC|+ in the domain (45-63° N, 135-160° E), as shown in Fig. 5g (color scale), is added to the mean sea ice over the Sea of Okhotsk, while all other external variables remain fixed. The spatial distributions of simulated surface air temperature anomalies (Fig. 5g, color scale) display qualitative similarities with their observed counterparts (Figs. 5b and 5e, color scale). The most important feature to note is the increased warm air transport from lower latitudes (Fig. 5g, vectors). Even though the simulated atmospheric anomalies are more northward in their position than their observed counterparts, the results shown in Fig. 5g imply that the O-WSIC|+ is partially responsible for the formation of the weak warming over southern East Asia.
This study reveals the relative impacts of ASIC and WSIC anomalies on the non-uniform variation of TEA using observed data over the past 35 years (1979-2013) on the interannual timescale. The major findings can be summarized as follows:
(1) Linear regression analysis indicates that BK- ASIC|- is significantly related to the cold northern mode of TEA(Fig. 3a). The BK-ASIC|- and T1000 PC1 are correlated at 0.58 (statistically significant at p < 0.05) (Fig. 2a). Further analysis (linear regression and composite) reveals that in correspondence with BK-WSIC|-, the EAWM system (the Siberian high, East Asian trough and East Asian jet stream) tends to be stronger (Fig. 4, left panel). Anomalous northerly winds dominate northern East Asia, bringing cold air from high latitudes, and consequently resulting in cooling over northern East Asia (Fig. 5, left panel).
(2) The warm southern mode of TEA can be attributed to O-WSIC|+ (Fig. 3b). The correlation coefficient between the O-WSIC|+ and T1000 PC2 is 0.33 (statistically significant at p < 0.1) (Fig. 2b). Corresponding to O-WSIC|+, the Aleutian low, East Asian trough, and East Asian jet stream appear more northward (Fig. 4, right panel). Anomalous northeasterly winds prevail north of 50° N and anomalous southerly winds control the southern coast of East Asia, facilitating warm air transport from the tropical oceans to southern East Asia, and contributing to the weak warming over southern East Asia (Fig. 5, middle panel). The potential contribution of the O-WSIC|+ to the formation of the warm southern mode of TEA was verified by experiments with CAM3.
Wang et al. (2010) suggested that the warm (cold) southern mode of TEAmay be attributable to El Niñ o (La Niñ a) events. In this study, we calculated the correlation coefficients among the Niñ o3.4|+, T1000 PC2, and O-WSIC|+ (Table 1). The Niñ o3.4|+ (orange line) is in phase with the T1000 PC2 (Fig. 2b), with a coefficient of 0.32 (statistically significant at p < 0.1), whereas the correlation coefficient between the Niñ o3.4|+ and O-WSIC|+ is insignificant. The regression and composite patterns of anomalous T1000/UV1000 associated with Niñ o3.4|+ (Fig. 5, right panel) reflect the structure of the southern mode (Fig. 1b) well in lower latitudes, thus indicating that the contribution of the Niñ o3.4|+ to the southern mode of TEAis restricted to the lower latitudes. It is worth noting that results derived from a single AGCM cannot fully capture the observed ocean-atmosphere coupling over tropical oceans (Fig. 5g). The relative contributions of either O-WSIC|+ or Niñ o3.4|+ should be determined with a coupled atmosphere-ocean model in future research.
| [1] |
|
| [2] |
|
| [3] |
|
| [4] |
|
| [5] |
|
| [6] |
|
| [7] |
|
| [8] |
|
| [9] |
|
| [10] |
|
| [11] |
|
| [12] |
|
| [13] |
|
| [14] |
|
| [15] |
|
| [16] |
|
| [17] |
|
| [18] |
|
| [19] |
|
| [20] |
|
| [21] |
|