
Changes in Local Growing Season Indices in Shanghai Due to Urbanization during 1873-2013
[XIA Jiang-Jiang, YAN Zhong-Wei, XIONG Zhe*  ]
]
]
|
|


The contribution of urbanization to the changes in growing season indices (e.g., the start date of the growing season, Ds) in Shanghai, eastern China, for the period 1873-2013 is assessed. The urban-related Ds advancement (referred to as the urbanization contribution, UC) is reconstructed based on the changing urban-land fraction within a grid box around Shanghai for 1873- 2013. After removing the UC from the raw Ds time series, the secular trend (ST) representing the long-term climatic warming and multidecadal variability (MDV) representing an oscillatory component with a period of several decades are obtained by using the Ensemble Empirical Mode Decomposition (EEMD) method. Results show that the UC is comparable with the contribution of the ST for the period 1873-2013, when Ds exhibits an advancing rate of about 0.44 days per decade. MDV plays an important role in regulating changes in Ds on the decadal timescale, e.g., with a contribution of about 56.1% for 1981-2013.
As important climatic indicators, growing season indices are useful for climatological and ecological applications (White et al., 1999; Robeson, 2002; Linderholm, 2006). In China, the thermal growing season, which is defined based on long-term meteorological observations (e.g., temperature records), has been extending for the last several decades, mainly due to an earlier onset of the growing season (Xu and Ren, 2004; Liu et al., 2010; Song et al., 2010; Yang et al., 2013). Christidis et al. (2007) suggested that, during that time, the lengthening of the growing season in Northern Hemisphere lands can be attributed to the anthropogenic forcings that have acted on the climate system. Xia et al. (2013) argued that the multidecadal variability (MDV) in the time series of growing season indices is associated with the Atlantic Multidecadal Oscillation (AMO). It accelerated the lengthening rate by about 53% during the period 1980-2009.
It is worth noting that, due to the rapid development during the last few decades, urbanization has induced biases in observed local temperature time series (Ren et al., 2007; Wang et al., 2012), especially in eastern China (Zhao et al., 2014). Yang et al. (2013) indicated that one tenth of the increase in growing season degree days in eastern China for the period 1961-2007 can be attributed to urbanization effects. However, the urbanization-induced changes in the growing season for the whole 20th century has not been well studied.
This paper aims to assess the contribution of urbanization to the changes in growing season indices (e.g., the start date of the growing season). In addition, in order to obtain a more comprehensive result, the relative contributions of MDV and long-term anthropogenic warming are also analyzed. Section 2 describes the data and methods used in this study. Section 3 presents the results obtained. Section 4 provides further discussion and summarizes the key conclusions.
The Shanghai daily surface air temperature series for the period 1873-2013 has been updated from the homogenized series developed by Yan et al. (2001) and Li and Yan (2009). Xia et al. (2015) suggested that the temperature of Shanghai is regionally (eastern China) representative. The local growing season (LGS) is defined using the local climatological annual mean temperature (Tm) as the temperature threshold (Christidis et al., 2007; Xia and Yan, 2014). Following this, Tm is defined as the average temperature over the period 1873-2013. For each year, the start date (Ds) of the LGS is the date when local temperature rises above Tm in the spring (in April).
The long-term AMO index series for 1901-2013 was obtained from http://www.esrl.noaa.gov/psd/data/timeseries/AMO/.
The changing urban-land fraction within a grid box around Shanghai ((30-33° N, 119-122° E); Fig. 1a) for 1873-2013, as used in the Coupled Model Intercomparison Project Phase 5 (CMIP5) historical climate experiments, was obtained from http://tntcat.iiasa.ac.at:8787/RcpDb/dsd?Action=htmlpage& page=welcome#.
The Ensemble Empirical Mode Decomposition (EEMD) method is used to decompose a complicated data series into a small number of amplitude-frequency-modulated oscillatory components of different timescales (Huang and Wu, 2008; Wu and Huang, 2009). The procedure of Wu et al. (2011) is adopted here to decompose the Ds series into three parts: a secular nonlinear trend (ST) representing the long-term climatic warming; MDV representing those oscillatory components with timescales of decades up to a century; and high-frequency variability (HFV) as a sum of the shorter-term components.
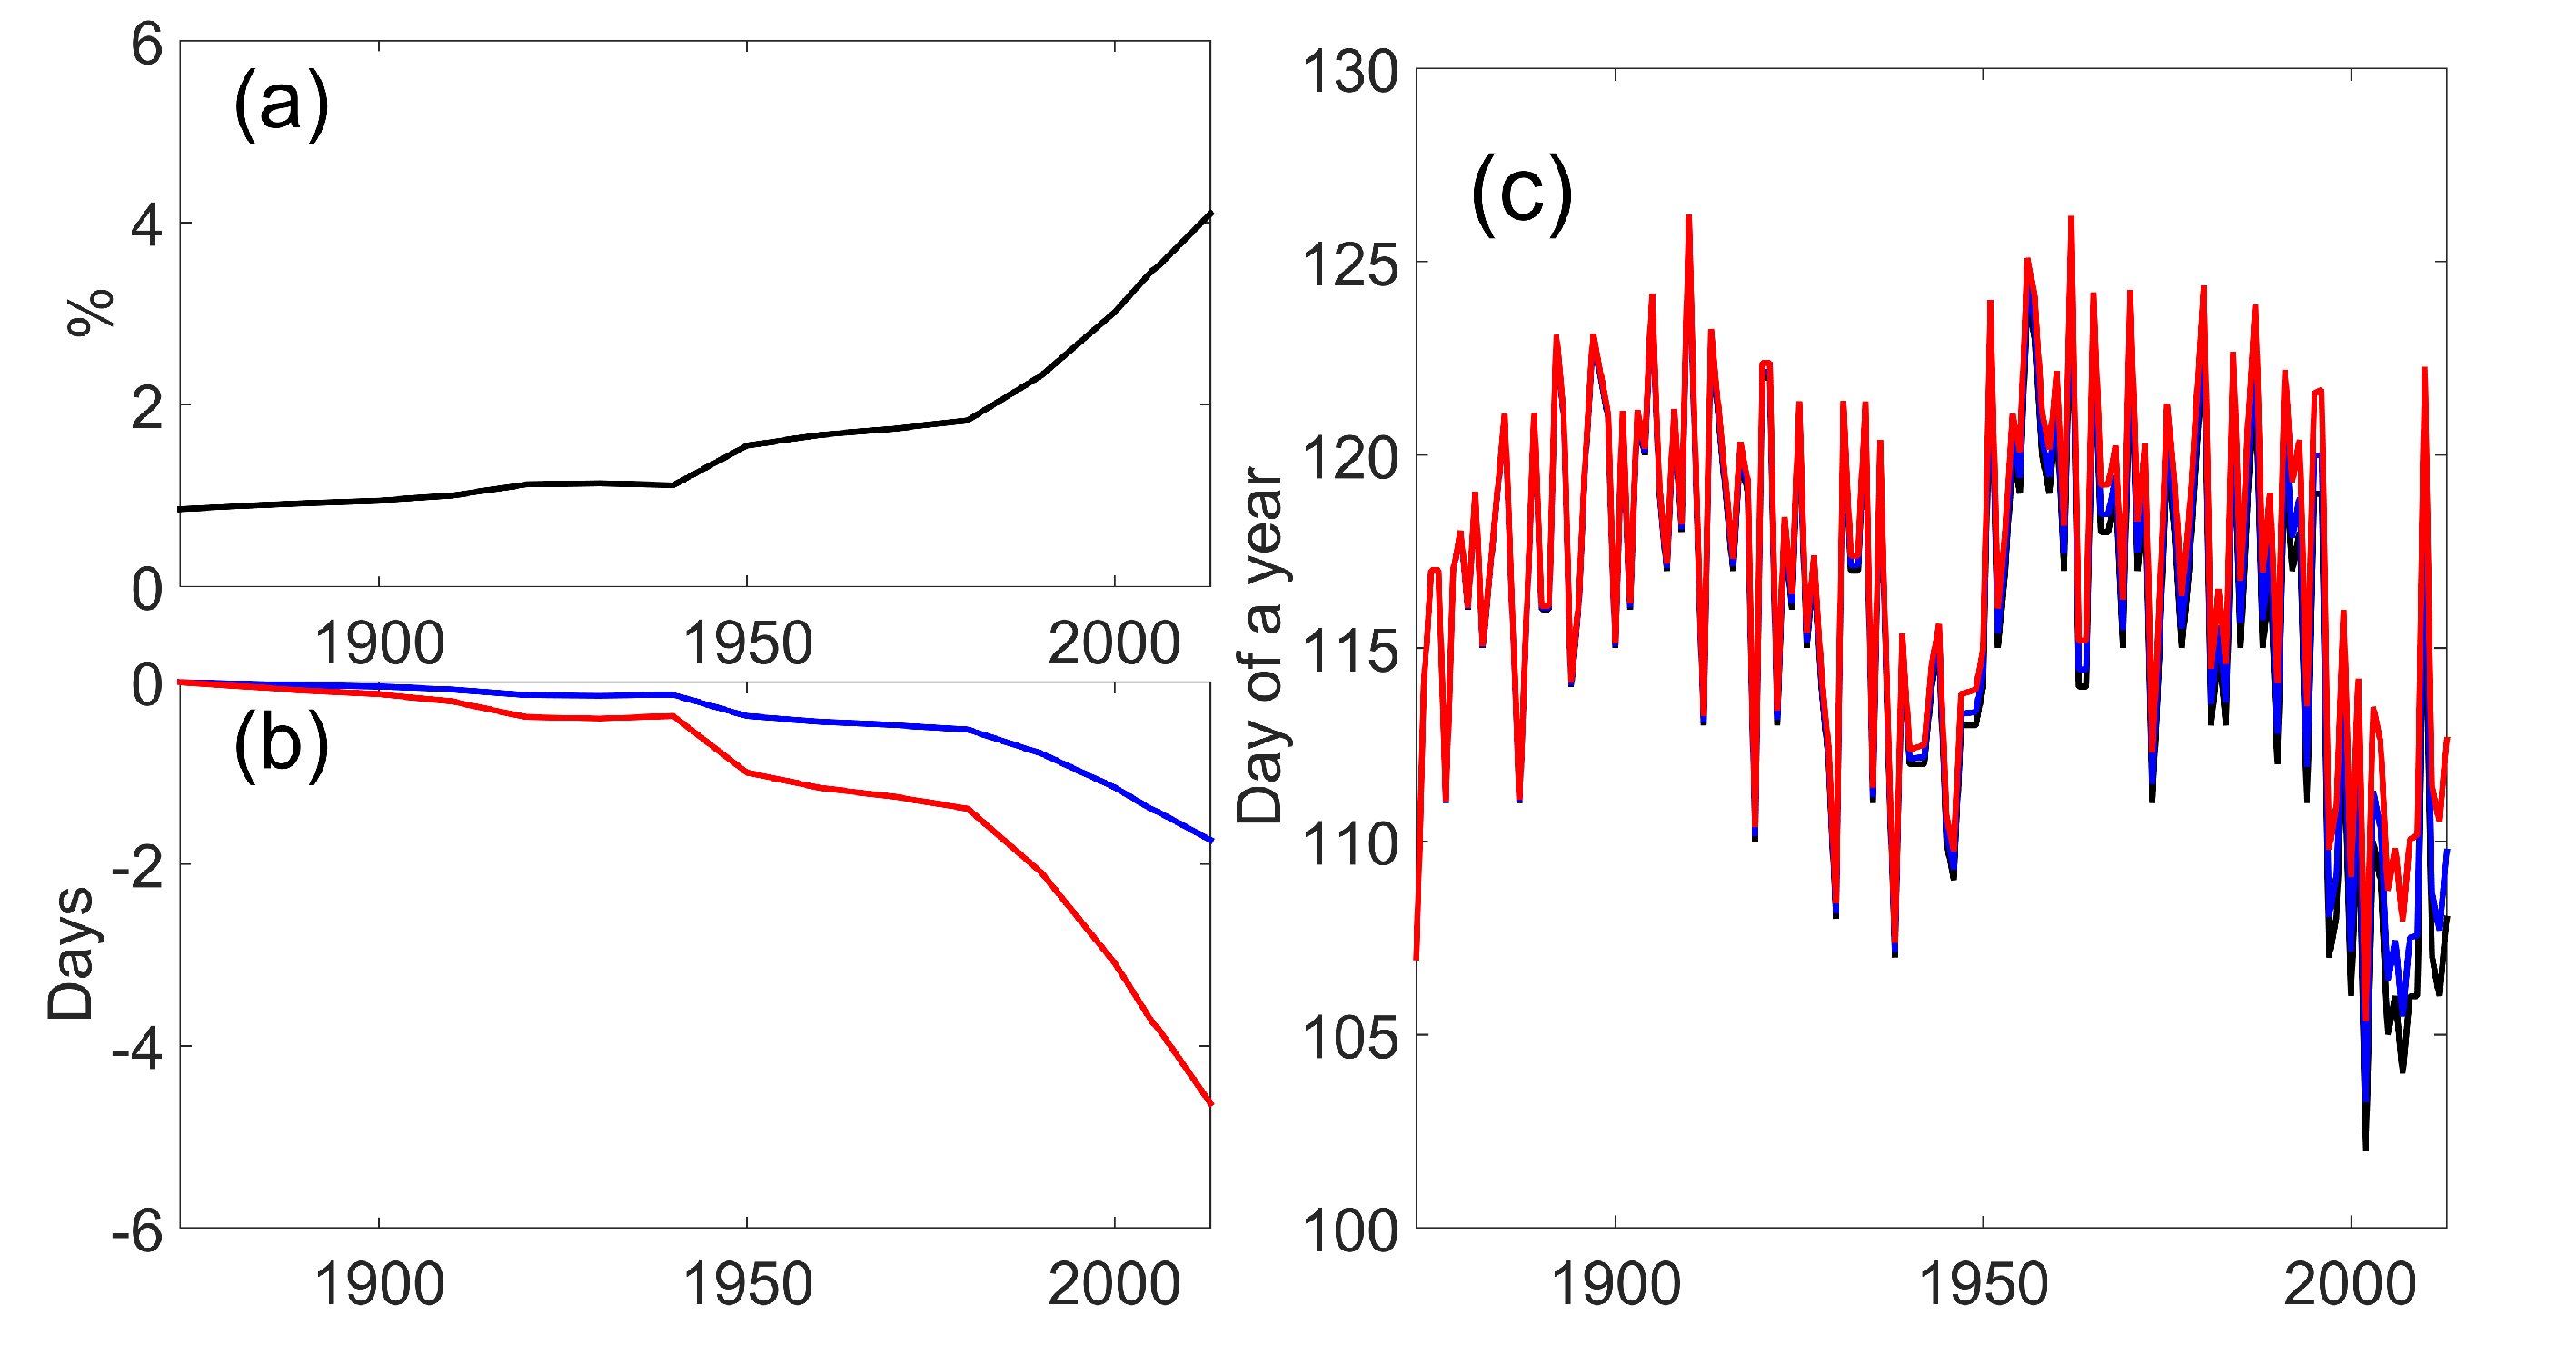 | Figure 1 (a) The fraction (percentage) of urban land in the area (30-33° N, 119-122° E) for the period 1873-2013, as used in the Coupled Model Intercomparison Project Phase 5 (CMIP5) experiments. (b) The reconstructed urban-related start date of the growing season (Ds) advancement range under the assumption of urbanization contribution (UC) being from 9% (UC09— blue line) to 24% (UC24— red line). Negative values indicate an advancement in Ds, with respect to 1873. (c) The original Ds series (black, almost overlapped) versus those with UC09 removed (defined as Ds_UC09, blue), and with UC24 removed (defined as Ds_UC24, red). |
Xia and Yan (2014) found that Ds has a good linear relationship with April temperature. They suggested that for a 1C warming of April temperature there should be an advancement of Ds by 5.2 days for Shanghai (Xia and Yan, 2014; Fig. 1a). Furthermore, there have been a wide range of estimates of the urbanization effect in China. Averaged over large areas, i.e., China, the urban contribution is about 10%, according to Jones et al. (2008). However, Yang et al. (2011) suggested that over metropolis-based stations (e.g., Shanghai) the urban contribution could be 44%. In fact, different methods may result in different estimates of the contribution of urbanization (Du et al., 2007; Jones et al., 2008; Yang et al., 2011; Wang et al., 2013). To facilitate discussion, we adopt the suggestion from a recent study by Zhao et al. (2014) that urbanization could have accounted for up to 9%~C24% of the local warming trend in eastern China during 1951~C2010
In this study, we take the changing urban-land fraction (Fig. 1a) as the proxy of urbanization progress. We assume a linear relationship between the urban-land fraction and its contribution to advancing Ds, which allows us to roughly reconstruct the urban-related advancement in Ds for Shanghai, as shown in Fig. 1b. As shown in this figure, the reconstructed urban effect for Ds in Shanghai was about nil in 1873 and about -1.7 days (UC09) to -4.6 days (UC24) in 2013. The urban signal is somehow overwhelmed in strong interannual fluctuations of Ds and only visible in Fig. 1c after the 1980s.
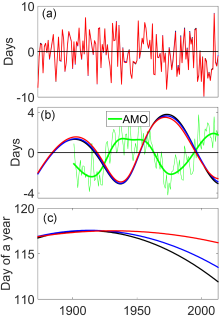
The three timescale components of the Ds/Ds_ UC09/Ds_UC24 series are obvious, via EEMD (Fig. 2). Removing the urban effect (UC09 or UC24) makes the ST slighter (Fig. 2c), but barely influences the HFV (Fig. 2a) and MDV (Fig. 2b) inherent in the time series. Note that the AMO is roughly out of phase with the MDV of Ds variations in eastern China (Fig. 2b). It has been pointed out in previous work that the AMO plays a key role in regulating temperature changes (including April temperature) within a time window of decades for regions like East Asia (Lu et al., 2006; Li et al., 2009; Xia et al., 2013; Gao et al., 2015). Physically, our previous study (Xia et al., 2013) showed that the MDV component of the Ds in many regions over the world (including Shanghai, eastern China) has strong links with the AMO. This was explained by analyzing differences in atmospheric circulation between the warm and cool phases of the AMO. Wu et al. (2011) suggested that the ST, the last EEMD component, could reflect the anthropogenic warming signal. Thus, in this study, there is confidence in the decomposition results using the EEMD method for the low frequency signal, for both MDV and ST.
Table 1 shows the linear trends of different timescale components of Ds over different temporal spans. For the period 1873-2013, linear trends of UC (UC09 and UC24) range from -0.10 to -0.26 days per decade, indicating a 22.7% to 59.1% UC to the raw Ds time series (-0.44 days per decade). For the periods 1901-2013, 1951-2013, and 1981-2013, the UC to the total advancement of Ds is 16.9%-46.5%, 9.4%-25%, and 9.7%-25.9%, respectively. Based on the results in Table 1, we can also calculate the contributions of ST to the raw Ds time series, which are about 11.4%-54.6%, 14.1%-50.7%, 8.9%-25%, and 6.7%-17.7% for the periods 1873-2013, 1901-2013, 1951-2013, and 1981-2013, respectively. It is clear that the UC and ST is comparable for different periods and that ST and UC together play a key role in advancing the Ds of the growing season on the century time scale. In comparison, MDV has a slightly negative contribution on the century time scale, i.e., for 1873-2013 and 1901- 2013. However, it plays an important role in regulating changes in Ds on the decadal time scale, e.g., with a contribution of about 56.1% for 1981-2013.
 | Figure 2 Different timescale components in the Ds series for 1873-2013: (a) the high-frequency variability (HFV), mainly involving strong interannual fluctuations; (b) the multidecadal variability (MDV), which is nearly out of phase with the Atlantic Multidecadal Oscillation (AMO) (for 1901-2013); (c) the secular trend (ST), the different results after removing UC09 and UC24 are significant (black, original series; blue, after removing UC09; red, after removing UC24). |
| Table 1 Linear trends of the raw time series, the urbanization contribution (UC), the high-frequency variability (HFV), the multidecadal variability (MDV), and the secular trend (ST) of the start date of the growing season (Ds) over different temporal spans. Values in square brackets indicate the linear trends with the UC being 9% and 24% for the period 1951-2010. Units: days per decade. |
The present results highlight the specific need of regional attribution studies of changing climate extremes. In particular, for a region such as eastern China, regional development decision-makers are interested in how much a regional process such as urbanization, which local decision-makers can control, could enhance the risk of climate extremes in the region. However, the pattern of the effect of urbanization is compounded with that of greenhouse gas-associated global anthropogenic forcing. Therefore, the effect of local urbanization should be carefully considered in attribution studies of large-scale climate change. This paper has revealed the relative contributions of urbanization, MDV, and anthropogenic warming to the changes in Ds as recorded at Shanghai station. For the period 1873-2013, Ds exhibited an advancing rate of about 0.44 days per decade, mainly due to ST and UC. MDV plays an important role in regulating changes in Ds on the decadal scale.
| [1] |
|
| [2] |
|
| [3] |
|
| [4] |
|
| [5] |
|
| [6] |
|
| [7] |
|
| [8] |
|
| [9] |
|
| [10] |
|
| [11] |
|
| [12] |
|
| [13] |
|
| [14] |
|
| [15] |
|
| [16] |
|
| [17] |
|
| [18] |
|
| [19] |
|
| [20] |
|
| [21] |
|
| [22] |
|
| [23] |
|
| [24] |
|
| [25] |
|
| [26] |
|