
Asymmetry in the Arctic Oscillation Teleconnection with January Cold Extremes in Northeast China
[HE Sheng-Ping1, 2  ]
]
]
|
|


The connection of the Arctic Oscillation (AO) with the frequency of temperature extremes over East Asia during boreal winter has been documented by many studies. This study describes an asymmetry in the relationship between the January AO and the simultaneous cold extremes in Northeast China (NEC), and further reveals a breakdown of this relationship. It is demonstrated that the frequency of January cold extremes in NEC shows significant (insignificant) negative correlation with the simultaneous negative (positive) phase of the AO. One possible explanation for such an asymmetry is that the Arctic center of negative AO extends more southwards to Siberia compared with that of positive AO, conducive to a closer connection with the frequency of an extreme Siberian high. As a result, the frequency of January cold extremes in NEC shows a more significant relationship with the negative AO. The other related explanation is that, concurrent with the negative phase of the AO, there is an evident meridional stationary planetary wave in the upper troposphere around (30°N, 100-300 hPa), which disappears in the positive AO. Therefore, the negative AO could better reflect the fluctuation of the subtropical westerly wind and the synoptic-scale transient wave activity, which is closely related to the frequency of cold extremes in NEC. Along with a positive polarity of the AO trend since the mid-1980s, the connection between the cold extremes over NEC and the AO during January has been weakened.
Most previous studies on long-term global climate change focus mainly on the mean state change. As heavy rain, snowstorms, and heat waves become more and more frequent in the context of global warming, scientists have realized that understanding the occurrence of climate extremes is very important for human adaptation. For example, temperature extremes, which occur mostly in summer and winter, could cause tremendous impacts on both human society and the natural environment, and therefore draw more and more attention worldwide (Easterling et al., 2000; Meehl et al., 2000). Temperature extremes can be divided into two categories: cold and warm temperature extremes. Associated with global warming, the latter half of the 20th century saw a distinct widespread change in temperature extremes. It has been found that a significant decrease in the annual occurrence of cold nights and a significant increase in the annual occurrence of warm nights occurred over almost 70% of the global land area during 1951-2003 (Alexander et al., 2006). In addition to the global scale, most previous studies have focused on changes in climate extremes on regional scales, because daily data in digital form are not readily available to the international research community for large parts of the world (Griggs and Noguer, 2002). Located in a typical monsoon climatic region, the East Asian continent is much colder in boreal winter than many other regions at similar latitudes. Consequently, extreme temperature is one of the most dominant climate features in this region during boreal winter (You et al., 2013; Chen et al., 2013a).
The Arctic Oscillation (AO), which is one of the most dominant patterns in the mid- and high latitudes in boreal winter (Thompson and Wallace, 1998), shows significant correlation with winter temperature anomalies in China (e.g., Yang and Li, 2008; Yang, 2011; He, 2013; Li et al., 2014). The AO could also significantly influence cold surges over East Asia by impacting the mid- and high latitude atmospheric circulation systems, including the Siberian high, East Asian trough, and East Asian jet stream (Park et al., 2011; He and Wang, 2013). However, associated with the different phases of the AO, the outbreak mechanisms and properties of cold surges, as well as the frequencies of occurrence, are different (Park et al., 2011). Motivated by Park et al. (2011), we surmised that the different phases of the AO might show different relationships with temperature extremes over Northeast China (NEC).
The datasets used in this study include: (1) 0.5° × 0.5° daily maximum (Tmax) and minimum (Tmin) temperature datasets for the period 1962-2010, based on interpolation from 2400 observation stations in China (Wu and Gao, 2013); (2) monthly and daily mean large-scale atmospheric datasets from the National Centers for Environmental Prediction/National Center for Atmospheric Research (Kalnay et al., 1996); (3) monthly mean AO index, obtained from the Climate Prediction Center. When a daily Tmax/Tmin is lower (higher) than the 10th (90th) percentile value, it is classified as a cold (warm) day/night. All datasets have been detrended before analysis. In the present study, we focus mainly on the month of January during the period 1962-2010.
To provide some background information on the characteristics of the January temperature extremes associated with the simultaneous AO, we first examined the correlation of January AO index (AOI-Jan) with the simultaneous cold days, warm days, cold nights, and warm nights during 1962-2010 over NEC (figures not shown). It was revealed that significant negative/positive correlation coefficients (CCs) exist between the AO and the cold extremes (i.e., cold nights and cold days)/warm extremes (i.e., warm days and warm nights), suggesting that the cold/warm extremes would be less/more frequent in January over NEC when the January AO is in its positive phase, and vice versa. Nevertheless, the magnitude of the CCs related to the warm extremes is relatively smaller than that of cold extremes.
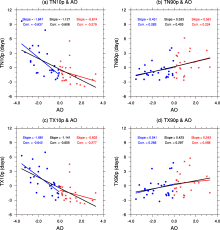
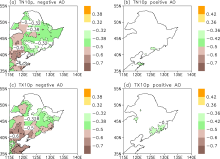
The AO can be divided into two distinct phases: positive and negative phases. Figure 1 depicts the relationship of January temperature extremes over NEC with each AO phase through linear fits using samples with positive and negative values of the AOI-Jan during 1962-2010. The frequency of cold extremes in NEC and the AO index show significant negative correlations during negative AO conditions. This means that the frequency of cold extremes in NEC increases dramatically as the amplitudes of negative AO decrease, with an increase of approximately 1.85 (1.68) days of cold nights (days) corresponding to a one standard deviation decrease in AO intensity (Figs. 1a and 1c; indicated by the negative slope). Yet, such a connection is not evident during positive AO phases. Even though the frequency of cold extremes tends to decrease, the linear influence is relatively weaker (correlation of -0.279/-0.277 for cold nights/days), indicating a distinct asymmetry in the AO-cold extremes relationship. On the other hand, asymmetry also exists in the AO-warm extremes relationship (Figs. 1b and 1d); however, it is not as evident as in the AO-cold extremes relationship. Therefore, the following analysis will mainly focus on the cold extremes. A similar analysis was conducted by regressing January cold extremes onto the simultaneous AO index (Fig. 2). It was revealed that significant negative CCs occupy the NEC during negative AO phases (Figs. 2a and 2c), while there are almost no statistically significant CCs during positive AO phase (Figs. 2b and 2d).
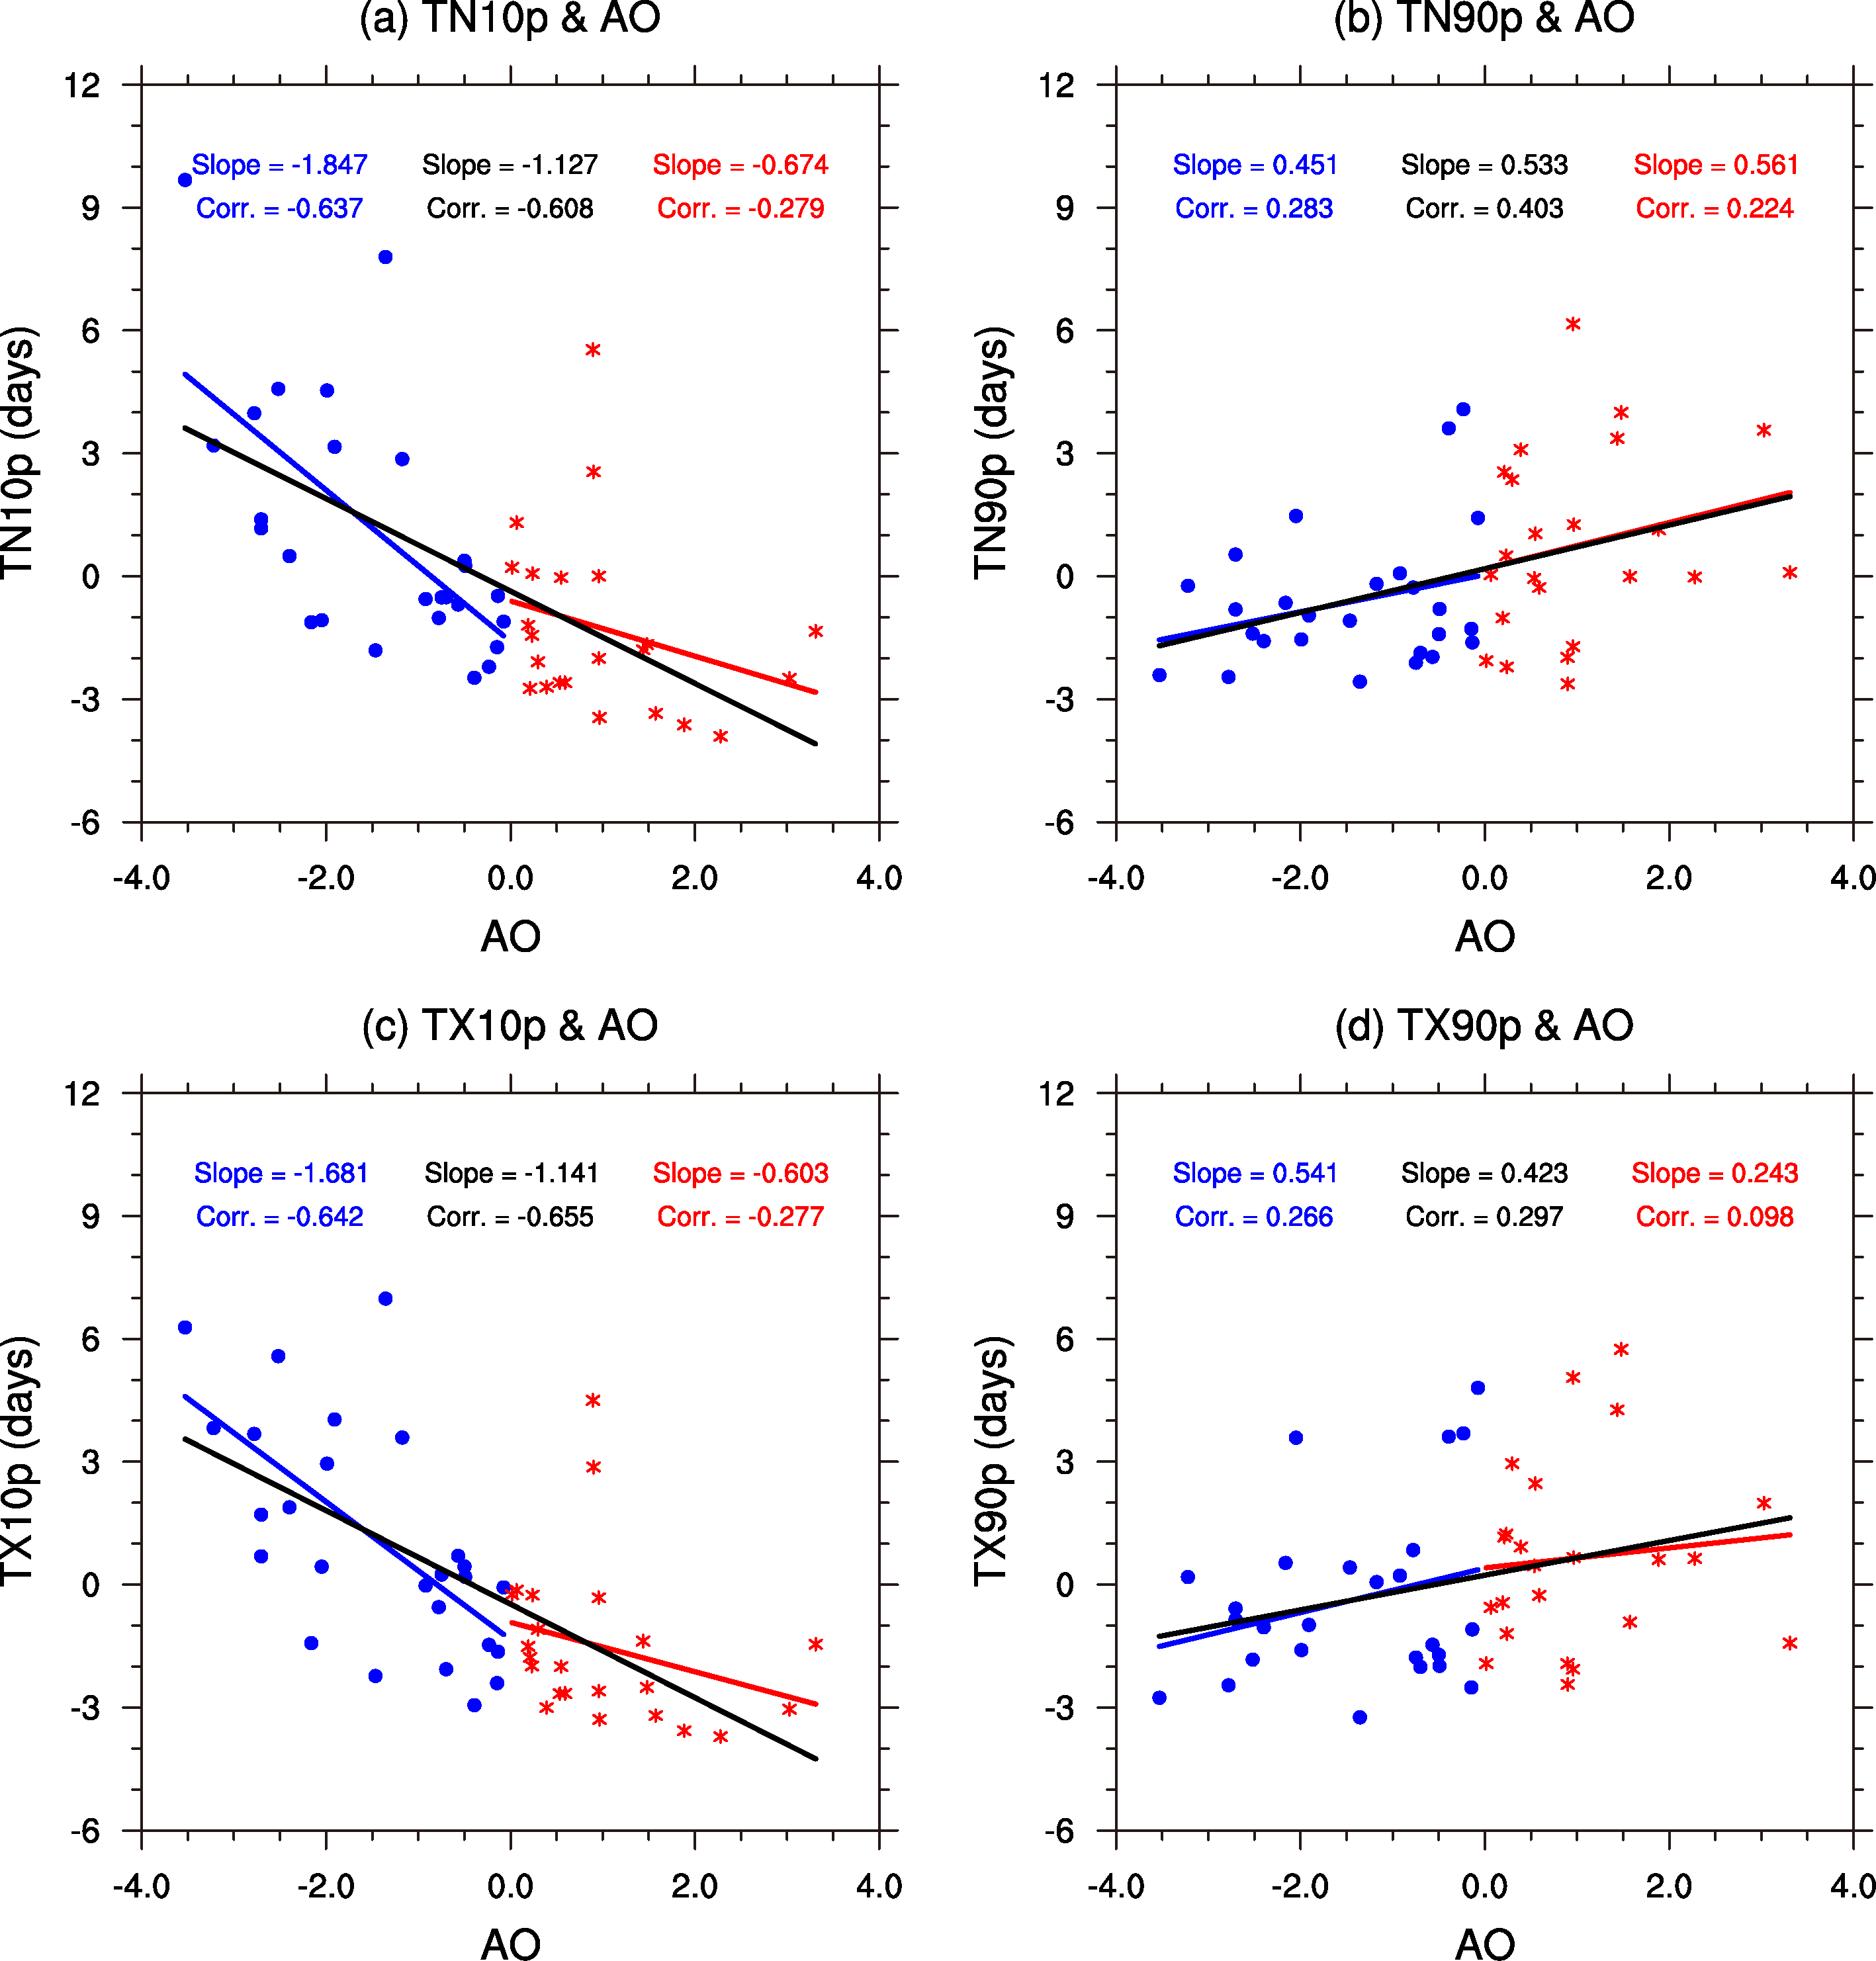 | Figure 1 Scatter plot of the January Arctic Oscillation (AO) index vs (a) cold nights (TN10p), (b) warm nights (TN90p), (c) cold days (TX10p), and (d) warm days (TX90p) anomalies in NEC during 1962-2010 (January), with slopes and correlations. |
But why does the AO show such an asymmetric relationship with the cold extremes? Previous studies have revealed that the AO could influence the East Asian winter temperature/monsoon through its impact on the Siberian high (Gong et al., 2001; Wu and Wang, 2002), or via the air-sea interaction over the North Pacific (He and Wang, 2013). Thus, the way that the negative AO exerts its impact might differ from that of the positive AO. To address this issue, the regression of January mean sea level pressure (SLP) with respect to the simultaneous AOI-Jan, using samples in negative (positive) AO phases, was examined (figures not shown). It was revealed that the negative AO-related SLP anomalies over the Arctic region extend more southward to Siberia compared with those related to the positive AO, indicating a more significant relationship between the negative AO and the Siberian high. Additionally, the daily atmospheric circulation in January also shows a clear asymmetrical connection with the simultaneous AO. As shown by Figs. 3a and 3b, the anomalies of the frequency of extreme high pressure in January over the Siberian high region ((40-60° N, 80-125° E); indicated by the rectangle) are statistically insignificant/significant concurrent with positive/negative AO (Figs. 3a/3b), which is consistent with the results derived from the monthly mean datasets (figures not shown). This means that an extreme Siberian high would be generally more frequent during negative AO, but not necessarily less frequent during positive AO. Further support comes from the asymmetric CCs of the area-averaged extreme high frequency in the domain (40-60° N, 80-125° E) with the simultaneous AO, with CCs of -0.51/ -0.10 during negative/positive AO (Fig. 3c).
On the other hand, the mean-state temperature over the East Asian region seems to be closely related to the westerly jet stream. Besides, a strong westerly jet could provide a good channel for the propagation of the synoptic-scale transient wave, which is a possible major cause for winter temperature extremes over China (Chen et al., 2013b). Given that the divergence of Eliassen-Palm (EP) flux vectors produces the acceleration of zonal flow, and the AO could significantly modulate the variability of stationary planetary waves (e.g., Hartmann et al., 2000), an asymmetry might also exist in the propagation of the stationary planetary waves related to the positive and negative AO.
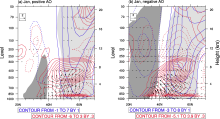
Figure 4 illustrates the regression of January zonally averaged zonal wind (blue contours), EP flux cross sections (vectors), and its divergence (red contours) onto the simultaneous AO index, using samples in negative (positive) AO phases. Significant anomalous upward/downward propagating planetary waves in the troposphere at midlatitudes are observed in positive/negative AO phases(Fig. 4a/4b; vectors). This feature is consistent with that revealed by Hartmann et al. (2000). The diversity is mainly located in the upper troposphere. As illustrated by Fig. 4b, corresponding to a negative AO (note the sign reversal in comparison), there would be anomalous poleward-pointing EP flux. According to the definition of EP flux, a poleward-pointing EP flux vector corresponds to equatorward meridional eddy momentum flux (Hartmann et al., 2000). Correspondingly, the anomalous equatorward momentum fluxes associated with negative-phase AO help to sustain a stronger subtropical jet stream. Meanwhile, there would be EP flux divergence anomalies in the upper troposphere around (30° N, 100-300 hPa) (Fig. 4b; red contours) during negative AO phases. According to the assumptions of quasi-geostrophic theory and linear perturbations, the zonal-mean zonal flow is accelerated where there is divergence of the EP flux. Consequently, the subtropical westerly jet flow located in the troposphere around 30° N would be intensified (Fig. 4b; blue contours), which might promote the propagation of a synoptic-scale wave over NEC. The anomalous propagation of the synoptic-scale transient wave regressed to the simultaneous AOI-Jan, using samples in negative (positive) AO phases, was further examined (figure not shown). As might be expected, the propagation of the synoptic-scale transient wave shows more significant correlation with the negative AO. In such a context, the frequency of cold extremes in NEC increases with negative AO magnitude (Chen et al., 2013b). However, the stationary planetary waves in the upper troposphere around (30° N, 100-300 hPa), and the subtropical westerly jet, show few anomalies during positive AO phases (Fig. 4a). The above analysis can be considered reasonable because Park et al. (2011) documented that the cold surges during negative AO are modulated by the southward expansion of the Siberian high, and characterized by longer-lasting cold advection.
 | Figure 2 Correlation maps of January negative AO index with simultaneous (a) cold nights (TN10p) and (c) cold days (TX10p). (b, d) As in (a, c), respectively, but for January positive AO index. Shaded values are statistically significant at the 0.05 level, based on a two-tailed Student’ s t-test. |
 | Figure 3 Regression maps of the frequency (units: d) of January extreme high (higher than the 80th percentile value) SLP with respect to simultaneous (a) positive and (b) negative AO index. Hatching indicates values that are statistically significant at 0.1 level. (c) Scatter plot of the January AO index vs the simultaneous frequency (units: d) of extreme high SLP area-averaged in the domain (40-60° N, 80-125° E), with slopes and correlations. |
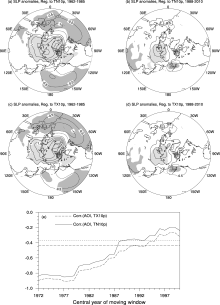
The above analysis has revealed that the frequency of January cold extremes in NEC is mainly connected with the simultaneous negative AO, rather than the positive AO. Given that the AO has tended to feature positive polarity since the mid-1980s (Thompson and Wallace, 2000; He, 2013), the connection between the cold extremes over NEC and AO during January might be weakened. To document this issue, Fig. 5e displays the sliding correlation, with a moving window of 21 years, between the AO index and cold days (nights) area-averaged in NEC during 1962-2010 for the month of January. As expected, significant negative correlation could be found between the AO and cold extremes before the late 1980s, which is followed by a dramatic weakening of the relationship around 1987. Figures 5a-d further display the regression of January SLP on the simultaneous cold extremes area-averaged in NEC during 1962-85 and 1988-2010, respectively. During 1962-85 January, corresponding to the high frequency of cold extremes in NEC, the SLP anomalies (Figs. 5a and 5c) closely resemble the typical negative phase of the AO pattern (Thompson and Wallace, 1998). By contrast, for the period 1988-2010, the positive and negative SLP anomalies are mainly located in north Siberia and the Bering Sea, respectively (Figs. 5b and 5d), and no longer display the AO pattern, indicating a breakdown of the AO-cold extremes relationship.
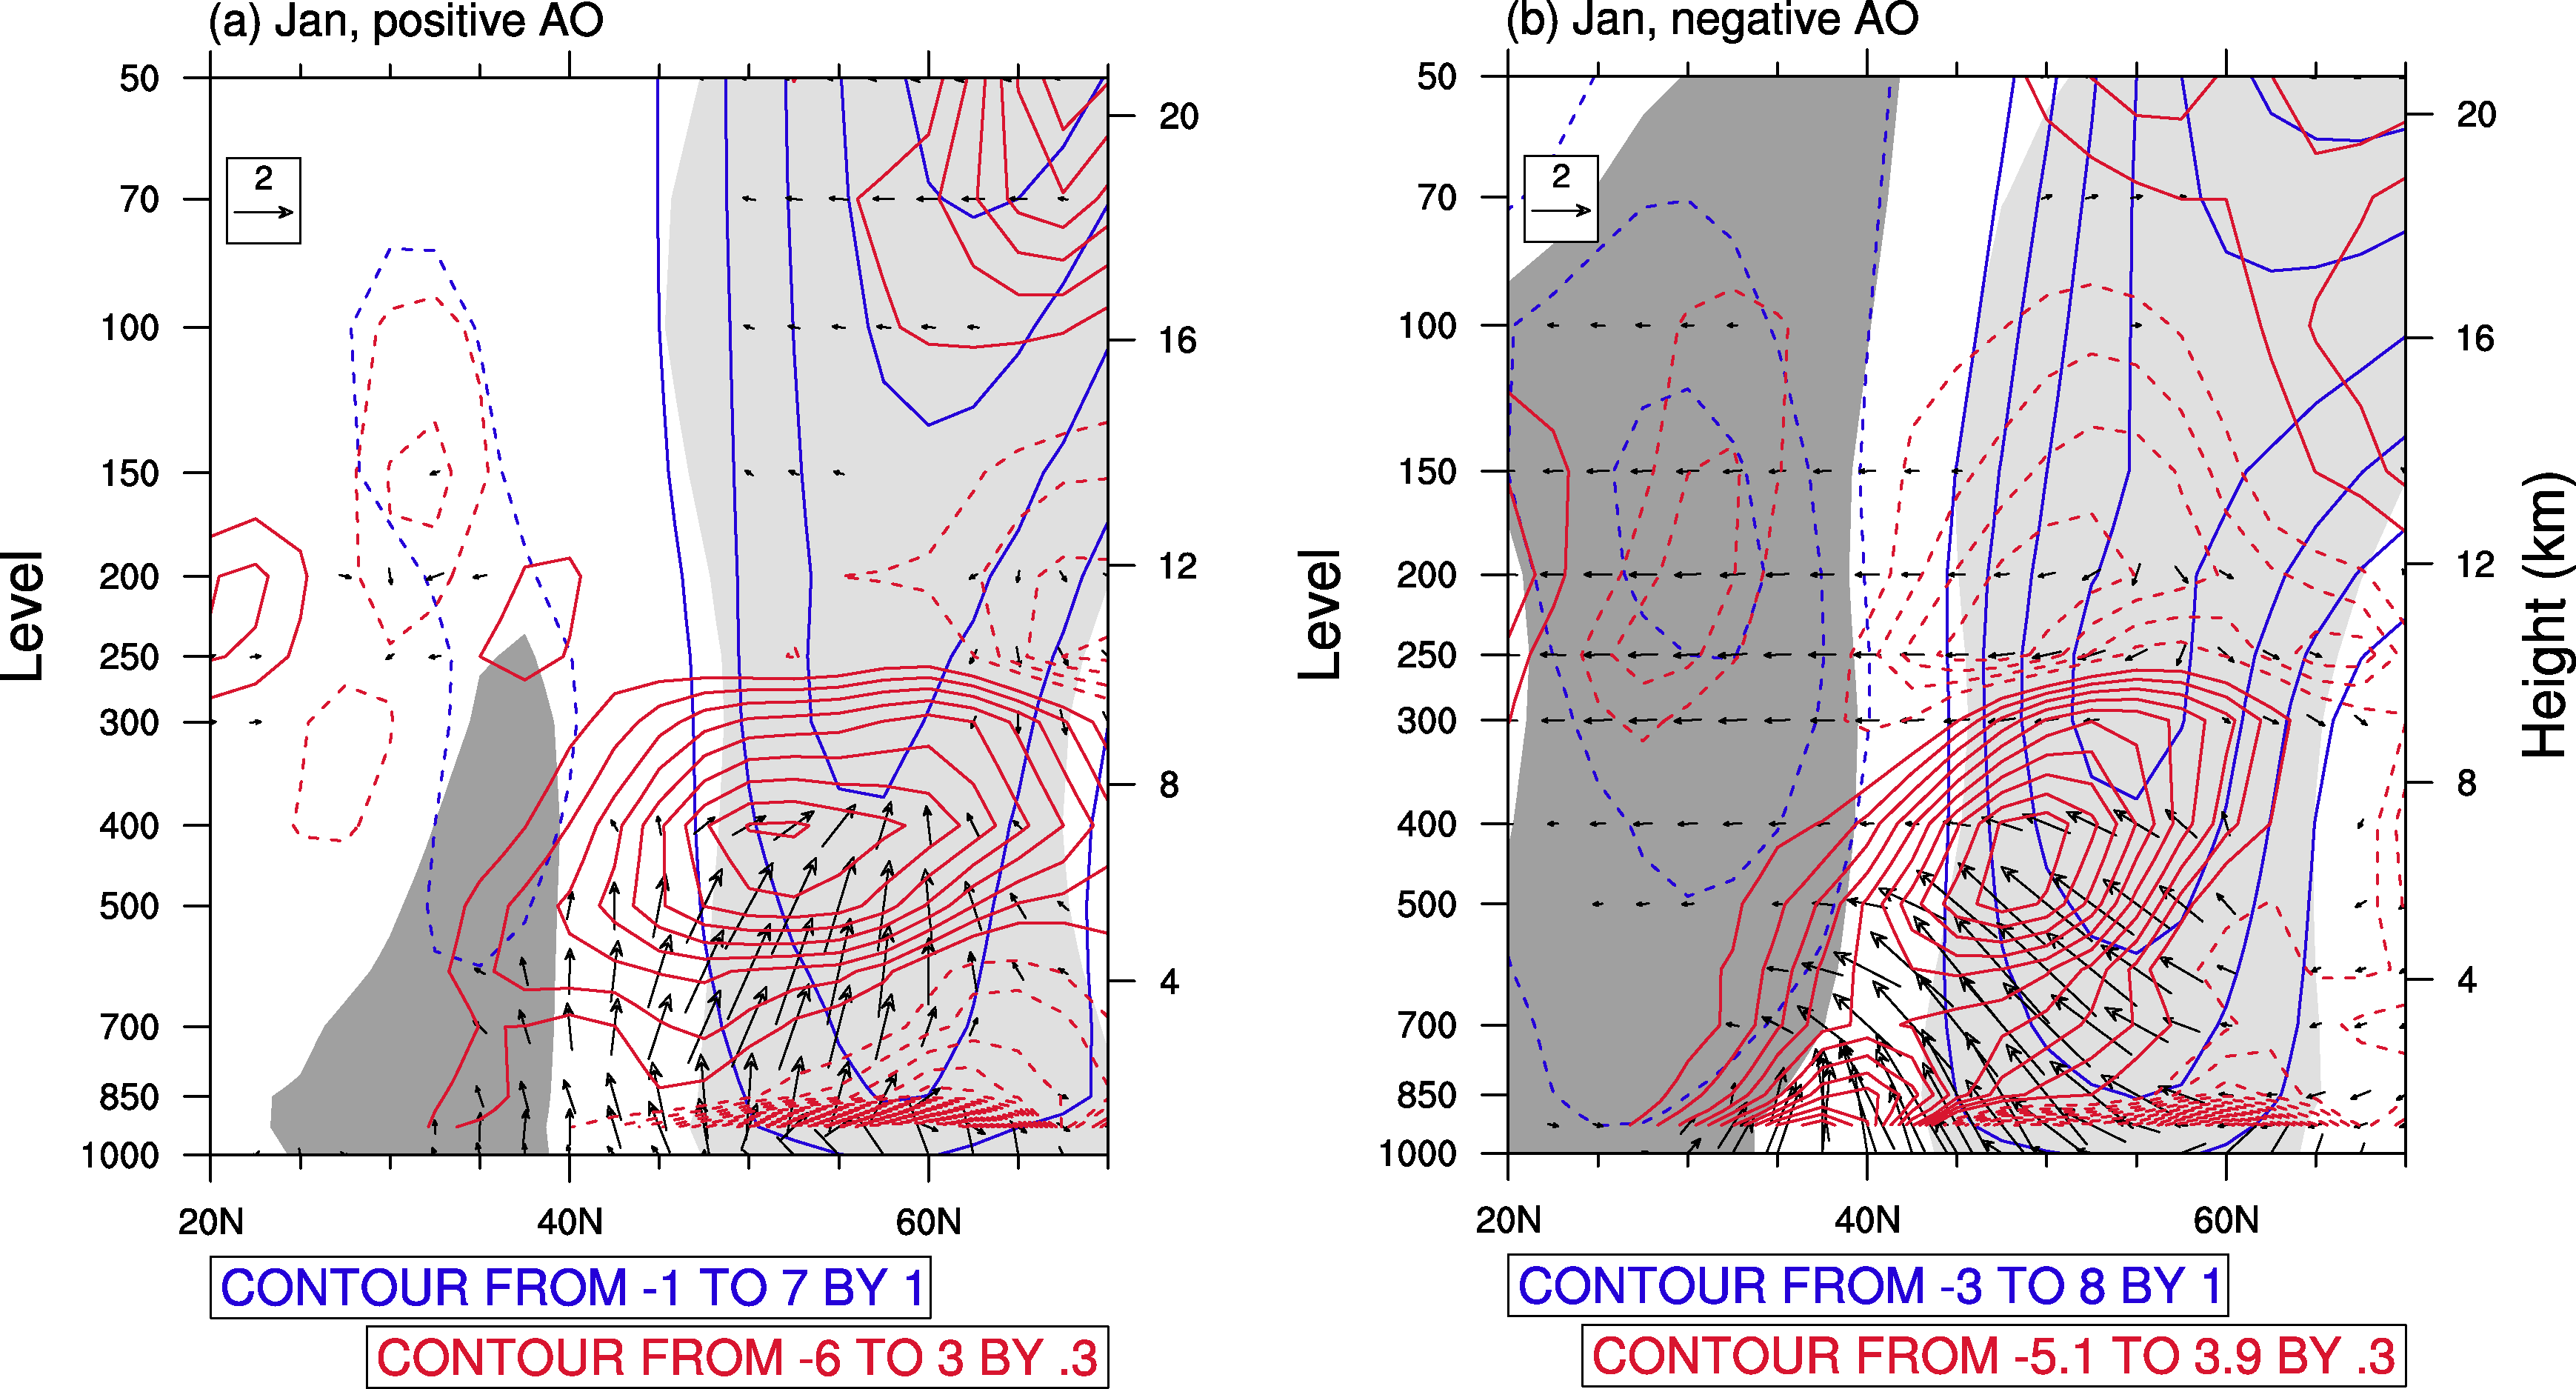 | Figure 4 Regression of January zonally averaged zonal wind (blue contours; interval: 1 m s-1), Eliassen-Palm (EP) flux cross sections (vectors; units: m2 s-2), and its divergence (red contours; units: m s-1 d-1) with regard to simultaneous January (a) positive and (b) negative AO index during 1962-2010. Shaded regions indicate the zonal wind anomalies that are statistically significant at 0.05 level. |
 | Figure 5 Regression maps of January SLP (units: hPa) anomalies with respect to the simultaneous (a/b) cold nights and (c/d) cold days area-averaged in NEC for 1962-1985/1988-2010, respectively. The SLP enclosed within the shaded regions is statistically significant at 0.1 level. (e) 21-year sliding correlation between the January AO index and cold nights (TN10p; solid line) and cold days (TX10p; dashed line) area-averaged in NEC. The horizontal short and long dashed lines indicate the 90% and 95% confidence level, respectively. |
Many previous studies have revealed that the AO could impact the frequency of temperature extremes over East Asia during boreal winter. The present study describes an asymmetry in the relationship between the January AO and the simultaneous cold extremes in NEC. That is, the frequency of January cold extremes in NEC shows significant (insignificant) negative correlation with the simultaneous negative (positive) phase of the AO (Figs. 1 and 2). The asymmetry means that, even though the January experiences equal occurrences of positive and negative phases of the AO, it might also see an increase of cold extremes in NEC, because the increase in the frequency of cold extremes during negative AO more than offsets the reduction during positive AO phases.
Two possible explanations have been revealed. One is that the spatial structure of the negative phase of the AO is somewhat different from that of the positive phase. Compared with the positive AO, the Arctic center of the negative AO extends more southwards to Siberia, resulting in a stronger connection with the occurrence of an extreme Siberian high (Figs. 3a and 3b). As a result, the frequency of January cold extremes in NEC shows a more significant relationship with the negative AO than the positive AO. This explanation is further supported by the obvious asymmetry in the AO connection with the frequency of an extreme high averaged in the domain (40-60° N, 80-125° E) (Fig. 3c). The other related explanation is that the propagation of a planetary stationary wave associated with the negative AO is also different from that of the positive AO (Fig. 4). An evident meridional stationary planetary wave in the upper troposphere around (30° N, 100-300 hPa) was observed during negative AO, which disappeared during positive AO. As the meridional stationary planetary wave corresponds to eddy momentum flux (Hartmann et al., 2000), the negative AO shows a more significant relationship than the positive AO with the subtropical westerly wind. This might also favor the asymmetry in the relationship between the January AO and simultaneous cold extremes in NEC. Along with the positive polarity of the AO trend since the mid-1980s, the connection between the cold extremes over NEC and the AO during January has been weakened (Fig. 5).
| [1] |
|
| [2] |
|
| [3] |
|
| [4] |
|
| [5] |
|
| [6] |
|
| [7] |
|
| [8] |
|
| [9] |
|
| [10] |
|
| [11] |
|
| [12] |
|
| [13] |
|
| [14] |
|
| [15] |
|
| [16] |
|
| [17] |
|
| [18] |
|
| [19] |
|
| [20] |
|