

The Spatial and Temporal Variability of Tropospheric NO2 during 2005-14 over China Observed by the OMI
[WANG Ting1  , WANG Pu-Cai
1 , François HENDRICK2 , YU Huan2 , Michel VAN ROOZENDAEL2 ]
, WANG Pu-Cai|
|


As improved and accumulated satellite records become available, it is significant to provide up-to-date perspectives on the spatiotemporal signatures of tropospheric nitrogen dioxide (NO2) over China, the knowledge of which is helpful for air pollution control. In this study, the Ozone Monitoring Instrument NO2 dataset for the last 10 years (2005-14) was retrieved to examine multiple aspects of NO2 columns, including distributions, trends, and seasonal cycle. The pattern of average NO2 suggests five hotspots with column density higher than 20 × 1015 molec cm-2: Jing-Jin-Tang; combined southern Hebei and northern Henan; Jinan; the Yangtze River Delta; and the Pearl River Delta. Furthermore, substantial and widespread NO2 growths are distributed over the North China Plain. By contrast, downward trends in NO2 amounts prevail in the megacities of Beijing, Shanghai, and Guangzhou, despite generally high loading levels. Except for the Pearl River Delta, there appears to be temporally consistent behaviors across all regions considered, where NO2 had an abrupt decline during 2008 to 2009, then a drastic increase up to 2013, before beginning to reduce again after 2013. However, the NO2 over the Pearl River Delta is not coevolving with the rest, having experienced a moderate rise from 2005 to 2007, followed by a reduction thereafter. A marked seasonality is apparent, with a maximum in winter and a minimum in summer, regardless of the region. The annual amplitude of NO2 is less pronounced over the Pearl River Delta, whereas the largest range is observed over the combined Southern Hebei and Northern Henan region, induced by enhanced NO2 emission in wintertime due to intense domestic heating.
Nitrogen dioxide (NO2) is a toxic gas with yellow-brown color and suffocating odor, which can damage the human respiratory tract, worsen asthma, and reduce lung function (Gauderman et al., 2000). As a highly reactive gas, NO2 serves as a critical precursor to the formation of acidic precipitation and tropospheric ozone. Furthermore, NO2 may directly or indirectly affect radiative forcing in Earth’ s environment (Ma et al., 2013). NO2 in the atmosphere comes from a variety of processes including fossil fuel combustion, soil release, biomass burning, and lightning. Among these, anthropogenic sources such as vehicles, power plants, and industry, dominate (Beirle et al., 2003). China, the world’ s largest developing country, along with the fastest growing economy, has produced a dramatic increase in NO2 emissions that exerts considerable stress on the environment and ecosystems (van der A et al., 2006). This is especially the case in eastern China (Beirle et al., 2003; Richter et al., 2005), which has attracted great concern from both the Chinese government and the academic sector.
To avoid and mitigate the adverse consequences induced by accumulated NO2 over China, above all, continuous and accurate monitoring of NO2 is essential. Compared to ground networks, satellite observation is characterized by wide coverage, real-time, high-resolution, and continuous data acquisition. Since 1960, when US Television and InfraRed Observation Satellite-1 (TIROS-1) was successfully launched, meteorological satellites, as an important branch of the Earth observation system, have developed very rapidly (Yu et al., 2010). There have been a number of milestones in NO2 retrieval from space-based sensors; in particular, the Global Ozone Monitoring Experiment-2 (GOME-2), Scanning Imaging Absorption Spectrometer for Atmospheric Chartography (SCIAMACHY), and the Ozone Monitoring Instrument (OMI). Various attempts have been dedicated to validate, improve, and analyze satellite-based NO2 estimation. For example, Boersma et al. (2007) reported a detailed procedure of how to achieve near-real time retrieval of tropospheric NO2 from OMI. Recent studies show that satellite NO2 data are suitable for improving emissions inventories and air quality studies (Richter et al., 2005; Yu et al., 2010; Zhang et al., 2007). In addition, OMI observations have been proven to be consistent with ground- based Multi-Axis Differential Optical Absorption Spectroscopy (MAX-DOAS) outcomes, which means the quality of OMI NO2 is relatively good in China (Ma et al., 2013; Theys et al., 2015). Based on GOME and SCIAMACHY data, the trend and seasonal variation of tropospheric NO2 over China have been explored by several scholars (Richter et al., 2005; van der A et al., 2006; Zhang et al., 2007). In particular, Yu et al. (2010) investigated the characteristics of NO2 over Beijing from OMI measurements during the Beijing 2008 Olympic Games. However, the characteristics of NO2 over China reported in previous studies are mainly inferred for the pre-2009 period. As continuous records derived from space sensors lengthen, starting from April 2005 when ERS-2 was launched, it is of vital interest and importance to revisit and update our knowledge. As such, this study aims to assess the current pattern and trend in NO2 columns over China, based on 10 years of high-quality NO2 column measurements from OMI.
The remainder of the paper is structured as follows: Section 2 describes the NO2 data set in detail. The spatial distribution, seasonal cycle, and 10-year trend of NO2 over China are examined in section 3. Finally, a conclusion is provided in section 4.
OMI is one of the four sensors on board National Aeronautics and Space Administration's (NASA) satellite Aura, which was launched on 15 July 2004 (Boersma et al., 2007; Shaiganfar et al., 2011). As a new sensor for atmospheric compositions, following SCIAMACHY and GOME (Bovensmann et al., 1999; Burrows et al., 1999), OMI is sponsored by the Netherlands’ Agency for Aerospace Programs in collaboration with the Finnish Meteorological Institute (Yu et al., 2010). Aura, a sun-synchronous polar orbit satellite, overpasses between 13:40 and 13:50 hrs local time, and can achieve daily global coverage, with an orbital altitude of about 705 km and scanning width of about 2600 km (Levelt et al., 2006). OMI is a nadir-viewing UV/Vis (ultraviolet-visible) imaging spectrograph that measures the solar radiation backscattered by Earth’ s atmosphere and surface over the entire wavelength range from 270 to 500 nm, with a spectral resolution of about 0.5 nm (Boersma et al., 2007; Levelt et al., 2006). The OMI pixel size is 13 km × 24 km at nadir in normal operation; however, the spatial resolution can be reduced to 13 km × 12 km in zoom mode (Levelt et al., 2006).
A Differential Optical Absorption Spectroscopy (DOAS) method is applied to OMI reflectance measurements to retrieve the NO2 slant column density (SCD) in the 405- 465 nm spectral window, and the tropospheric NO2vertical column density (VCD) from OMI is obtained by dividing the SCD by the tropospheric air mass factor (Boersma et al., 2011). In this study, we use the OMI Level-3 Global Gridded Tropospheric NO2 Data Product (OMNO2d), compiled by NASA (http://disc.sci.gsfc.nasa.gov/Aura/data-holdings/OMI/omno2d_v003.shtml). The OMNO2d tropospheric NO2 VCD, considering only Level-2 fields of view, for which the cloud fraction is less than 30%, were reported on a 0.25° × 0.25° geographical grid.
Based on NO2 data during 2005-14, the distribution of 10-year-averaged tropospheric NO2 VCD over China is shown in Fig. 1a. It is noticeable that the spatial structure of NO2 over China is fairly inhomogeneous, with five areas of high NO2column amount greater than 20 × 1015molec cm-2 encompassing Jing-Jin-Tang (38.5-40.5° N, 115.5-119° E), the combined Southern Hebei and Northern Henan region (35-38.4° N, 113.5-115.1° E), Jinan (36.6-37.3° N, 117.3-118.8° E), the Yangtze River Delta (30.8-32.3° N, 118.5-121.7° E), and the Pearl River Delta (22.4-23.4° N, 112.5-114.1° E), as marked by the purple boxes. Fig. 1a also illustrates that serious NO2 pollution prevails over eastern China (110-120° E) and, particularly, the North China Plain, which suffered from massive NO2 emissions due to heavy industrial activity. In addition, the areas characterized by high NO2 coincide well with the zones under the most rapid economic and industrial development, implying that the majority of NO2 sources can be attributed to human activity (Zhang et al., 2007).
Fig. 1b shows the spatial pattern of trends in NO2 columns during the period 2005-14. Specifically, 10-year trends were determined in each grid cell by fitting a linear regression line to the collected data. It is noted that substantial and widespread NO2 growth occurs predominantly over the North China Plain, with scattered high- value centers over Tangshan, Jinan and Handan, whose rates of NO2 increase amount to as much as 1-1.2 (1015 molec cm-2 yr-1). By contrast, the NO2 concentrations in the three megacities of Beijing, Shanghai, and Guangzhou, despite large amounts (higher than 20 × 1015 molec cm-2; Fig. 1a), have undergone gradual reduction, especially in Guangzhou, as evidenced by the decreased rate exceeding 1.2 × 10¹⁵ molec cm-2 yr-1. Hence, these findings support the fact that the environmental protection measures such as conserving energy, reducing emissions, and improving energy structure, have been effectively implemented in these cities. First of all, strict traffic control was imposed during these years in these cities (Zhang et al., 2012). Moreover, a large number of old and high-polluting vehicles were replaced by newer and low-emission ones, and automotive fuel quality has been improved year by year. Last but not least, the coal-fired power plants and factories with high pollution emission were migrated away from the metropolitan area (Mijling et al., 2013). Consequently, in mega cities of China, the NO2 concentration has decreased substantially.
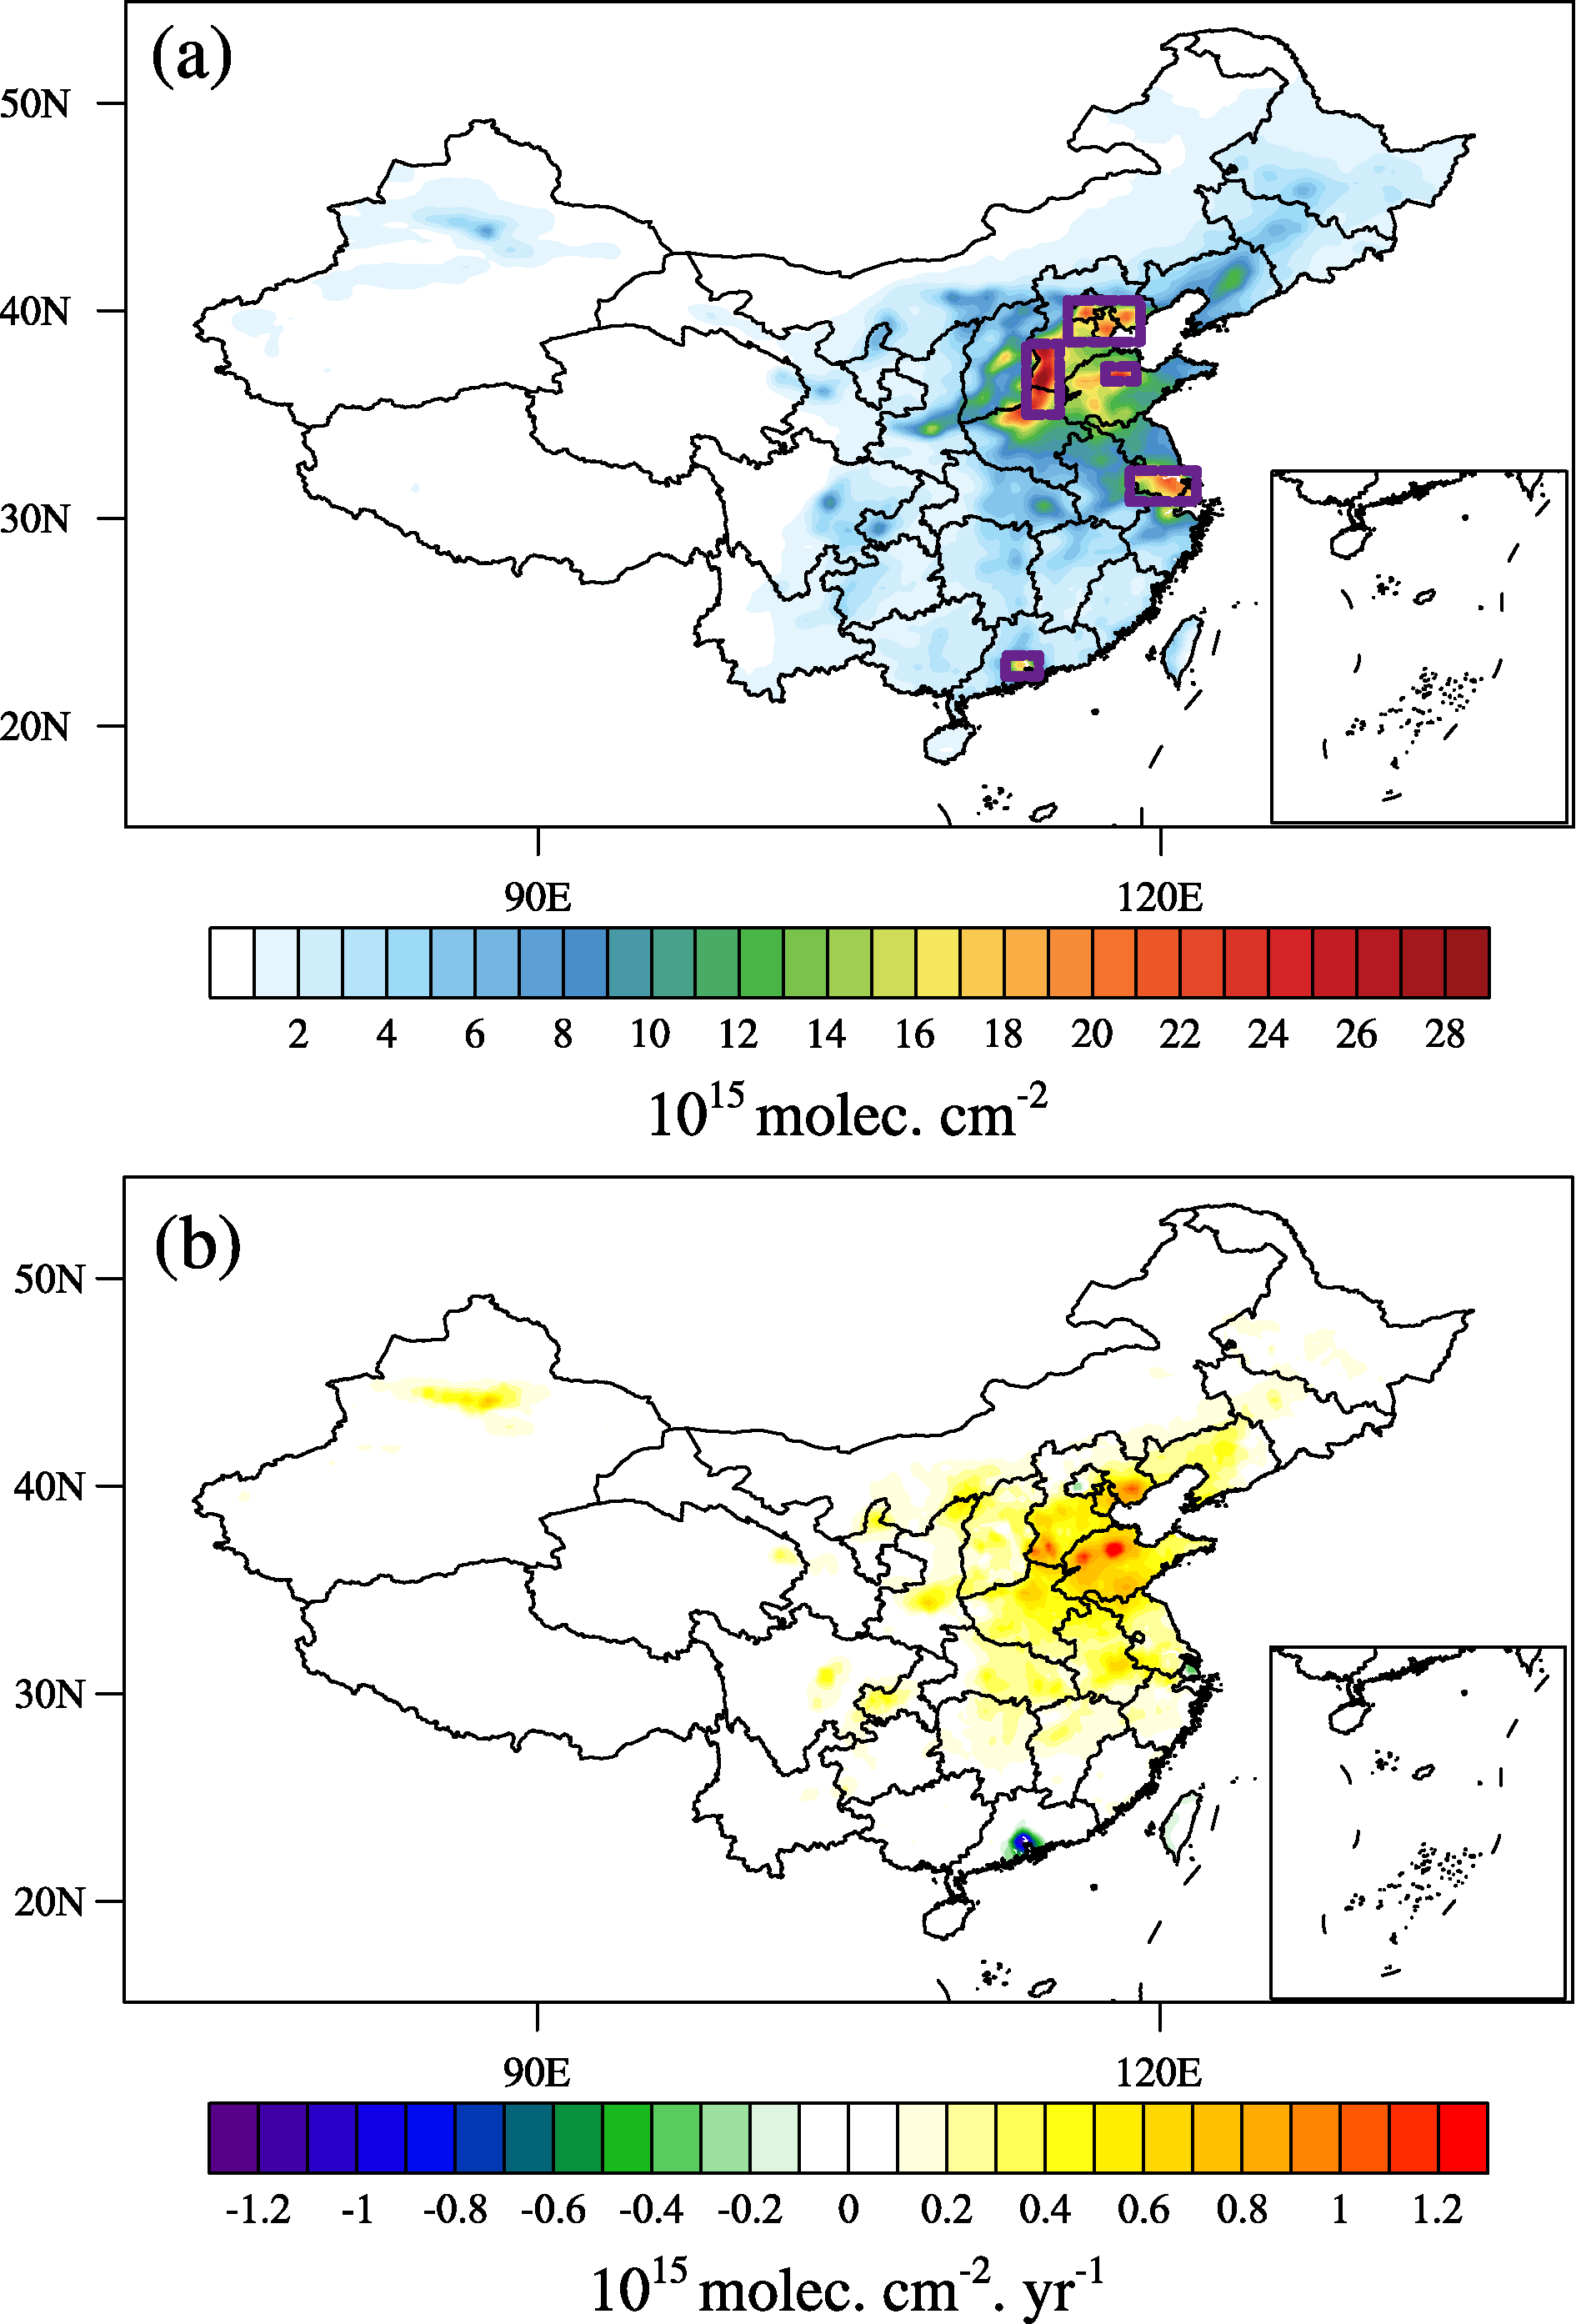 | Figure 1 (a) Spatial distribution of 10-year (2005-14) averaged tropospheric NO2 Vertical Column Density (VCD) over China (unit: 1015 molec cm-2). Purple boxes from north to south denote locations of Jing-Jin-Tang, the combined Southern Hebei and Northern Henan region, Jinan, the Yangtze River Delta, and the Pearl River Delta. See text for the detailed latitude-longitude range for each region. (b) Spatial pattern of NO2linear trends over China during the period 2005-14 (unit: 1015 molec cm-2 yr-1). |
In addition, Urumqi and western Taiwan Island experienced a significant rise and fall at rates of approximately 0.4-0.8 (1015 molec cm-2 yr-1) and -0.1 (1015 molec cm-2 yr-1), respectively. In contrast to the above- mentioned areas that indicate a significant trend, the NO2 in most parts of China exhibits appreciable stability without long-term fluctuation.
Subsequently, the temporal evolution, together with the linear trend averaged over the five hotspots highlighted in Fig. 1a, will be detailed. In each subplot of Fig. 2, the orange line and the purple shading denote time series of NO2 VCD at monthly interval and the 25%-75% range of all data, respectively. Figure 2 reveals two outstanding features of the observed variability: the long-term trend, and a pronounced seasonal cycle. The latter will be discussed in section 3.3. From top to bottom in Fig. 2, the linear rates of change in NO2 VCD over the five domains are estimated to be 0.53, 0.61, 1.03, 0.26, and -0.54 (1015 molec cm-2 yr-1), all of which are significant at the 99% confidence level. Thus, all regions selected, except for the Pearl River Delta, have witnessed a positive trend in NO2 during this recent decade, with the top linear increase of 1.03 × 10¹⁵ molec cm-2 yr-1 observed in Jinan. What’ s more, comparing to the last two areas (Yangtze Delta and Pearl Delta), there appears to be marked sub-monthly oscillations in Jing-Jin-Tang, Southern Hebei and Northern Henan, and Jinan, especially in winter.
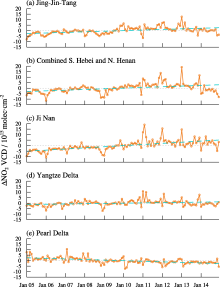
To give insight into the temporal signatures, the strong seasonality reflected by Fig. 2 was removed from the raw data to highlight the anomalous signal. Accordingly, Fig. 3 was drawn to depict the month-to-month variations of NO2 anomalies relative to the 10-year climatology from the five different regions in China. The associated trend is denoted by the blue dashed line. On the one hand, the Pearl River Delta has experienced a notable increase of NO2 during the episode centered on January 2007, followed by progressive declines from 2008 onwards. On the other hand, there appears to be a high degree of consistency in observed oscillations among the rest of the regions, where NO2 dropped rapidly and culminated in a minimum in late 2008, followed by an increase during 2010-13, and later another modest decline to the end of the record. It is also noteworthy that a drastic but ephemeral drop in NO2 column total during 2008 is a common feature shared by the five regions, as a result of air quality protection measures during the summer Olympic Games.
 | Figure 2 Time series of monthly NO2 for the period of January 2005 through December 2014, averaged over the five key regions defined in Fig. 1a. The orange line and the purple shading denote the monthly mean and the 25%-75% range of all data, respectively. |
 | Figure 3 Time series of annual-cycle removed NO2, with the trend line superimposed, for the period of January 2005 through December 2014. |
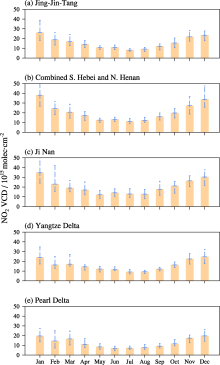
In Fig. 4, each column represents the long-term mean of monthly NO2 VCD for the period 2005-14. Regardless of region considered, dramatic NO2 range occur during winter season, reflecting more pronounced inter-annual variability of NO2 in winter than in summer. What’ s more, the chart shows a remarkable seasonal signature, with a maximum in winter and a minimum in summer, which is shaped by distinct seasonal characteristics of climate conditions, sources, and sinks (Wang et al., 2014a, b). The NO2 VCD differences between summer and winter is less pronounced (less than 10 × 1015 molec cm-2) in the Pearl River Delta, whereas the annual amplitude in the combined Southern Hebei and Northern Henan region exceeds 23 × 1015 molec cm-2, primarily due to a stronger peak in the cold season when significantly enhanced domestic heating emissions overwhelm northern China (Wang et al., 2014b). Finally, regardless of season, the amount of mean NO2 VCD in the Yangtze River Delta region outweighs that in the Pearl River Delta region, and the magnitude in Jing-Jin-Tang is lower than that in either Jinan or the combined Southern Hebei and Northern Henan region.
 | Figure 4 Seasonal cycle of monthly NO2 columns in the five regions during the period 2005-14. The error bars represent the minimum to maximum range which shows interannual variability. |
With extended records derived from satellite sensors, it is of great importance to establish up-to-date knowledge on the spatial and temporal variability of NO2 over China, which has suffered from worsening levels of air pollution. Therefore, the aim of this study was to disclose the spatial distribution and trends of tropospheric NO2 in the most recent decade (2005-14) over China. Several important findings can be summarized as follows:
(1) Five primary locations with NO2 VCD higher than 20 × 1015 molec cm-2 were identified: Jing-Jin-Tang, the combined Southern Hebei and Northern Henan region, Jinan, the Yangtze River Delta, and the Pearl River Delta.
(2) The most substantial and widespread NO2 growths are mainly distributed over the North China Plain. Nevertheless, Beijing, Shanghai, and Guangzhou, the three largest metropolises in China, feature a clear downward trend in NO2 for the period 2005-14, although these three cities have a high average concentration.
(3) On the one hand, there is an increase of NO2 over the Pearl River Delta during 2007, followed by an overall declining trend thereafter. On the other hand, generally consistent behavior is confirmed for the other four regions, i.e., an abrupt decline during 2008 to 2009, then a drastic increase until 2013, and again a decline after 2013.
(4) Significant seasonal cycles of NO2 are observed for each region, with a peak in winter and a minimum in summer. The annual amplitude of NO2 strongly depends on the region considered. There is modest seasonal variation of NO2 in the Pearl River Delta region, while the largest annual NO2 range occurs in the combined Southern Hebei and Northern Henan region, owing to enhanced NO2 emissions in wintertime excited by intense domestic heating.
| [1] |
|
| [2] |
|
| [3] |
|
| [4] |
|
| [5] |
|
| [6] |
|
| [7] |
|
| [8] |
|
| [9] |
|
| [10] |
|
| [11] |
|
| [12] |
|
| [13] |
|
| [14] |
|
| [15] |
|
| [16] |
|
| [17] |
|
| [18] |
|