


Spatial Source Contributions Identification of Acid Rain over the Yangtze River Delta Using a Variety of Methods
[GE Bao-Zhu1 , LIU Ying2, *  , CHEN Huan-Sheng
1 , PAN Xiao-Le1, 3 , WANG Zi-Fa1 ]
, CHEN Huan-Sheng|
|


The source-receptor relation of wet deposition has been a continuous issue in studies of regional environmental pollution over the past two decades. In the absence of direct observational evidence, the problem is difficult to solve—a topic of broad international debate since the turn of the present century. In the present study, a variety of methods focused on the sources of the wet deposition of acidic substances, like sulfate and nitrate, were used to investigate the precipitation chemistry over the Yangtze River Delta (YRD) during 2007. Back-trajectory analysis associated with the observation data and a source tracing method coupled with the Nested Air Quality Prediction Modeling System (NAQPMS) are proved to be effective methods for investigating the sources of wet deposition over the YRD. Comparison among the back-trajectory, footprint, and NAQPMS results shows good consistency, both qualitatively and quantitatively. The most important contributor to acidic substances in the YRD, as well as heavy acid rain over the region, is the anthropogenic pollution from East China, which accounts for more than 70%.
Acid rain, notable for its adverse effects on the terrestrial and aquatic environment, is a regional pollution problem that is mainly caused by anthropogenic emissions of nitrogen oxides (NOx) and sulfur dioxide (SO2). Since the late 1970s, it has been one of the most significant environmental problems in China (Larssen et al., 2006). However, SO2emissions in China have been controlled by the Chinese government since the mid-1990s (Hao et al., 2000), and as such, SO2 pollution shows a ‘ U’ -like change from the 1990s to 2005, with a turning point at around 2000 (Tang et al., 2010). The increasing trend of SO2 concentration after 2000 is mostly due to the growth of China’ s economy and the associated consumption of energy (Ohara et al., 2007); SO2 emissions had increased by around 28% by the end of the tenth Five-Year Plan (2000-2005) (Schreifels et al., 2012), but since then, decreased by 10% in 2010 relative to the 2005 level (Lu et al., 2011). Besides, many studies have indicated that the contribution of other precursors, such as NOx, to precipitation acidity has become more significant than before (Larssen et al., 2006), especially in megacities like Beijing (Huang et al., 2008) and Shanghai (Tang et al., 2005). Richter et al. (2005) reported the tropospheric NO2 column over China, based on satellite observation, to have had an increasing trend during 1996-2004, with a range of 50%. Hilboll et al. (2013) also reported a yearly increasing trend (5%-10% yr-1) in the NO2 column of most megacities in China and the Middle East up until 2011.
Although there have already been a number of studies conducted that focused on the wet deposition of acidic substances such as sulfate (SO42-) and nitrate (NO3-) in various parts of the world (Goncalves et al., 2002; Vautz et al., 2003), especially East Asia (Arndt et al., 1998; Wang et al., 2000; Holloway et al., 2002), large discrepancies exist among the sources of these acidic depositions (Huang et al., 1995; Ichikawa and Fujita, 1995; Carmichael et al., 2002; Kajino et al., 2011; Ge et al., 2014). Several studies have focused on validating source-receptor relationships, based on 3D models and the isotopes of sulfur and oxygen (Jedrysek et al., 2002; Jenkins and Bao, 2006). However, there are a number of limitations, such as the high expense of long-term observations and the scarcity of appropriate measurement sites. The Yangtze River Delta (YRD) is one of the worst heavy acid rain regions in China, and has thus also attracted many studies (Huang et al., 2008; Li et al., 2011; Shi et al., 2014). Such research is undoubtedly beneficial to government policy-makers in their efforts to control acid rain pollution. In this study, one year’ s field measurements at the background station of the YRD (Lin’ an) are combined with back-trajectory and footprint analysis, as well as results from a 3D Eulerian model, to investigate and compare the sources and contribution of acidic substances in the precipitation of the YRD region.
Lin’ an station (Lin’ an Baseline Air Pollution Monitoring Station; (30° 18'N, 119° 44'E); 138 m MSL) is a rural site located in Zhejiang Province. It is 53 km west and 210 km southwest of Hangzhou and Shanghai, which are the two biggest cities in the YRD. In the west and farther south of this station are less developed and sparsely populated mountainous regions. The land-use pattern is typical for rural areas of eastern China and the measurements are expected to represent a large region instead of local emissions (Wang et al., 2004). Precipitation acidity, conductivity, and chemical components in rainfall were observed using a polyethylene polymer bucket of 40 cm diameter at the station, and strict quality assurance and quality control procedures were applied to the dataset from the Acid Rain Monitoring Network, run by the China Meteorological Administration (CMA-ARMN). A detailed description of the station and CMA-ARMN dataset can be found in Tang et al. (2010) and Ge et al. (2011).
A 3D regional Eulerian model coupled with a source-tracing method, the Nested Air Quality Prediction Modeling System (NAQPMS), developed by Wang et al. (2001), is used in this study. The meteorological conditions are driven by version 3.2 of the Advanced Research Weather Research and Forecasting model (WRF-ARW3.2). Carbon-Bond Mechanism Z (CBM-Z), an aerosol thermodynamic model (ISORROPIAI1.7), and a bulk yield scheme of the secondary organic aerosols, treated as six secondary organic aerosol species, have been employed in this model to calculate the gas chemistry, inorganic aerosol processes, and secondary organic aerosol processes, respectively (Li et al., 2012). Dust and sea salt have been divided into four size bins, and the emissions ranging from 0.43 to 10 mm are calculated following Wang et al. (2001) and Athanasopoulou et al. (2008), respectively. The dry deposition module uses the parameterization of Wesely (1989). The cloud and wet deposition module used in this study is similar to version 4.7 of the Community Multi-scale Air Quality model (CMAQ4.7), which includes parameterizations for several types of clouds, including subgrid convective clouds and grid-scale resolved clouds. It includes an aqueous chemistry model for sulfur (Walcek and Taylor, 1986) and a simple mechanism for scavenging, as well as wet deposition algorithms taken from Regional Acid Deposition Model (RADM) (Chang et al., 1987). More details about the model can be found in Ge et al. (2014). The initialization of the meteorology condition and emissions data, as well as the simulation domain and resolution, are same as reported by Ge et al. (2014). There are 6570 × 5370 km2 on a Lambert conformal map projection, with a 30 km grid resolution covering the whole of China, comprising 219 × 179 grids. Vertically, the model uses 20 terrain-following layers from the surface to 20 km MSL, with the lowest nine layers below 2 km.
A source tracing method combined with the primary and secondary pollutants has been developed and coupled in NAQPMS (Wu, 2012). It tags the variation of pollutants in advection and convection transport and diffusion (Wu et al., 2011), as well as the chemical transformation— similar to the Particulate Source Apportionment Technology reported by Wagstrom et al. (2008). Different from a sensitivity simulation, the source tracing method used here is a technique of online tracing of the sources of both primary and secondary air pollutants to their emissions with one simulation. The secondary air pollutants (e.g., SO42-, NO3-, and ammonium (NH4+)) were traced to their precursors by the one-order chemical reaction, step by step. More details about the source tracing method can be found in Wu (2012) and Ge et al. (2014).
Trajectory calculations were performed using version 4.8 of the Hybrid Single-Particle Lagrangian Integrated Trajectory model (HYSLPIT4.8) from the NOAA (National Oceanic and Atmospheric Administration) Air Resources Laboratory (Draxler and Hess, 1998) and the six-hourly-archived meteorological data of the NCEP (National Centers for Environmental Prediction) Global Data Assimilation System (1° × 1° ). The trajectory start-point was (30.3° N, 119.73° E), with a height of 100 m AGL. The three-day forward trajectories were calculated at four times (0000, 0600, 1200, and 1800 UTC) per day for the whole of 2007. After choosing the individual trajectories during the three days before the rainy day, inclusive, the ideal cluster numbers were determined by the total spatial variance. The use of cluster statistical analysis on large amounts of trajectories to some extent overcomes the limitations and uncertainties that apply to individual trajectory calculations, by consideration of groups of trajectories with similar behavior. Ensembles of trajectories are more representative of the real transport of air particles and the atmospheric motion (Moody et al., 1995; Stohl, 1998; Cape et al., 2000; Stohl et al., 2002). Actually, Song and Gao (2009) analyzed the differences among chemical components in rainfall from different air parcels over the eastern coast of America using HYSLPIT. However, the impacts of air pollutants from each direction have not yet been determined quantitatively. In this study, the contribution of species i from each cluster was calculated through the following equation:

where Coni is the concentration of species i, while Numj and Rainj represent the number of trajectories of each cluster and the total volume of rainfall, respectively. Based on this method, the contributions of the main components in precipitation (SO42-, NO3-, and NH4+) from different air parcels were determined quantitatively.
Flexible Particle Dispersion Model (FLEXPART) is a Lagrangian transport and dispersion model, developed by the Norwegian Institute, suitable for the simulation of a large range of atmospheric transport processes (Stohl et al., 2005). Five days of back footprints at Lin’ an station (30.3° N, 119.73° E) were calculated at four times (0000, 0600, 1200, and 1800 UTC) per day for the whole of 2007. Similar to the back trajectories using HYSPLIT, only the days before and including the rainy days were selected. The averaged high and low level of each chemical component in rainfall was distinguished by the SO42- concentration. Using this method, the relationships between the air parcel’ s transport and chemical components in precipitation could be addressed.
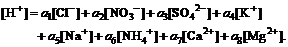
Figure 1 shows the results of footprints with the high (SO42- concentration > 200 µ eq L-1) and low (SO42- concentration < 50 µ eq L-1) levels of chemical component during the summer of 2007 in Lin’ an. The volume- weighted averaged pH (pHVWA) values in low and high concentration periods were 4.1 and 3.8, respectively (Table 1). Compared to the differences of each component between the two periods, the SO42- concentration was significant. This implied the SO42-might have been the most responsible for the high pH value during the low concentration period. Besides, the results of multiple linear regressions between pH and all the ions of precipitation (Eq. (2); Okuda et al., 2005) show that SO42- had the greatest impact on the variation of pH in Lin’ an (Table 1). The a1-a8 represented the slope of the each ions during the multiple linear regressions.
It is shown that the sources of chemical ions in precipitation during the high concentration period were the heavily polluted areas of Jiangsu Province, Shanghai, and Fujian Province, while relatively clean local and high-seas areas were the sources in the low concentration period.
'> | Figure 1 Footprint analysis results under high and low concentration periods in Lin'an: (a) the time series of ions in the rainfall, (b) the footprint results during Low period, and (c) High period. |
| Table 1 The concentrations of major ions in precipitation during high and low concentration periods and the all-summer period of 2007 in Lin’ an (units: µ eq L-1), the number of rainfall days (‘ Num’ ) (units: d), and rainfall volume (‘ Rain’ ) (units: mm). |
There were 376 trajectories, mainly from east, southeast, and northeast directions, among the three days’ back-trajectory for the rainy day in Lin’ an calculated by HYSPLIT 4.8. These individual trajectories were grouped into six clusters using the clustering tool, and the results are shown in Fig. 2. Observed ion concentrations and pH values were associated with the trajectories and then grouped according to the trajectory clusters. The statistics for each group of data are listed in Table 2. The pHVWA values in all clusters are lower than 4, meaning heavy acid rain. Cluster 1, accounting for 21%, originated from Jiangsu Province and Shanghai, with a low pHVWA value (3.59) and the highest concentration of ions (averaged concentrations of SO42- and NO3- were 152.83 and 71.97 µ eq L-1, respectively. Clusters 2 and 5 originated from the Bohai Sea and the Eastern Sea, with significant correlations of Cl- and Na+ (correlation coefficients reached 0.94 and 0.89, respectively). Cluster 3 was from the North China Plain, but passed over the Bohai Sea, Shandong Peninsula and the marginal seas of China. The pHVWA value was the lowest among all the clusters. Clusters 4 and 6 were both from the south and southwest of the observation site. The high concentration loading of sulfate (73.55-92.76 µ eq L-1) but low nitrate (30 µ eq L-1) in these two clusters was due to the long-range transport of the former species compared to the latter.
 | Figure 2 Back-trajectory clusters before and on the rainy day in Lin’ an. |
| Table 2 Trajectory clusters and their corresponding averaged concentrations of ions in precipitation (units: µ eq L-1), and the averaged height (‘ Height’ ) (m). |
The transport pathways of acidic substances through air parcels have been studied previously using HYSPLIT and FLEXPART, both of which are Lagrangian models (Das et al., 2011; Zhang et al., 2012). However, regional transport in quantitative terms remains unclear. To address this, the 3D regional Eulerian model NAQPMS was used in the present study. The whole simulated domain was divided into eight areas, as described in detail in Ge et al. (2014): southeastern China (SE); eastern China (EC); central China (CC); northwestern China (NWC); northeastern China (NEC); southwestern China (SW); North China (NC); and other countries and areas (OTHER). Besides, Zhejiang Province was separated from EC for the purpose of quantitatively analyzing the source of wet deposition in the objective area. The performance of NAQPMS in simulating the rainfall and acidic substances over the YRD region was verified by comparison with the observational data from Lin’ an (Fig. 3). The simulated rainfall throughout the whole year was a little lower than observed: 1184 mm and 1535 mm, respectively. Compared with observation, NAQPMS represented the magnitude and variation of the volume-weighted concentration (VWA) of the yearly nitrate and ammonium well, but underestimated the sulfate. This may have been partly due to the overestimation of rainfall by WRF-ARW3.2. Besides, the location and height of a large power station or other forms of industry in the emissions inventory, as well as the chemical transformation of SO2 to sulfate in aqueous chemistry, may also have influenced the simulated concentration of sulfate in precipitation. However, the normal averaged bias of simulated sulfate was 26% if we considered the errors from rainfall prediction. This is within the range of a factor of two, which is the commonly used criterion for wet deposition simulation.
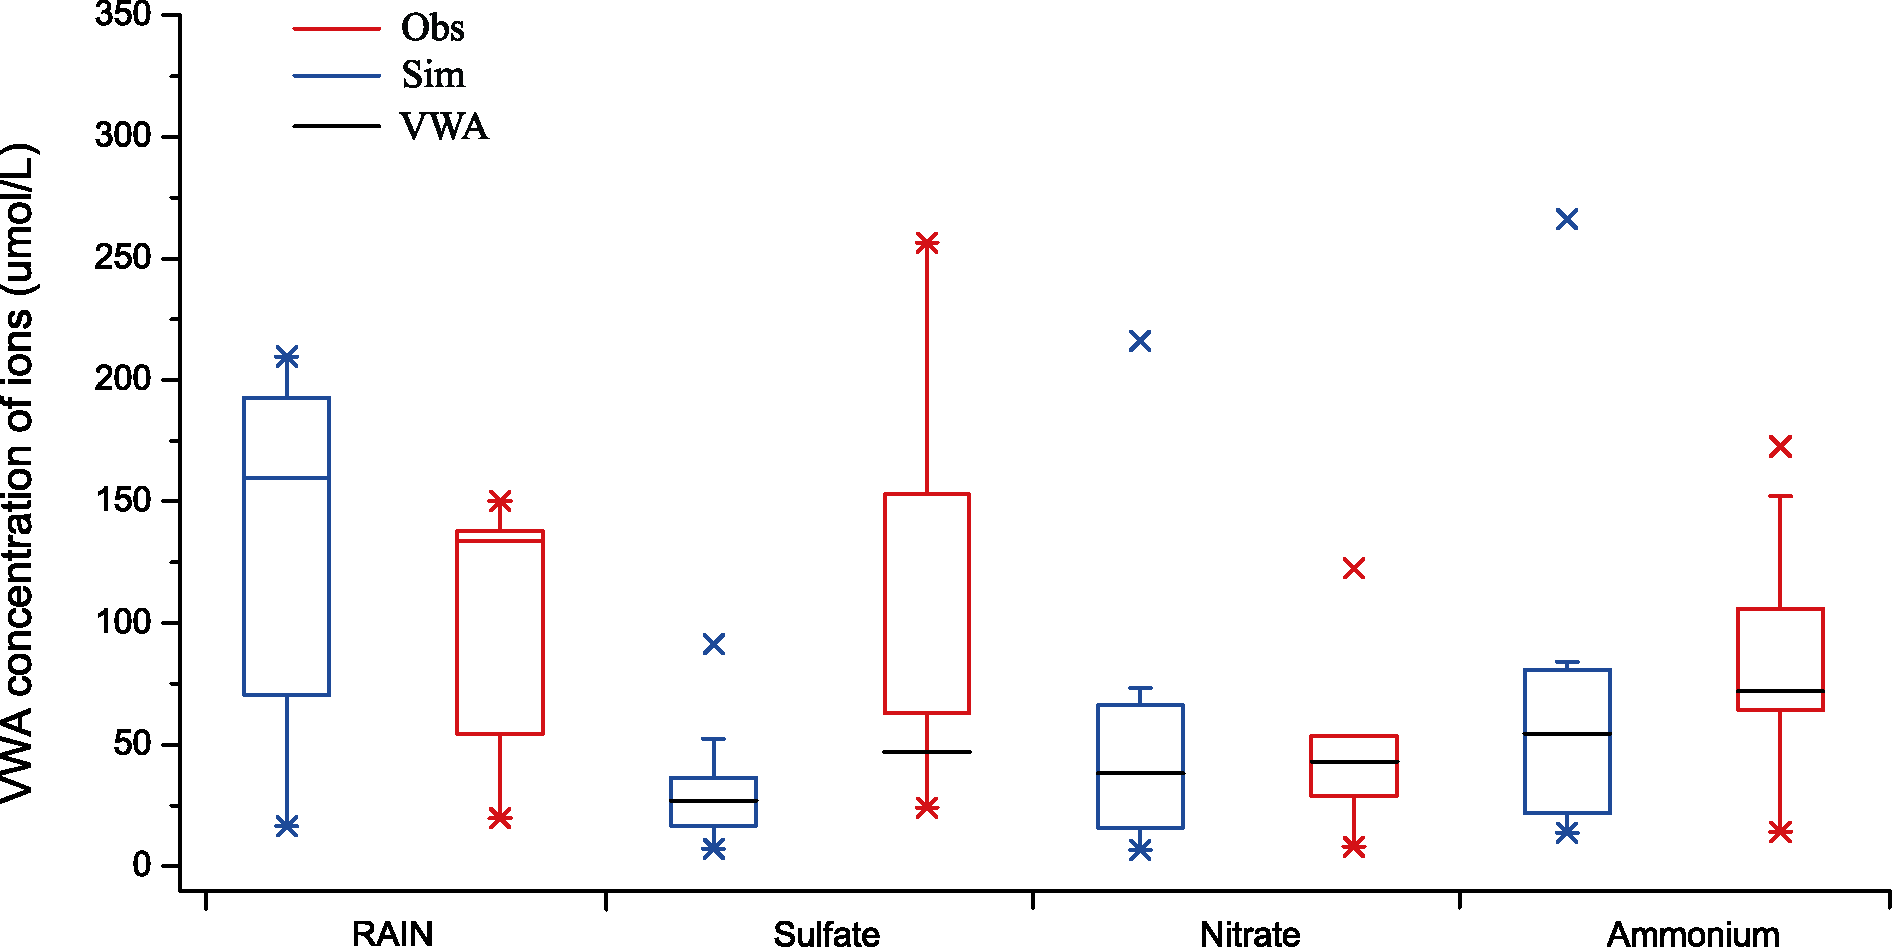 | Figure 3 Comparison of simulated and observed rainfall and ion concentrations. VWA is the volume-weighted averaged concentration in the precipitation for the whole year. |
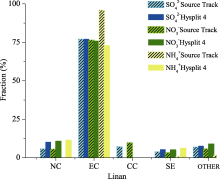
For comparison, the transport pathways at the observation site based on HYSPLIT were also examined and combined with the results of Source-Receptor Relations based on NAQPMS (e.g., Clusters 1, 2, and 4 belonged to EC; Cluster 5 was close to OTHER; Cluster 3 was similar to NC; Cluster 6 belonged to SE). Table 3 and Figure 4 show the source contributions of the major ions in the precipitation during 2007. Similar to the back-trajectory results, surrounding areas had the most important influence on the ions in precipitation at Lin’ an. The influence from EC for SO42-, NO3-, and NH4+ was 76.9%, 76.3%, and 95.8%, respectively. These results are consistent with the back-trajectory results, with the sum of the loading influences from Clusters 1, 2, and 4 reaching 77.1%, 75.6%, and 72.7%, respectively. Both NAQPMS and HYSPILT gave a 5%-7% contribution to the SO42- and NO3- from outboard, except the NH4+. Besides, SE and NC also contributed less than 5% and 10%, respectively. Importantly, the local contribution to NH4+ based on NAQPMS (95.8%) was much higher than that based on HYSPLIT (72.7%). This was mainly due to the physical and chemical parameterization used in the 3D Eulerian model, such as the NH3 dry deposition parameterization, which has a very high dry deposition speed— twice as high as NO2 (Zhang et al., 2004). Meanwhile, NH4+ was only influenced by NH3 and was deposited more in the local area, rather than transported over a long range.
| Table 3 Contribution of regional transport of the major ions in precipitation based on the Hybrid Single-Particle Lagrangian Integrated Trajectory model (HYSPLIT) and the Nested Air Quality Prediction Modeling System (NAQPMS) methods (units: %). |
 | Figure 4 Comparison of regional transport sources using the HYSPLIT and NAQPMS (source track) methods. |
Based on the back-trajectory and footprint analysis methods, partly combined with observational data at Lin’ an station, the reliability of the source-tracing method coupled with the 3D regional Eulerian model NAQPMS was verified qualitatively and quantitatively. The sources of acidic substance deposition at Lin’ an was analyzed comprehensively, and the results show that the results based on back-trajectories can be verified with that from NAQPMS. For Lin’ an, the acid deposition mainly derived from the eastern, southeastern, and northeastern direction during the three days before the precipitation occurred. Besides, the pHVWA values were less than 4 in all of the trajectories, meaning Lin’ an was one of the heavy acid rain regions. The results from the footprint analysis and multiple linear regressions between all ions and the pH implied that the SO42- might have been most responsible for the high pH values during the low concentration period.
Both the results from HYSPLIT and NAQPMS showed that, during the high concentration period, chemical ions of precipitation originated from the heavily polluted areas of Jiangsu Province, Shanghai, and Fujian Province, while relatively clean local and high-seas areas were the sources in the low concentration period. In short, East China contributed the largest amounts of acidic substances (e.g., SO42-, NO3-, and NH4+) loaded in the precipitation over Lin’ an, which accounted for more than 70%. However, these results may have limitations due to the uncertainties from the model, as well as the source- tracing methods, in dealing with the nonlinearity between secondary pollutants and their precursors. Unfortunately, there is no direct evidence from observations to address these uncertainties yet. More efforts are needed to address these issues, such as multi-model comparisons (the Model Inter-Comparison Study for Asia project, for instance (Wang et al., 2008)), which may offer the opportunity to reduce the uncertainties in different models and methodologies in the future.
| [1] |
|
| [2] |
|
| [3] |
|
| [4] |
|
| [5] |
|
| [6] |
|
| [7] |
|
| [8] |
|
| [9] |
|
| [10] |
|
| [11] |
|
| [12] |
|
| [13] |
|
| [14] |
|
| [15] |
|
| [16] |
|
| [17] |
|
| [18] |
|
| [19] |
|
| [20] |
|
| [21] |
|
| [22] |
|
| [23] |
|
| [24] |
|
| [25] |
|
| [26] |
|
| [27] |
|
| [28] |
|
| [29] |
|
| [30] |
|
| [31] |
|
| [32] |
|
| [33] |
|
| [34] |
|
| [35] |
|
| [36] |
|
| [37] |
|
| [38] |
|
| [39] |
|
| [40] |
|
| [41] |
|
| [42] |
|
| [43] |
|
| [44] |
|
| [45] |
|
| [46] |
|
| [47] |
|