
Comparative Analysis of Extreme High Temperature Weather in the Summers of 2013 and 2003
[ZHANG Li-Sheng , XUE Jian-Jun, WANG Wei-Guo, SUN Jin]
, XUE Jian-Jun, WANG Wei-Guo, SUN Jin]
|
|


The characteristics of regional high temperature (HT) weather in 2013 and 2003 and their causes were studied using daily maximum temperature data, National Center for Environmental Prediction (NCEP) reanalysis data, and outgoing longwave radiation (OLR) data. For these two years of HT weather, there were many similar characteristics, such as their long duration, wide range, high intensity, and severe influence. However, there were also three obvious differences: firstly, in 2013, the major area where HT weather occurred was farther north than in 2003; secondly, the HT weather in South China and the southeast area of Jiangnan in 2013 lasted fewer days than in 2003, but in other areas it lasted for more days than in 2003; thirdly, the intensity of the HT weather in 2013 was also stronger in the north and weaker in the south, similar to that of the duration. A strong and stable western Pacific subtropical high (WPSH), a continental warm high, and the distribution of the warm center in the lower troposphere played important roles in the HT weather formation. Several probable causes for the differences are that the cold air was weaker, the WPSH was farther north, and the tropical convective systems were stronger in 2013 than in 2003. Finally, a preliminary cause analysis of the WPSH anomaly was presented.
A number of studies and observations have explored whether extreme weather and climate events are increasing due to the warming climate ( Ding et al., 2002; Ding, 2006; Qin et al., 2007). Extreme high temperature (HT) events have increased in many regions of the world, and have also shown stronger, more frequent and longer- lasting features ( Nasrallah et al., 2004; Ding, 2006; Bartolini et al., 2008). In recent years, regional HT weather processes have occurred frequently in China, and have caused serious threats to human health, energy supply, environment, agriculture, animal husbandry, and so on ( Mao et al., 2007; Xu et al., 2009).
Generally, HT weather is defined as a weather phenomenon where the daily maximum temperature reaches or exceeds 35°C, and it is called a heat wave if the HT weather continues for three or more days. In the summer of 2013, an extremely unusual heat wave hit central and eastern China. Its long duration, wide range, and high intensity led to severe drought in many provinces. It was reminiscent of another extreme HT event that occurred in South China during the summer of 2003. Some studies were carried out on the characteristics, impact and causes of the HT weather of 2003 ( Liu et al., 2006; Sun et al., 2004; Lin et al., 2005). It is generally believed that a strong and stable western Pacific subtropical high (WPSH) is a decisive cause of HT weather ( Tao et al., 2001; Wei et al., 2004). However, there are different opinions for the reason for the anomalous WPSH. A strong upper tropospheric subtropical jet and the eastward extension of the South Asia High ( Liu et al., 2006), normal sea surface temperature in the Pacific-Indian Ocean ( Yang and Li, 2005), non-diabatic heating in the subtropics ( Lin et al., 2005), or even a weak El Niño that occurred at the beginning of 2003 ( Ding et al., 2007) may have played an important role in the intensity and location variation of the WPSH.
For the HT weather in 2003 and 2013, there were some differences and several similarities. This study analyzes the similarities and differences of the HT weather characteristics in the two years and their causes, using the daily maximum temperature data of 2400 stations, National Centers for Environmental Prediction (NCEP) reanalysis data with 2.5°×2.5° resolution, outgoing longwave radiation (OLR) data, and sea surface temperature (SST) data, to answer the following questions: What caused the differences? What caused the extreme high temperature? And what are the reasons for the anomaly of the WPSH? Any other meaningful results found by analyzing these two years of high temperature will also be reported.
Central and eastern China suffered from wide-ranging and long-term HT weather from 30 June to 18 August 2013. It can be divided into three stages: 30 June to 22 July, 23 July to 4 August, and 5 to 18 August. In the first stage, the HT events were mainly located in Jiangnan, Huanghuai, and Chongqing, and their intensities were between 35°C and 38°C. In the second stage, the range widened and the intensity enhanced, with temperatures between 39°C and 40°C beginning to appear. The third stage was the strongest, as the range and intensity of the HT continued to rise, and extreme maximum temperature also appeared. There are three significant characteristics: long duration, wide range, and high intensity.
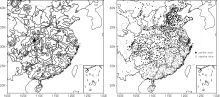
It can be seen that there were 20 to 40 HT days in areas from Jiangnan to southern North China, and 40 to 48 HT days in Central Jiangnan (Fig. 1a). Among these, Changsha City in Hunan Province had 48 continuous days of HT from 30 June to 16 August, which was a record for continuous HT days. During the period, the HT weather was so wide spread that it hit 17 provinces including Zhejiang, Jiangxi, Hunan, Hubei provinces, and Chongqing. On 6 August, an area of 1.97 million square kilometers, more than 1/5 of the country, was covered by HT weather.
 | Figure 1 High temperature (HT) days (daily maximum temperature ≥ 35°C; units: days) (a) from 30 June to 18 August 2013 and (b) from 30 June to 11 August 2003. The regions with more than 20 HT days are shaded. |
This HT intensity had rarely been seen before. The extreme maximum temperatures in Jiangnan, Jianghan, and Chongqing were almost over 40°C; and on 10 August, the area of extreme maximum temperature was about 0.28 million square kilometers. In Xinchang City in Zhejiang Province, the temperature reached up to 44.1°C,which was the highest temperature in central and eastern China in 2013 and broke the existing record of 42.8°C recorded in 2003. Fenghua City in Zhejiang Province and Jiangjin City in Chongqing municipality also reached temperatures up to 43.5°C. According to the statistics, 195 cities and counties in central and eastern China achieved new records for the daily highest temperatures during this period.
We calculated the average precipitation of 10 HT provinces in the south during the HT period from 1961 to 2013 (not shown). It was found that the average precipitation for 2013 was only 156 mm, which was 56% of the perennial average and the lowest average since 1961. As a result, the extreme HT combined with a lack of rain conspired to create a severe drought. According to preliminary statistics, 14 provinces had varying degrees of drought, and nearly 16 million people faced drinking- water problems. In addition, dozens of people in Jiangsu Province, Shanghai, and Zhejiang Province died of heatstroke.
As there is information available in previous studies, in this section we give a simple analysis and supplement of the HT weather in 2003. It mainly occurred from 30 June to 11 August, and was concentrated in most parts of the south. As shown in Fig. 1b, there were 20 to 35 HT days in Jiangnan, northern South China, and northern Chongqing, and 38 to 42 HT days in central and southern Zhejiang, Fujian, central Jiangxi, and southern Hunan provinces. Of these, 5 to 14 HT days were above 40°C, and these were in the southern and central region of Jiangnan.
Summer extreme maximum temperatures reached 38°C to 40°C from the Yangtze River to the northern region of South China, and 40°C to 43°C in southern Zhejiang, northern Fujian, and central Jiangxi provinces. The highest temperature was 43.2°C, which occurred in Lishui City in Zhejiang Province. The daily highest temperatures of about 310 cities and counties recorded new records in the 2003 summer, including Lishui, Longquan in Zhejiang Province, and Fuzhou in Fujian Province ( Yang and Li, 2005). In 2003, a wide range of HT weather between 39°C and 41°C and extreme HT mainly appeared from 14 July to 11 August, i.e., the second stage.
Similar to 2013, drought rapidly developed in Jiangnan and South China due to sustained HT and scarce rainfall (only 135 mm; 57% of the normal average during the HT period). In the east and south areas of Zhejiang Province, there was the most serious drought since the founding of new China. Another drought, the most serious since summer 1971, occurred in Fujian, Hunan, and Jiangxi provinces. Moreover, livelihoods and agricultural/economic production were severely affected, and there were a large number of deaths due to heatstroke.
According to the above descriptions, we can see several similarities: the HT weather in both years occurred in late June to mid-August; they not only showed the same characteristics of long duration, wide range, and high intensity, but also both had a serious impact on local livelihoods and agricultural/economic production, and caused serious summer drought; and they both belonged to extreme HT events according to the monitoring standards of extreme events ( Zhai and Pan, 2003). However, several obvious differences can also be seen in terms of different strength parameters, such as the HT region, the number of HT days, and the maximum temperature, which are now described in detail.
Firstly, the main HT region in 2013 was farther north than in 2003. As can be seen from Fig. 1, the region with over 20 HT days in 2003 was mainly concentrated in Jianghan and South China, but in 2013 it was from Jiangnan to the southern Huanghuai area, which is farther north than in 2003.
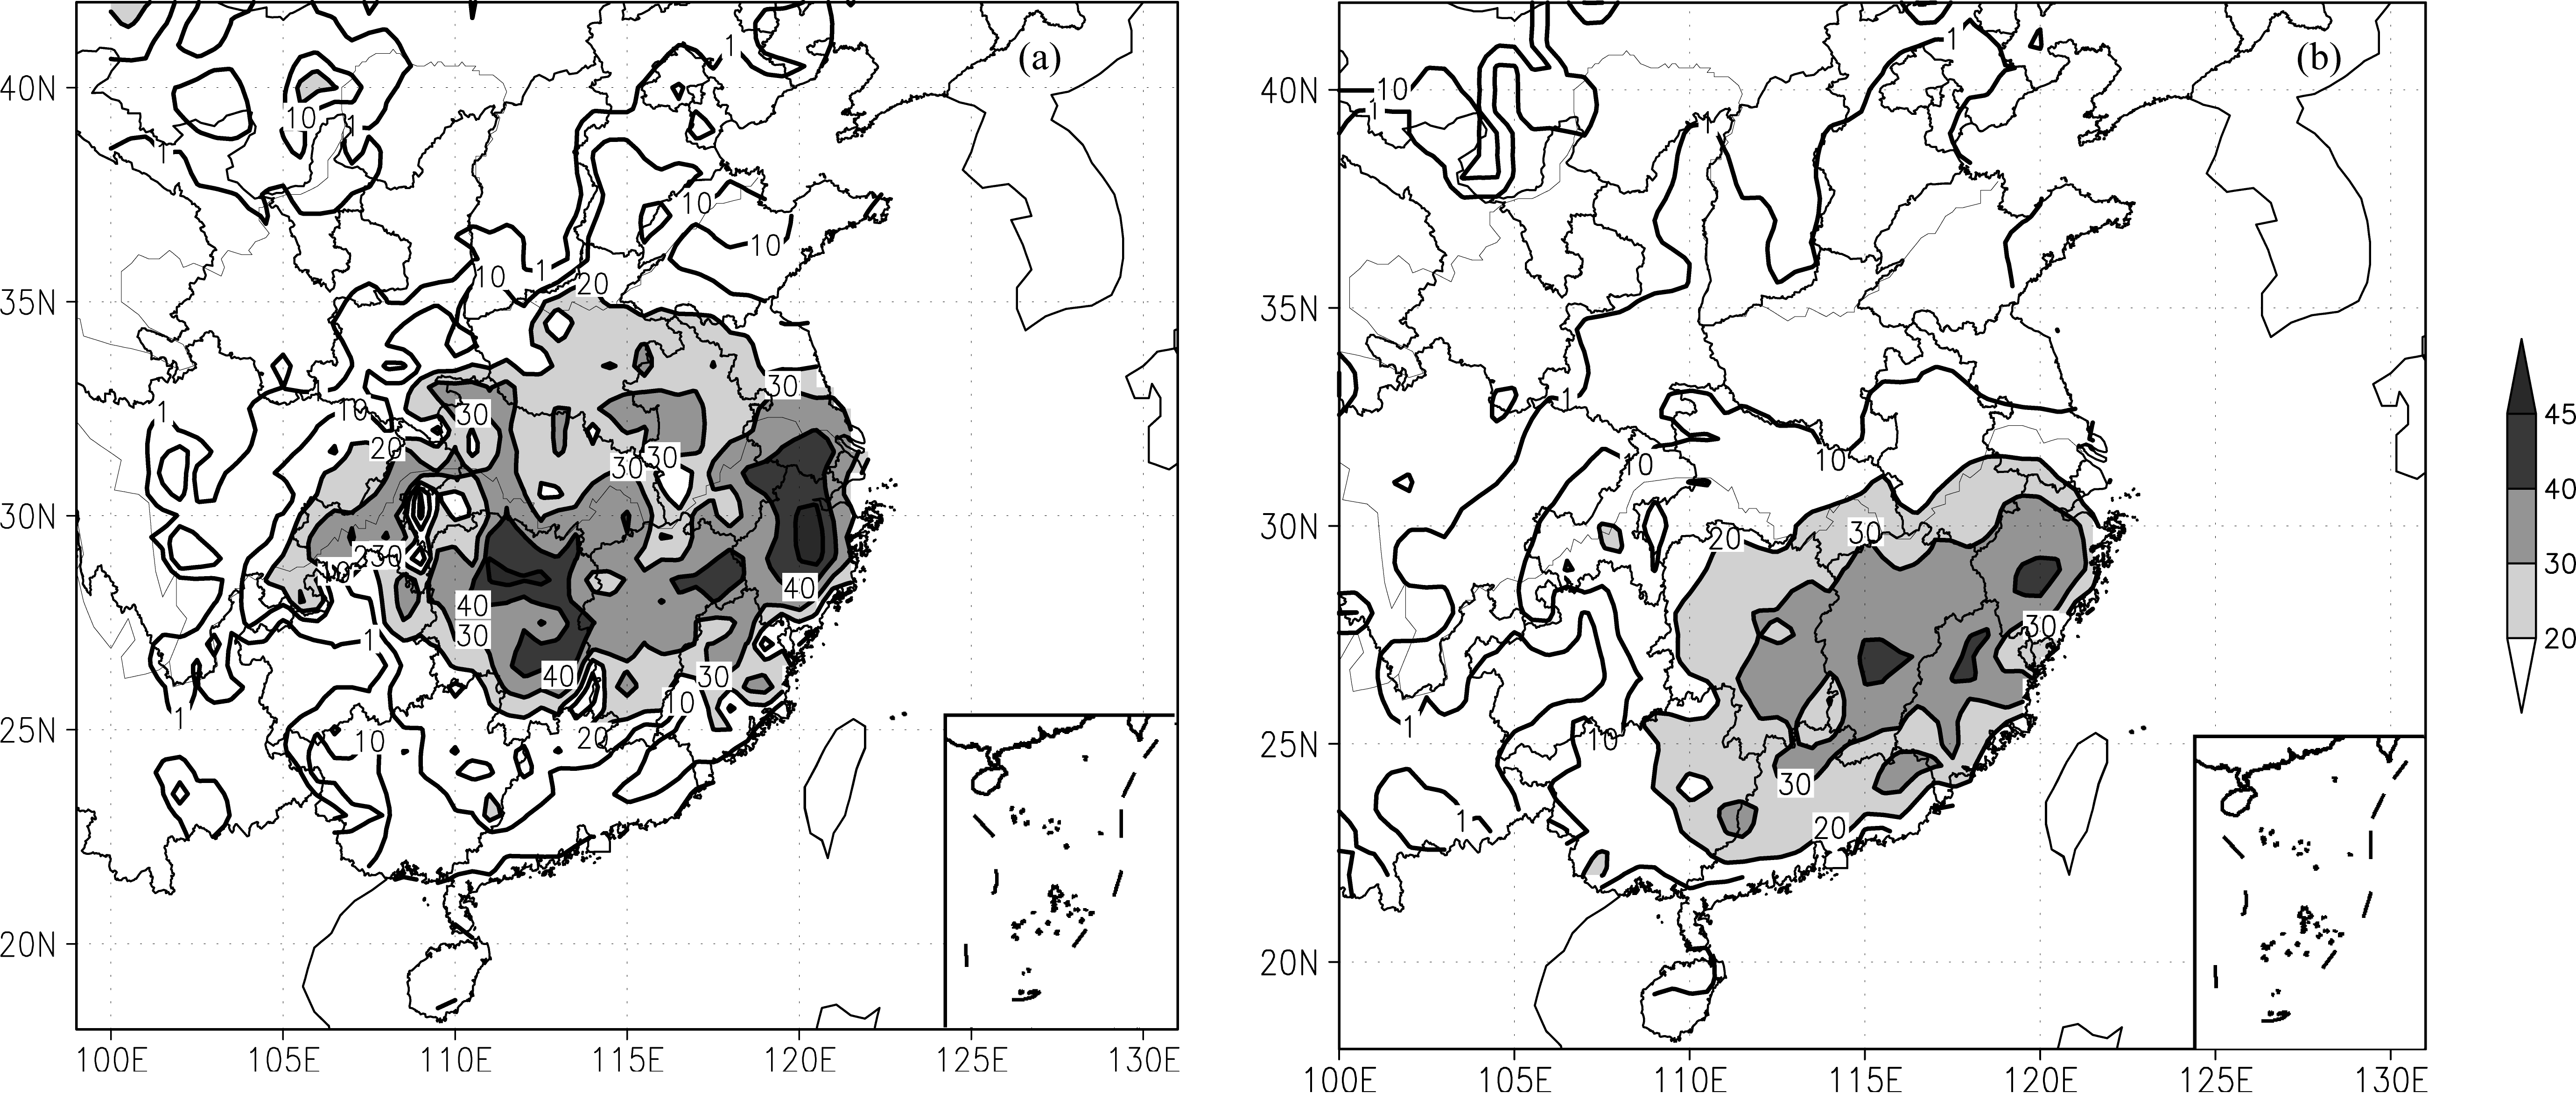
Secondly, the wide range of HT weather in 2013 continued from 30 June to 18 August, which was longer than in 2003. As presented in Fig. 2a, north of the Yangtze River there were 5 to 20 more HT days than in 2003, but in South China there were 5 to 15 fewer HT days. In Jiangnan, where both HT years were the most serious, there were more HT days in 2013 than in 2003, except for southern Jiangxi, southern Zhejiang, and Fujian provinces. However, there were fewer HT days over 40°C than in 2003 in most parts of Jiangnan, except northeastern Jiangnan and western Hunan Province.
 | Figure 2 Differences between (a) number of HT days (units: days) and (b) maximum temperatures between 2013 and 2003, where a positive value (or solid dot) represents more (or higher) in 2013 and a negative value (or open circle) represents more (or higher) in 2003. |
Finally, from the comparison of the extreme maximum temperatures from the two years (Fig. 2b), it can be seen that the extreme maximum temperatures in 2013 were higher than in 2003 in southern North China, Huanghuai, Jianghuai, northeastern Jiangnan, Hunan Province, some parts of Hubei Province, Chongqing, and eastern Sichuan Province, but lower in other regions. There was a situation of “north-strong-south-weak”, similar to the HT duration difference described above.
According to the first law of thermodynamics, temperature advection, adiabatic heating caused by vertical motion, and diabatic heating are important parameters affecting temperature variation. From 27-34°N, the average temperature advection variation with time at 850 hPa (not shown) showed a negative temperature advection in the area to the east of 110°E, which was not conducive to HT. However, two other parameters were positive, and were associated with the WPSH. As mentioned in section 1, the unusual WPSH is thought to be the main cause of extreme HT.
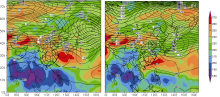
The line 5880 of the WPSH extended westward to near 115°E and its ridge line was located near 28°N; and the line 5860 also extended westward to the west of Chongqing in 2013 (Fig. 3a, lines). As can be seen from the height anomaly, there was a 10-gpm positive anomaly over central and eastern China and a 20-gpm anomaly over Huanghuai to the Yellow Sea. Therefore, the WPSH was stronger and more westward, and central and eastern China was under the influence of the WPSH. In 2003, the WPSH was more southward and westward than in 2013, because the line 5880 of the WPSH extended westward to near 110°E and its ridge line was located near 26°N (Fig. 3b). The daily geopotential height at 500 hPa (not shown) revealed that the WPSH extended westward and moved northward at the end of June, and it twice swung in an east-west direction before mid-July owing to a strong westerly trough and super typhoon “Soulik”. It subsequently remained over central and eastern China until 14 August. Hereafter, the WPSH gradually began to lose its territory in the south and moved away from the north again, due to two successive strong typhoons. As a result, the sustained HT weather occurred, due to sinking air warming and clear-sky radiation heating in the WPSH.
 | Figure 3 Average geopotential height at 500 hPa (solid lines; units: gpm) and its anomaly (dotted lines; units: gpm) and outgoing longwave radiation (OLR) (shaded; units: W m-2) (a) from 30 June to 18 August 2013 and (b) from 30 June to 11 August 2003. |
Relatively flat circulation can be seen in the midlatitudes, and a weak high-pressure ridge in the Inner Mongolia area and a weak westerly trough in Northeast China (Fig. 3) can also be seen. When the warm high ridge moved eastward, it combined with the WPSH and gave rise to a northward expansion of the WPSH. Several northward expansions can be seen in the daily geopotential height. Besides, from the temperature distribution at 850 hPa, we can see a significant warm center over the middle and lower reaches of the Yangtze River in 2013, and over Jiangnan in 2003. Centers of 22°C, 23°C, and 24.4°C appeared in the three stages of 2013, while centers of 22°C and 22.7°C appeared in the two stages of 2003. These centers have a positive correlation with the location and intensity of the HT. Therefore, both the continental high and the temperature distribution in the lower troposphere were important causes of the HT in addition to the WPSH.
3.2.1 Effect of cold air from the north
Why has the WPSH remained so stable for so long? Usually, the WPSH is located in the Yangtze River area in summer, and moves southward or eastward because of westerly troughs and typhoons. As a result, HT weather continues for a short time and shows characteristic stages.
In the two years we analyzed, the “two ridges and one trough” meridional circulation appeared in the high latitudes at 500 hPa (Fig. 3). The circulation situation remained during the HT period, which meant that no strong cold air was coming down from the north. Moreover, relatively flat circulation was seen in the midlatitudes, and there was a weak westerly trough in Northeast China, which implies that the cold air was weak, and not enough to change the position of the WPSH.
The Artic Oscillation (AO), an important climatic system in the polar region and at mid-high latitudes, plays an important role in the weather and climate of China ( Gong, et al., 2002; Gong and Wang, 2003; Zhang et al., 2009). Most research has focused on the winter AO, but the relationship between the summer AO and weather in China has received more attention recently ( Deng, 2005; Guo et al., 2009). During the HT periods of both years, there was low pressure in the polar region and a high pressure belt between 65°N and 85°N, which established that the AO was in its positive phase. As a result, the cold air in the polar region was blocked and could not flow to the south. This was perhaps an important cause of the weak cold air in the midlatitudes. In addition, the polar vortex was stronger and restricted to the eastern hemisphere side in 2003, which led to stronger cold air than in 2013.
3.2.2 Effect of tropical systems
An apparent low-value belt can be seen from 5°N to 20°N from the OLR distribution (Fig. 3), which represents the intertropical convergence zone (ITCZ). Negative anomalies existing in the ITCZ (not shown) revealed that convective activities in the tropics were relatively strong. Moreover, a strong ITCZ favors typhoon formation. In fact, five typhoons landed on the southern China coast in 2013, and all came from the west. In 2003, during the period of HT, three westward typhoons also landed on the southern China coast. Westward typhoons prevent the WPSH from retreating southward and are conducive to maintaining the WPSH and moving it north.
3.2.3 Effect of sea-water temperature
The SST anomaly had an important influence on atmospheric circulation. From July to August, there was an obvious positive anomaly in the West Pacific to the west of 160°E in 2003 and 2013 (not shown), which was beneficial to the maintenance and enhancement of the WPSH. A 0.9°C positive anomaly center was located at 25-33°E, south of Japan, in 2013, and a 1°C center was at 21-25°E in 2003. This may be one important reason for the WPSH in 2013 lying further north than in 2003.
It can be seen from Fig. 3b that a cold vortex with a -20 gpm negative anomaly center was over Northeast China in 2003, which represents stronger cold air than in 2013. There was also a more profound westerly trough with a -30 gpm negative anomaly center over northern Xinjiang, significantly stronger than in 2013, so cold air was transported southeastward when it shifted eastward. Both of these cold air movements were stronger than in 2013, and had a more obvious impact on the position of the WPSH, which is one of the reasons why the WPSH was farther south than in 2013. As a result, the HT weather in the north was significantly weaker in 2003 than in 2013.
Comparing the OLR distribution of the two years (Fig. 3), we can see that the ITCZ was weaker and farther south in 2003, which was another important reason why the WPSH was farther south than in 2013. This led to a stronger HT event in South China in 2003. At the same time, we also note that the convective activity in the north of China was stronger in 2003, which may be another reason why the center of the HT was farther north in 2013.
In addition, the OLR was below 240 W m-2from Chongqing to western Hunan Province in 2003, lower than in 2013; and these were associated with the activity of cold air. As mentioned above, the two cold air movements were stronger in 2003 and usually arrived at the northwest edge of the WPSH, which made the convection of this area stronger than in 2013. Because of this, the HT from Chongqing to western Hunan Province was weak in 2003, despite the fact that the WPSH was more westward.
In summer 2013 and 2003, extreme HT events occurred in central and eastern China. Many similar characteristics were apparent, such as their long duration, wide range, high intensity, and severe influence, but there were also obvious differences in three aspects: their location, the extreme maximum temperature, and the number of HT days.
The stronger and more westward WPSH was a decisive cause for the two years of extreme HT events, while both the continental warm high and the distribution and strength of the warm center in the lower troposphere should be considered as important causes. Compared with 2003, the cold air was weaker in the north and the tropical convective systems were stronger in 2013, which led to the WPSH locating farther north and a different convective activity on the edge of the WPSH. As a result, obvious HT differences were observed in the two years.
The WPSH anomaly was caused by the combined effect of multiple systems, such as weaker cold air from the north under an AO positive-phase background, a more active ITCZ, and an obvious warmer SST in the West Pacific.
| 1 |
|
| 2 |
|
| 3 |
|
| 4 |
|
| 5 |
|
| 6 |
|
| 7 |
|
| 8 |
|
| 9 |
|
| 10 |
|
| 11 |
|
| 12 |
|
| 13 |
|
| 14 |
|
| 15 |
|
| 16 |
|
| 17 |
|
| 18 |
|
| 19 |
|
| 20 |
|