Cite this Article

WANG Pu-Cai, Georgy S. GOLITSYN, WANG Geng-Chen, Evgeny I. GRECHKO, Vadim S. RAKITIN, Ekaterina V. FOKEEVA, Anatoly V. DZHOLA. Variation Trend and Characteristics of Anthropogenic CO Column Content in the Atmosphere over Beijing and Moscow.
Atmospheric and Oceanic Science Letters, 2014, 7(3): 243-247

Copyright 2014, Editorial office of Atmospheric and Oceanic Science Letters
This is an Open Access article under the terms of CCAL.
Variation Trend and Characteristics of Anthropogenic CO Column Content in the Atmosphere over Beijing and Moscow
1Institute of Atmospheric Physics, Chinese Academy of Sciences, Beijing 100029, China
2А. М. Оbukhov Institute of Atmospheric Physics, Russian Academy of Sciences, Moscow, Russia
Corresponding author: WANG Pu-Cai,
pcwang@mail.iap.ac.cn
1 IntroductionAnthropogenic CO concentration in the atmosphere, particularly over metropolitan regions, is attracting increasing attention from both scientists and policymakers around the world. CO, as an active minor constituent and gas pollutant in the atmosphere, plays an important role in atmospheric chemical processes. A change of CO concentration certainly affects the equilibrium of atmospheric chemical reactions and the balance of atmospheric species, including some pollutants such as ozone. Therefore, measuring atmospheric CO is very significant for the study of climate change and the atmospheric environment.
Determining the CO column content in the atmosphere using a ground-based spectroscopic method has been conducted in Moscow since 1974 and in Beijing since 1992, using identical measuring apparatus and methods.
With the rapid economic growth and fast urbanization during the last 20 years, Beijing has become a very important metropolis in the world. Meanwhile, the territory of Moscow has doubled. As a result, anthropogenic emissions of pollutants into the atmosphere has increased and human activities have been much enhanced in both Beijing and Moscow. Nevertheless, there are general similarities in emission sources in Moscow and Beijing: for example, the dynamic growth of vehicles, which is considered to be a main emission source of CO in large cities ( Duncan et al., 2007)-total vehicles were comparable in 2010; the main industrial enterprises were moved out from urban areas; and the main city power plants were transferred to gas. So in general, the amount and composition of the main emission sources in both megacities are similar. Therefore, a comparative study on the CO variation trend and some of its characteristics is helpful for evaluating the background level of air pollution and the impact of anthropogenic emissions on air quality.
The daily variation characteristics of the CO content in the atmosphere in both Moscow and Beijing have been discussed previously Wang et al., 1998a, b, 2005; Yurganov et al., 2011; Wu et al., 2005). The influence of wind direction and speed on the CO content and on its daily variation behaviors have also been investigated ( Wu et al., 2005; Fokeeva et al., 2007; Yurganov et al., 2011). This paper focuses on studying the difference in the variation trend and characteristics of the CO column content-its anthropogenic part, in particular-between Beijing and Moscow, to try to gain more understanding about the emission sources that cause heavy pollution events.
2 Instruments and methodology2.1 InstrumentsLong-term measurements of the CO column content in the atmosphere in both Beijing and Moscow have been conducted using identical grating infrared spectrometers with a spectral resolution of 0.2 cm-1. The record in Moscow is from time earlier than 1992 to 2012, while in Beijing it is from 1992 to 2012 and mainly during the late autumn and early winter seasons. The CO column content is calculated from the spectral absorption of the solar radiation received at the Earth's surface by CO in the atmosphere in a selected spectral interval. The uncertainty of the measurement and derivation of the atmospheric CO column content is about 5%-7% ( Rakitin et al., 2011). Details of the instruments' specifications and the methodology for deriving the CO content are described in Dianov-Klokov et al. (1989), Wang et al. (1998b), Fokeeva et al. (2007), and Yurganov et al. (2011).
2.2 Anthropogenic CO contentThe most significant issue is to derive the anthropogenic portion (or city emission part) of the CO content, denoted here as Δ U. It is defined as the difference between the measured CO content, U, at the site of study and that of its background site, UB.
Δ U = U - UB.
It can be seen that obtaining the background value of the CO content is vital for deriving the anthropogenic CO content. For Moscow, the rural Zvenigorod observation station (50 km northwest of Moscow, with few habitants and factories) is selected as its background site; while for Beijing, the minimum CO content observed on the cleanest days is used as the CO background value as there is no good background station that is not affected by human activities. Such an approach for determining the UB in Beijing is more reasonable, because the lowest concentration of all polluted species in the atmosphere is observed during the cleanest days and, in that case, the anthropogenic part of CO, Δ U, is close to zero.
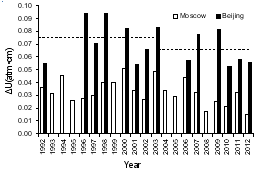
3 Results and discussion3.1 Long-term variation trendThe anthropogenic CO content in the atmosphere, Δ U, in both Beijing and Moscow is derived from the dataset of 1992-2012 and the results are given in Fig. 1. It can be seen that there is an evident decreasing trend of CO city emissions for Moscow from 2003 to 2012 in spite of the continuous increase of vehicles in the city. On average, the rate is decreasing at 1.4% per year. The higher anthropogenic CO contents are observed mainly during the cold season, when a continuous anticyclone takes place, as well as in cases with a low wind speed in the boundary layer or a stagnant synoptic pattern ( Wu et al., 2005; Rakitin et al., 2011). It should be noted that a high anthropogenic part of CO content greater than 0.11 atm·cm is never observed in Moscow during 2008-2012, except for summer 2010, when a natural fire occurred.
In Beijing, meanwhile, conditions influencing the CO content in the atmosphere are more complicated. During the observational period, haze pollution appears quite often on calm days and on days with a weak southern wind. On the pollution days, the CO column content is several times higher than its background level. At the same time, for half the observation days or more, the CO content is close to its background. Statistical analysis shows that the ratio of "dirty days" (Δ U ≥ 0.08 atm·cm) to "clean days" (Δ U ≥ 0.03 atm·cm) is, on average, 1.05 for Beijing and 0.18 for Moscow for the whole observation period of 1992-2012.
An obvious decrease of CO content in Beijing during 1992-2012 can also be seen in Fig. 1. There is no significant trend in anthropogenic CO. However, it can be clearly seen that the CO content decreases from the first period of 1992-2003 to the second period of 2004-2013, as marked by the broken lines in Fig. 1. This behavior corresponds to the other pollutants, such as PM10, in Beijing according to the long-term measurements taken beside the meteorological tower of the Institute of Atmospheric Physics, Chinese Academy of Sciences.
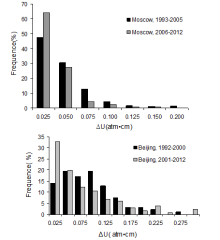
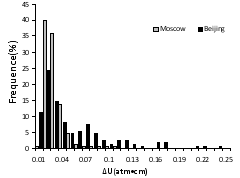
3.2 Frequency distribution of anthropogenic CO contentTo gain more understanding about the variation characteristics of the CO content in the atmosphere in different megacities, the frequency distribution of the anthropogenic part of the CO content (Δ U) in the atmosphere for both Moscow and Beijing are presented in Fig. 2. It can be seen that, for Moscow, the anthropogenic part, Δ U, is smaller than 0.05 atm·cm for more than 80% of the data points; while it is at this level for less than 50% in Beijing. In Moscow, the extreme values of CO content (Δ U ≥ 0.110 atm·cm) are usually observed in the cold season (November to April), and they appear for less than 5% of the whole observation period. For Beijing, meanwhile, Δ U ≥ 0.110 atm·cm for about 20% of the time for the same period. Moreover, another difference in the Δ U frequency distribution between Moscow and Beijing is a second peak at 0.07-0.11 atm·cm for the latter, which is strongly related to air pollution events there.
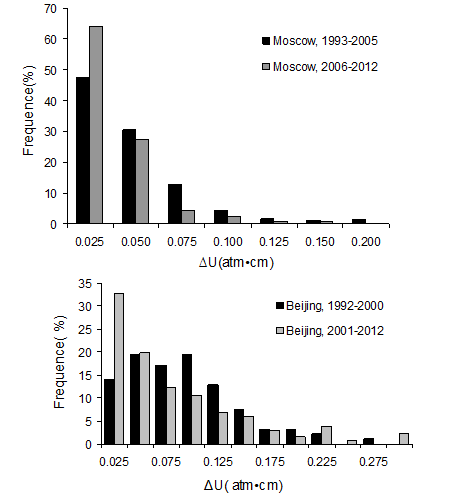
3.3 Anthropogenic CO in different time periodTo discuss the variation properties of CO content in both Moscow and Beijing for different time periods, the frequencies of Δ U for different time periods for both megacities are compared in Fig. 3. It can be seen from the figure for Moscow, that the frequency with high Δ U during 2006-2012 decreases, when compared with that during 1993-2005. Moreover, extreme Δ U (≥ 0.110 atm·cm) do not appear in Moscow since 2008, except for July to August 2010, when natural fires occurred in Moscow's suburban region. A parallel comparison is made for Beijing. It shows that the frequency of higher Δ U ranging from 0.075 to 0.175 atm·cm during 2001-2012 decreases when compared with the frequency during 1992-2000 (Fig. 3), implying that the CO pollution in Beijing has reduced somewhat over the last 10 years.
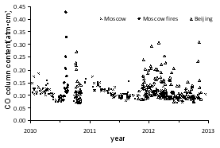
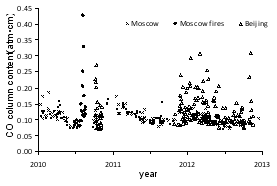
The CO column contents in Beijing and Moscow during recent years are compared in Fig. 4. The prominent feature is the very high CO values up to three times as much as the normal values in the summer of 2010. This corresponds to the severe natural fires in the Moscow region at that time. If 0.2 atm·cm is maintained as a threshold value of CO column content for extreme air pollution situations in Moscow, then it can be seen that such situations are observed quite frequently in Beijing.
3.4 Example of the annual variation of CO column contentThe annual variation of the CO column content in the atmosphere for both Beijing and Moscow during the period of 2010-2012 is presented in Fig. 4, to give a general understanding of the difference between Beijing and Moscow. Four evident features can be found: First, during the whole period, for more than 50% of days the CO column contents in Beijing have the same level as in Moscow. Second, the minimum CO column contents observed during the whole period in Beijing and Moscow is almost same, so it can be treated as their background values. This implies that Beijing and Moscow have the same background value. Third, the extremely high CO column contents imply that air pollution takes place quite frequently in Beijing during all seasons, while in Moscow such extreme CO column contents are rarely observed except for the period of natural fire events mentioned above. Fourth, the CO column content is characterized by a maximum in winter and a minimum in summer for both Beijing and Moscow.
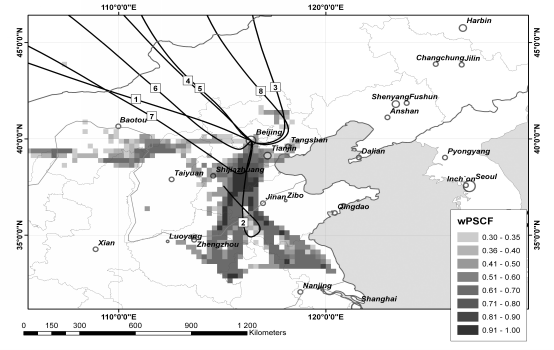
3.5 Anthropogenic emission sourcesAs mentioned above, a high CO concentration in Beijing ( Dianov-Klokov et al., 1989; Wang et al., 1998b; Wu et al., 2005) may not be interpreted only by specific meteorological conditions and CO emission in the city region; there should be a reasonable difference in pollution sources between Moscow and Beijing. To better understand the possible anthropogenic emission sources in both Beijing and the surrounding area that influence the air pollution state in Beijing, the potential source contribution function (PSCF) method with the Hybrid Single-Particle Lagrangian Integrated Trajectory Model (www.arl. noaa.gov/ready) is used to determine the back trajectory of pollutants in Beijing. The meteorological field of Global Data Assimilation System (GDAS) with a spatial resolution of 1° × 1° and a temporal resolution of three hours is used. The results are presented in Fig. 5, where the darkness of each grid represents the probability of pollution sources. The darker the grid, the higher the probability. It can be seen that many darker grids appear to the south of Beijing within 500 km, implying frequently severe air pollution. A statistical analysis for the quantitative estimation of the pollution contribution is made for each trajectory and shown in Fig. 6. Heavy pollution cases with Msa ≥ 300 μg m-3 are presented in Table 1, where Msa is the mass concentration of submicron aerosol. It can be seen that in all 413 heavy air pollution cases in Beijing, more than 80% can be attributed to trajectories 1, 2, and 7, of which trajectories 2 and 7 (mainly anthropogenic emission sources) account for about 48%. This implies that emission sources in the surrounding areas, particularly areas to the south, are responsible for heavy air pollution in Beijing, and the second peak in frequency distribution in Fig. 2 can be well explained here.
Table 1
Table 1
 Table 1 Statistics for heavy pollution cases ( Msa ≥ 300 μg m-3).| Number | Total number of trajectories | Average Msa |
|---|
| 1 | 136 | 482.04 | | 2 | 120 | 638.56 | | 3 | 41 | 392.67 | | 4 | 5 | 402.20 | | 5 | 0 | 0.00 | | 6 | 32 | 388.22 | | 7 | 78 | 451.03 | | 8 | 1 | 393.85 | | Total | 413 | 504.34 |
| Table 1 Statistics for heavy pollution cases ( Msa ≥ 300 μg m-3). |
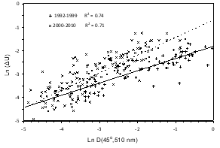
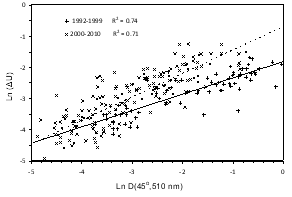
For Beijing, haze events with a very high concentration of the submicron aerosol are mostly responsible for air pollution. We can see in Fig. 6 that Δ U and D (45°, 510 nm), which measures the scattering intensity at an angle of 45° and 510 nm by the ground submicron aerosol, are positive correlated, indicating that a high CO concentration appears simultaneously in haze events when it is contributed mainly by both local and regional emission sources. Moreover, an obvious difference in the slope of the correlation regression line can be found for the period before and after 2000. This indicates a change in the features of anthropogenic pollution sources in Beijing and the surrounding area for the last ten years.
4 ConclusionsA decreasing trend of CO content in the atmosphere was observed in Moscow during 1992-2012, particularly in the last 10 years; while in Beijing, a small decrease in CO content appears during 2001-2012 compared to that in 1992-2000. Such a variation trend of the CO content in Beijing can be attributed to specific meteorological and topographic conditions as well as anthropogenic emission sources in the surrounding areas. This CO variation trend is consistent with that of SO2 ( Lin et al., 2012), implying that the CO and SO2, at least partly, come from the same emission sources.
High anthropogenic CO content in Beijing appears several times more frequently than in Moscow. The average anthropogenic CO content in the atmosphere in Beijing for 2008-2012 is as high as 0.065 atm·cm. Such a high anthropogenic CO content is recorded in Moscow only in the summer of 2010 because of natural fire events in the region.
The CO column content in the atmosphere is closely related to the fine particle concentration. Moreover, the correlation is stronger in Beijing than in Moscow.
One of the most obvious differences in CO variation features in Moscow and Beijing is that, for Moscow, the CO content in the atmosphere is contributed by anthropogenic CO emission sources (e.g., vehicles, power plants) mainly in the city district; while for Beijing, a considerable contribution comes from the emission sources in areas to the south and southwest of the city.


 , Evgeny I. GRECHKO