
Revisiting Asymmetry for the Decaying Phases of El Niño and La Niña
Cite this Article
CHEN Wei, LU Ri-Yu, Buwen DONG. Revisiting Asymmetry for the Decaying Phases of El Niño and La Niña. Atmospheric and Oceanic Science Letters, 2014, 7(4): 275-278 
Permissions
Copyright?2014, Editorial office of Atmospheric and Oceanic Science Letters
This is an Open Access article under the terms of CCAL.
Revisiting Asymmetry for the Decaying Phases of El Niño and La Niña
Abstract
This study investigated the relationship between the asymmetry in the duration of El Niño and La Niña and the length of their decaying phases. The results suggested that the duration asymmetry comes from the long decaying ENSO cases rather than the short decaying ones. The evolutions of short decaying El Niño and La Niña are approximately a mirror image with a rapid decline in the following summer for the warm and cold events. However, a robust asymmetry was found in long decaying cases, with a prolonged and re-intensified La Niña in the following winter. The asymmetry for long decaying cases starts from the westward extension of the zonal wind anomalies in a mature winter, and is further contributed to by the air-sea interaction over the tropical Pacific in the following seasons.
Keyword:
ENSO; asymmetry; duration; decaying phase
1 Introduction
El Niño and La Niña exhibit significant asymmetry in their amplitude and spatial structure. The sea surface tem-perature (SST) anomaly has large positive skewness over the eastern equatorial Pacific, indicating that the SST ano-malies related to El Niño are larger in magnitude than those related to La Niña ( Burgers and Stephenson, 1999; An and Jin, 2004; An et al., 2005). Hoerling et al. (1997) pointed out that the associated atmospheric deep convection anomalies are displaced eastward during El Niño com-pared to La Niña, due to the nonlinear atmospheric response to SST anomalies. Moreover, the associated zonal shift in surface wind anomalies, in turn, contributes to the strong positive SST anomalies in the eastern Pacific during El Niño ( Kang and Kug, 2002). In addition, Jin et al. (2003) illustrated that the nonlinear thermal advection processes by ocean currents can generate the larger amplitude of El Niño compared to La Niña.
Recent studies have noted the asymmetry in the duration of El Niño and La Niña. According to observed records, McPhaden and Zhang (2009) showed that La Niña tends to persist into the second year and re-intensify in winter. Kessler (2002) pointed out that the transitions from La Niña to El Niño are slower than those from El Niño to La Niña. Okumura and Deser (2010) demonstrated that this asymmetry in the duration of El Niño and La Niña has been a robust feature of ENSO throughout the past century. After a mature winter, El Niño tends to decay rapidly in the following summer, but many La Niña events persist through the following year and tend to develop into another La Niña event in the subsequent winter. Based on both observations and model results, Choi et al. (2013) also suggested an asymmetry of ENSO temporal evolutions. Strong warm events are more likely to be followed by cold events, and cold events are more persistent than warm events.
The asymmetry of ENSO duration can be attributed to the associated surface wind anomalies, which are nonlinear with respect to the sign of Indo-Pacific SST anomalies ( Ohba and Ueda, 2009; Ohba and Watanabe, 2010; Okumura et al., 2011). Okumura and Deser (2010) demonstrated that the anomalous westerly winds during El Niño begin to weaken over the far western Pacific before the mature phase, and the anomalous easterly winds continue to develop in the decaying year, leading to a rapid decline of El Niño. In contrast, the easterly anomalies over the western Pacific persist into the second year, which leads to the prolongation of La Niña. In addition, some model results suggested that the asymmetric evolution of surface wind anomalies around the mature phase of El Niño and La Niña can be reproduced when forced with Indo-Pacific SST anomalies ( Ohba and Ueda, 2009; Okumura et al., 2011), suggesting the importance of nonlinear atmosph-eric processes for the asymmetric evolution of El Niño and La Niña.
Although the decaying phases of El Niño are generally shorter than those for La Niña, both warm and cold events have short and long decaying cases when El Niño and La Niña events are considered separately. Chen et al. (2012) suggested that the lengths of El Niño decaying phases vary from case to case. The long decaying El Niño cases can persist into the next winter, but the short decaying cases terminate in the following summer. Li et al. (2007) also indicated that a rapid decaying follows strong El Niño while a slow decaying follows moderate El Niño.
Previous studies have focused on the asymmetry of duration for all ENSO events, which mixes the short and long decaying cases. The difference between the asymmetry of short decaying cases and long decaying cases, however, has been ignored. Thus, in this study, we first investigated the variation in the persistence of La Niña decaying phases, and then attempted to explore the relationship between the asymmetry of El Niño and La Niña durations and the length of their decaying phases by using observed records. The remainder of the paper is organized as follows. Section 2 introduces the datasets used in the study. Section 3 describes the results, and a summary follows in section 4.
2 Datasets
The datasets used in this study include the Hadley Centre Sea Ice and Sea Surface Temperature dataset ( Had-ISST; Rayner et al., 2003) for 1948-2008, 850-hPa wind from monthly mean National Centers for Environmental Prediction/National Center for Atmospheric Research (NECP/NCAR) reanalysis data for the same period ( Kalnay et al., 1996), and precipitation from the Climate Prediction Center Merged Analysis of Precipitation (CMAP) for 1979-2008 ( Xie and Arkin, 1996). It is worth pointing out that similar results were obtained using the data after removing the linear trend in SSTs (not shown).
El Niño and La Niña were defined in this study as the DJF (December-January-February) mean Niño 3 index (def-ined as the regional average over (5°S-5°N, 90°W-150°W)) being above 0.8 standard deviation and below -0.8 standard deviation from the time mean, respectively. Under this criterion, 10 El Niño and 12 La Niña events were chosen from the observations. The winters corresponding to the selected ENSO events were designated as D(0)JF(1), and the years preceding and following these events as Year(0) and Year(1).
In order to separate the different lengths of decaying phases, the El Niño events with a JJA (June-July-August) (1) Niño 3 index less (greater) than 0°C were classified as the short (long) decaying cases, following Chen et al. (2012). The same criterion was also applied for the La Niña events, but with the opposite sign. These classifications of short and long decaying cases for the ENSO eve-nts are shown in Table 1. It should be mentioned that there were six short decaying La Niña cases which declined rapidly and terminated in JJA(1), rather than lasting to the next winter. This means that the length of La Niña decaying phases also has individual variation. In addition, among the El Niño cases after 1979, all the three long decaying cases belonged to El Niño, and two out of three short decaying cases belonged to El Niño Modoki, according to the criterion of Li et al. (2010). However, due to the lack of samples in observations, we do not discuss the difference between El Niño and El Niño Modoki in this study.
3 Results
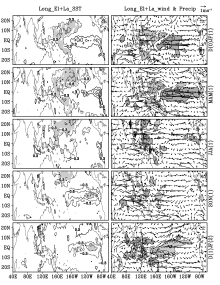
Figure 1 shows the time evolutions of Niño 3 index for the composite short decaying El Niño and La Niña events, as well as for the individual years that comprise the composites. The composite short decaying El Niño and La Niña are basically symmetrical in their temporal evolutions. In the preceding Year(0), they both occur in MAM (March-April-May) (0), develop in JJA(0), and reach a peak in D(0)JF(1). Furthermore, in the following Year(1), they both decline rapidly and terminate in JJA(1). Thus, the composite warm and cold events have similar temporal evolutions but opposite signs from developing to decaying phases. This indicates a symmetry in the duration of short decaying El Niño and La Niña. In addition, for the individual cases, a strong El Niño (La Niña) tends to be followed by a La Niña (El Niño) in the subsequent winter, such as the 1972/73 and 1997/98 El Niño events and the 1975/76 La Niña.
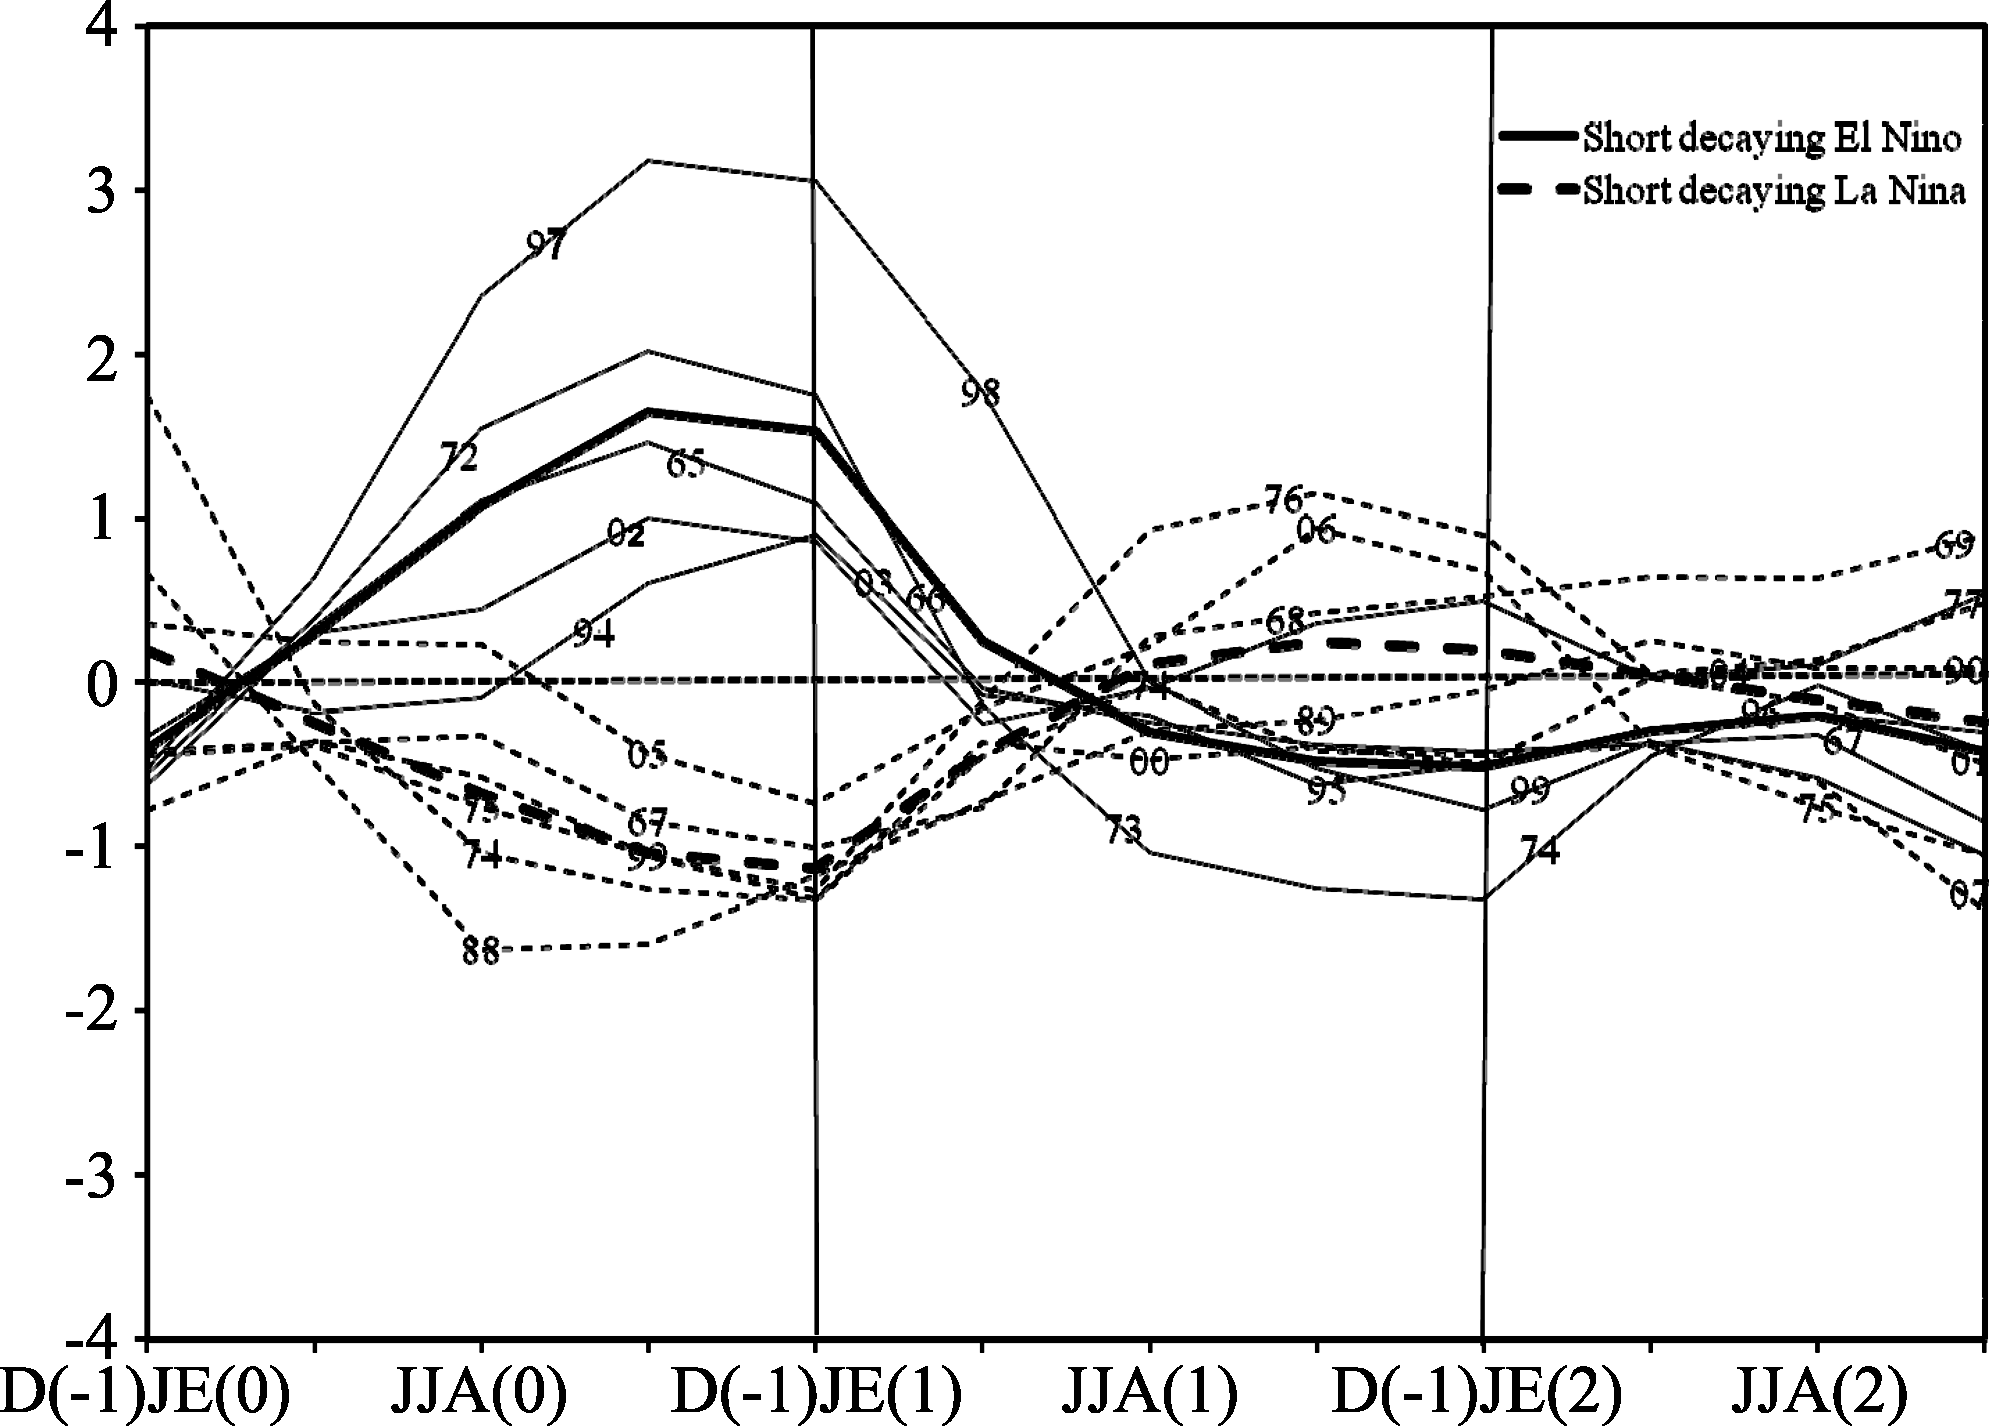
The asymmetry in the duration of El Niño and La Niña is contributed to by the long decaying cases. Figure 2 shows the time evolutions for the long decaying El Niño and La Niña events and their composites. A robust asymmetry can be seen in the duration of long decaying El Niño and La Niña. In the composite long decaying ElNiño, the Niño 3 index keeps declining, and becomes very small in D(1)JF(2). In the composite of the long decaying La Niña, however, the negative value persists and re-intensifies in SON (September-October-November) (1) and D(1)JF(2). In particular, the 1954/55 and 1998/99 ca-ses are followed by La Niña events (1955/56, 1999/2000) due to the re-intensification of cold phases. This is consistent with the prolongation of La Niña suggested in previous studies (e.g., McPhaden and Zhang, 2009; Okumura and Deser, 2010). It should be mentioned that the re-int-ensification of the cold phase for the La Niña composite also existed when the 1954/55 cases with a strong negative value in Year(1) was removed (not shown).
| Table 1 Short and long decaying ENSO cases according to HadISST for 1948-2008. |
 | Figure 1 Time evolutions of Niño 3 index for composite short decaying El Niño (thick solid line) and La Niña (thick dashed line) and for individual cases (thin lines). The numbers marked on the lines represent the year for each case. |
 | Figure 2 Time evolutions of Niño 3 index for composite long decaying El Niño (thick solid line) and La Niña (thick dashed line) and for individual cases (thin lines). The numbers marked on the lines represent the year for each case. |
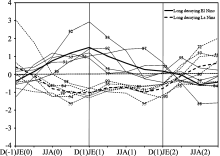
The composites of El Niño and La Niña were respectively calculated, allowing us to examine the sum of the El Niño and La Niña composites in the following, to further investigate the asymmetry of ENSO duration. Figure 3 shows the spatial distribution for the composite evolution of SST, 850-hPa wind, and precipitation anomalies during the short decaying phase ( the precipitation anomalies comprise the cases after 1979). The weak and less significant SST anomalies indicate a weak asymmetry between short decaying El Niño and La Niña cases. In D(0)JF(1), the positive SST anomaly over the eastern tropical Pacific leads to a stronger wintertime amplitude of El Niño compared to La Niña, but these anomalies are restricted to the east of 120°W. In the following spring and summer, however, the positive SST anomalies disappear, and there are only a few scattered anomalies over the tropical Pacific. In JJA(1), there is warm SST over the Indian Ocean and Maritime Continent, but it is caused by only one case. This warm SST can be much weaker when the 1997/98 El Niño is removed. Thus, the asymmetry for the duration of short decaying El Niño and La Niña is very weak, and their decaying phases are approximately a mirror image.
The associated precipitation and lower-tropospheric wind anomalies are dynamically consistent with the weak asymmetry in duration of the short decaying El Niño and La Niña. The westerly anomalies to the east of the dateline are related to positive SST anomalies over the eastern tropical Pacific in D(0)JF(1). These persistent westerly anomalies in MAM(1), coupled with the easterly anomalies to the west of the dateline, induce an anomalous lower-tropospheric divergence and suppress precipitation over the tropical central Pacific. This negative precipitation anomaly, in turn, favors the persistence of the westerly anomaly over the eastern tropical Pacific. Moreover, this westerly anomaly is maintained into JJA(1) and results in a rapid decline of La Niña.
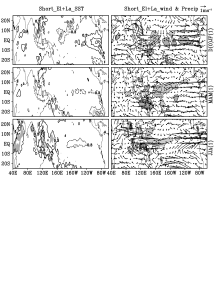
Figure 4 shows the same composite in the sum of the long decaying El Niño and La Niña. The SST anomalies during the long decaying phase are much stronger and significant than those for the short decaying cases, which suggests a strong asymmetry in the duration of the long decaying El Niño and La Niña cases. During the mature winter, the positive SST anomalies in the central and eastern tropical Pacific and the negative ones in the western Pacific suggest a stronger wintertime amplitude of long decaying El Niño compared with La Niña. In addition, the positive SST anomalies extend farther westward relative to the short decaying cases. In MAM(1) and JJA(1), these positive SST anomalies decline. In the following autumn and winter, negative SST anomalies occur and persist over the central and eastern tropical Pacific, indicating a stronger persistence of La Niña in the next year than that of El Niño. These results further suggest the asymmetry in the duration of long decaying El Niño and La Niña, exhibiting as a slowly declining El Niño versus a prolonged and re-intensified La Niña.
 | Figure 3 Spatial distributions for the composite evolution of SST (°C, left panel), 850-hPa wind (m s-1, vectors in right panel), and precipitation (mm d-1, contour in right panel) anomalies for the short decaying cases. Shading in the left panel represents the differences significant at the 95% confidence level according to the t-test. Shading in the right panel represents the composite precipitation anomalies above 2 mm d-1 (dark shading) or below -2 mm d-1 (light shading). |
 | Figure 4 Spatial distributions for the composite evolution of SST (°C, left panel), 850-hPa wind (m s-1, vectors in right panel), and precipitation (mm d-1, contour in right panel) anomalies for the long decaying cases. Shading in the left panel represents the differences significant at the 95% confidence level according to the t-test. Shading in the right panel represents the composite precipitation anomalies above 2 mm d-1 (dark shading) or below -2 mm d-1 (light shading). |
The sums of precipitation and lower-tropospheric wind for long decaying cases also show different evolutions and spatial patterns compared with those for short decaying cases. During D(0)JF(1), the westerly anomalies in the equatorial Pacific extend westward by 20° in longitude to 160°E compared with the short decaying cases, which is consistent with the westward extension of positive SST anomalies. In MAM(1), these positive SST and westerly anomalies are associated with positive precipitation anomalies in the central and eastern tropical Pacific. The positive precipitation anomalies weaken in JJA(1), as do the westerly anomalies. Easterly anomalies occur over the central tropical Pacific in SON(1) with negative SST anomalies over the central and eastern tropical Pacific, and they persist into D(1)JF(2). These anomalous easterly winds coincide with the termination of positive SST anomalies, which increases local upwelling and enhances upward turbulent heat fluxes. These in turn are conducive to the development of negative SST anomalies, suggesting the role of coupled air-sea interactions in the asymmetric evolutions for long decaying El Niño and La Niña events.
4 Conclusions
This study investigated the relationship between the asymmetry in the duration of ENSO cases and the length of their decaying phases by using observed records. It was found that the time evolutions for short decaying El Niño and La Niña are basically symmetric, with a rapid decline in summer. The symmetry in the duration of short decaying cases was further indicated by the weak and less significant SST anomalies in the sum of El Niño and La Niña composites. In contrast, the evolutions for the long decaying cases are remarkably asymmetric. Long decaying El Niño disappears in the following winter, although it declines slowly. On the other hand, long decaying La Niña persists into the following year and re-intensifies in winter. Thus, the asymmetry in the duration is contributed to by the long decaying ENSO cases rather than the short ones.
The strong asymmetry in the duration of long decaying El Niño and La Niña exhibits as a prolongation and re-intensification of negative SST anomalies for La Niña in the following year. The evolution of SST and circulation anomalies associated with the asymmetry can be summarized as follows. In D(0)JF(1), the westerly anom-alies extend to the west of the dateline. These westerly and positive SST anomalies over the central and eastern tropical Pacific are associated with the positive precipitation anomalies locally, which induce the easterly anomalies in JJA(1). Moreover, these easterly anomalies persist into the following autumn and winter and help to maintain the cold SST in the central tropical Pacific for long decaying La Niña by increasing the local upwelling and by enhancing upward turbulent heat fluxes.
The present results illustrate the role of air-sea interactions over the tropical Pacific in the asymmetry of ENSO duration, but the impact of the Indian Ocean SST, as suggested in previous studies (e.g., Ohba and Watanabe, 2010; Okumura and Deser, 2010), is very weak. This might be due to the lack of samples in observations. Thus, the mechanism proposed in this study deserves to be further studied using model experiments.
Acknowledgments. This study was supported by the National Natural Science Foundation of China (Grant No. 41105046). The authors thank the two anonymous reviewers for their valuable comments.
Reference
| 1 |
|
| 2 |
|
| 3 |
|
| 4 |
|
| 5 |
|
| 6 |
|
| 7 |
|
| 8 |
|
| 9 |
|
| 10 |
|
| 11 |
|
| 12 |
|
| 13 |
|
| 14 |
|
| 15 |
|
| 16 |
|
| 17 |
|
| 18 |
|
| 19 |
|