

Results of a CLM4 Land Surface Simulation over China Using a Multisource Integrated Land Cover Dataset
Cite this Article
YU Yan, XIE Zheng-Hui, WANG Yuan-Yuan, CHEN Feng. Results of a CLM4 Land Surface Simulation over China Using a Multisource Integrated Land Cover Dataset. Atmospheric and Oceanic Science Letters, 2014, 7(4): 279-285 
Permissions
Copyright?2014, Editorial office of Atmospheric and Oceanic Science Letters
This is an Open Access article under the terms of CCAL.
Results of a CLM4 Land Surface Simulation over China Using a Multisource Integrated Land Cover Dataset
Abstract
In this study, the high-accuracy multisource integrated Chinese land cover (MICLCover) dataset was used in version 4 of the Community Land Model (CLM4) to assess how the new land cover information affected land surface simulation over China. Compared to the default land cover dataset in CLM4, the MICL data indicated lower values for bare soil (14.6% reduction), needleleaf tree (3.6%), and broadleaf tree (1.9%); higher values for shrub cover (1.8% increase), grassland (9.9%), cropland (5.0%), glaciers (0.5%), lakes (1.6%), and wetland (1.1%); and unchanged for urban areas. Two comparative CLM4 simulations were conducted for the 33-yr period from 1972 to 2004, one using the MICL dataset and the other using the default dataset. The results revealed that the MICL data produced a 0.3% lower mean annual surface albedo over China than the original data. The largest contributor to the reduced value was semiarid regions (2.1% reduction). The MICL-data albedo value agreed more closely with observations (MODIS broadband black-sky albedo products) over arid and semiarid regions than for the original data to some extent. The simulated average sensible heat flux over China increased by only 0.1 W m-2 owing to the reduced values in arid and semiarid regions, as opposed to increases in humid and semihumid regions, while an increased latent heat flux of 1 W m-2 was reflected in almost identical changes over the whole region. In addition, the mean annual runoff simulated by CLM4 using MICL data decreased by 6.8 mm yr-1, primarily due to large simulated decreases in humid regions.
Keyword:
land cover; MICLCover; MODIS; land surface simulation; CLM4
1 Introduction
Land cover, considered as an essential component of climate systems, plays a critical role in land-atmosphere interactions. Its impact on the energy budget, water cycle, and biochemical composition in a given area is reflected in surface albedo, roughness, and soil water and thermal characteristics. Because many parameters in land surface models are defined on the basis of land cover types, an accurate land cover description is fundamental for land surface simulation ( Sellers et al., 1997).
Many studies investigating the importance of realistically delineating land surface information in land surface and climate simulations (e.g., Tian et al., 2004a, b; Lawrence and Chase, 2007; Gao et al., 2008; Gao and Jia, 2013) have demonstrated the complex relationships between land cover, water, and energy balance, and overlying atmospheric processes. However, common land cover maps based on satellite-derived remote sensing data are inconsistent, especially in Asia, and do not provide accurate land cover information for land surface and climate modeling for China ( McCallum et al., 2006; Chen and Xie, 2009; Ran et al., 2010; Gao and Jia, 2012). It follows that it is necessary to collect high-quality land cover data to reduce these uncertainties in land surface simulation for China.
In this study, we employed the high-accuracy multisource integrated Chinese land cover dataset (MICLCover) developed by Ran et al. (2012), which combines multisource data based on the Dempster-Shafer evidence theory, in the Community Land Model version 4 (CLM4) to assess how these land cover parameters affect land surface simulation over China. In CLM4, plant functional types are derived from MODIS (MODerate resolution Imaging Spectroradiometer) satellite data, while glaciers, lakes, wetlands, and urban areas are obtained from various other sources. Hereafter, the default land cover data in CLM4 is simply denoted as MODIS. Two 33-yr simulations (1972-2004) using MICL data and MODIS land cover data were conducted for China.
2 Comparison between MICL and MODIS land cover data
Based on the Dempster-Shafer theory, Ran et al. (2012) developed an MICLCover map using the International Geosphere-Biosphere Program (IGBP) classification system by combining the Vegetation Atlas of China (1:1000000) ( Hou et al., 2001), a land use map of China (1:100000) for the year 2000 ( Liu et al., 2002), a glacier distribution map of China (1:100000) ( Wu and Li, 2004), a swamp-wetland map of China (1:1000000) ( Zhang, 2002), and the MODIS product for 2001 (MODIS2001) ( Friedl et al., 2002). The map was further developed to show 1-km resolution glacier, lake, wetland, and urban land use, and 16 plant functional types consistent with the classifications in the Community Land Model (downloadable from the Cold and Arid Regions Science Data Center:http://westdc.westgis.ac.cn/data/). We scaled the MICLCover map up from 1 km to 0.5° by means of area-weighted averages, and then extracted the ratios of the areas of glacier, lake, wetland, and urban land use and the 16 plant functional types from the MICLCover map. In CLM4, the default plant functional types were based on MODIS satellite data ( Lawrence and Chase, 2007) from November 2000 to October 2001 (the MODIS2001 product, mentioned above); glaciers were obtained from the IGBP Data and Information System Global 1-km Land Cover Data Set (IGBP DISCover) ( Loveland et al., 2000); lake and wetland percentages were derived from 1°×1° data for perennial freshwater lakes and swamps/marshes ( Cogley, 1991); and urban areas were derived from a population density dataset, LandScan 2004 ( Dobson et al., 2000).
Comparisons of area percentages of plant functional types between MICL data and MODIS data for six broad categories of plant functional types are shown in Fig. 1. According to the mean annual precipitation ( Pmean), we divided China into four climate zones: arid region ( Pmean≤ 200 mm); semiarid region (200 mm < Pmean≤ 400 mm); semihumid region (400 mm < Pmean ≤ 800 mm); and humid region ( Pmean > 800 mm)
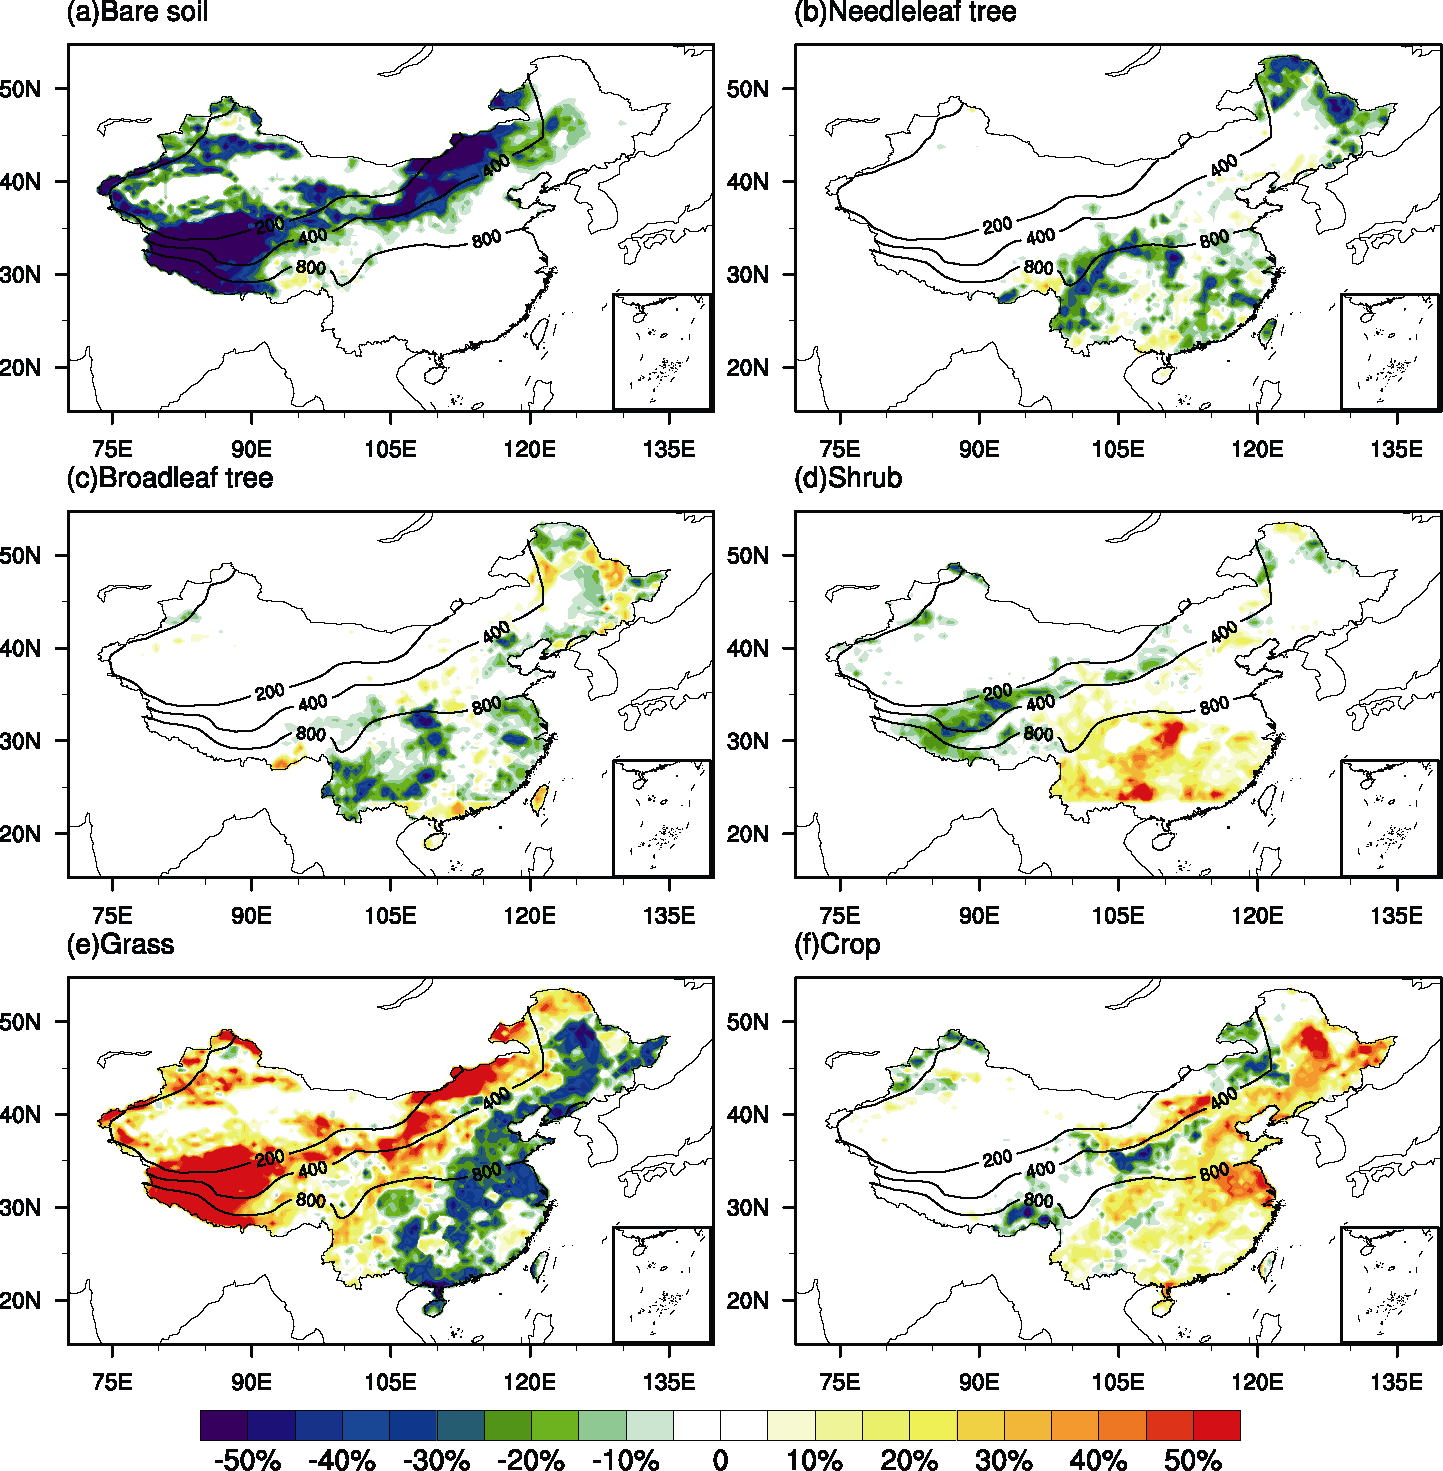 | Figure 1 Percentage differences in area of plant functional types between MICL (Multisource Integrated Chinese Land cover) data and MODIS (MODerate resolution Imaging Spectroradiometer) data in China at 0.5° grid resolution. Isolines refer to the mean annual precipitation (mm yr-1). |
| Table 1 Differences of area percentage of land cover types between MICL data and MODIS data in China overall, and in arid, semiarid, semihumid, and humid climate sub-regions in China. |
3 Model description and experimental design
The Community Land Model version 4.0 ( Lawrence et al., 2011) (CLM4SP, where SP = satellite phenology) was employed in this study. CLM4 is an extensive update of the previous CLM version 3.5, incorporating changes to the model structure and parameterizations, including soil hydrological and thermal processes, a revised snow model, an added urban canyon model, a carbon-nitrogen cycle modeling capability, and transient land cover changes, among other modifications.
Two integration experiments were conducted at 0.5° resolution to explore the use of MICL data on a land surface simulation over China: (1) a control run (MODIS) with default land cover data; and (2) a comparative run (MICL) with MICL data. Besides the differences in land cover data for the two experiments, other land surface information and model settings were exactly the same. Atmospheric forcing data from Qian et al. (2006) for 1972-2004 circularly forced CLM4 three times. Altogether, the experiments covered a 99-yr period, of which the first 66-yr simulation period was regarded as spin-up. The results for the final 33 years (1972-2004) were used for the following analysis.
4 Results
4.1 Surface albedo
Figure 2 shows the spatial distributions of the mean simulated annual surface albedo for the MODIS run and the MICL run. The differences between the results for each dataset and the MODIS broadband black-sky albedo products for 2001-2004 ( Moody et al., 2005) and the differences between the MICL run and the MODIS run are also shown. Besides, the difference of land surface temperature between the MICL and MODIS runs is shown in the last panel. The detailed statistical results for the mean seasonal and annual surface albedo over sub-regions and the whole region are listed in Table 2. The spatial patterns of the simulated surface albedo are very similar, both being characterized by a northwest-southeast gradient (Figs. 2a and 2b). Although both runs overestimated surface albedo over most areas of China, the MICL run produced improvements for Inner Mongolia, the western Tibetan Plateau, and mountainous areas in northwestern China, essentially due to large decreases in the area of bare soil in those regions. Also, the surface albedo was found to have increased in northeastern China as a result of grassland replacing needleleaf and broadleaf trees over Daxing'anling, crops replacing grassland in the Sanjiang Plain, and broadleaf forest replacing needleleaf trees over Xiaoxing'anling. Table 2 shows a simulated mean annual surface albedo decrease by 0.3% over the whole region, with the largest contribution being from semiarid regions. Implementing MICL data in CLM4 reduced the simulated surface albedo over arid and semiarid regions for all seasons, especially for summer (June, July, and August), and was more consistent with observed values, with the greatest decrease (-2.7%) shown to occur in summer over semiarid land. In addition, relatively small changes were found over humid and semihumid regions in all seasons, with the exception of autumn (September, October, and November) in semihumid areas. Significantly reduced surface albedo over Inner Mongolia and the western Tibetan Plateau led to more absorbed solar radiation in the MICL run, which could be one reason for the increased land surface temperature (Fig. 2f). A reduced number of trees over the eastern humid region resulted in an increased land surface temperature (Figs. 1b and 1c).
4.2 Sensible and latent heat flux
Changes in surface albedo directly affect the absorption of solar radiation, with the greatest impact being on the proportions of sensible heat flux and latent heat flux.
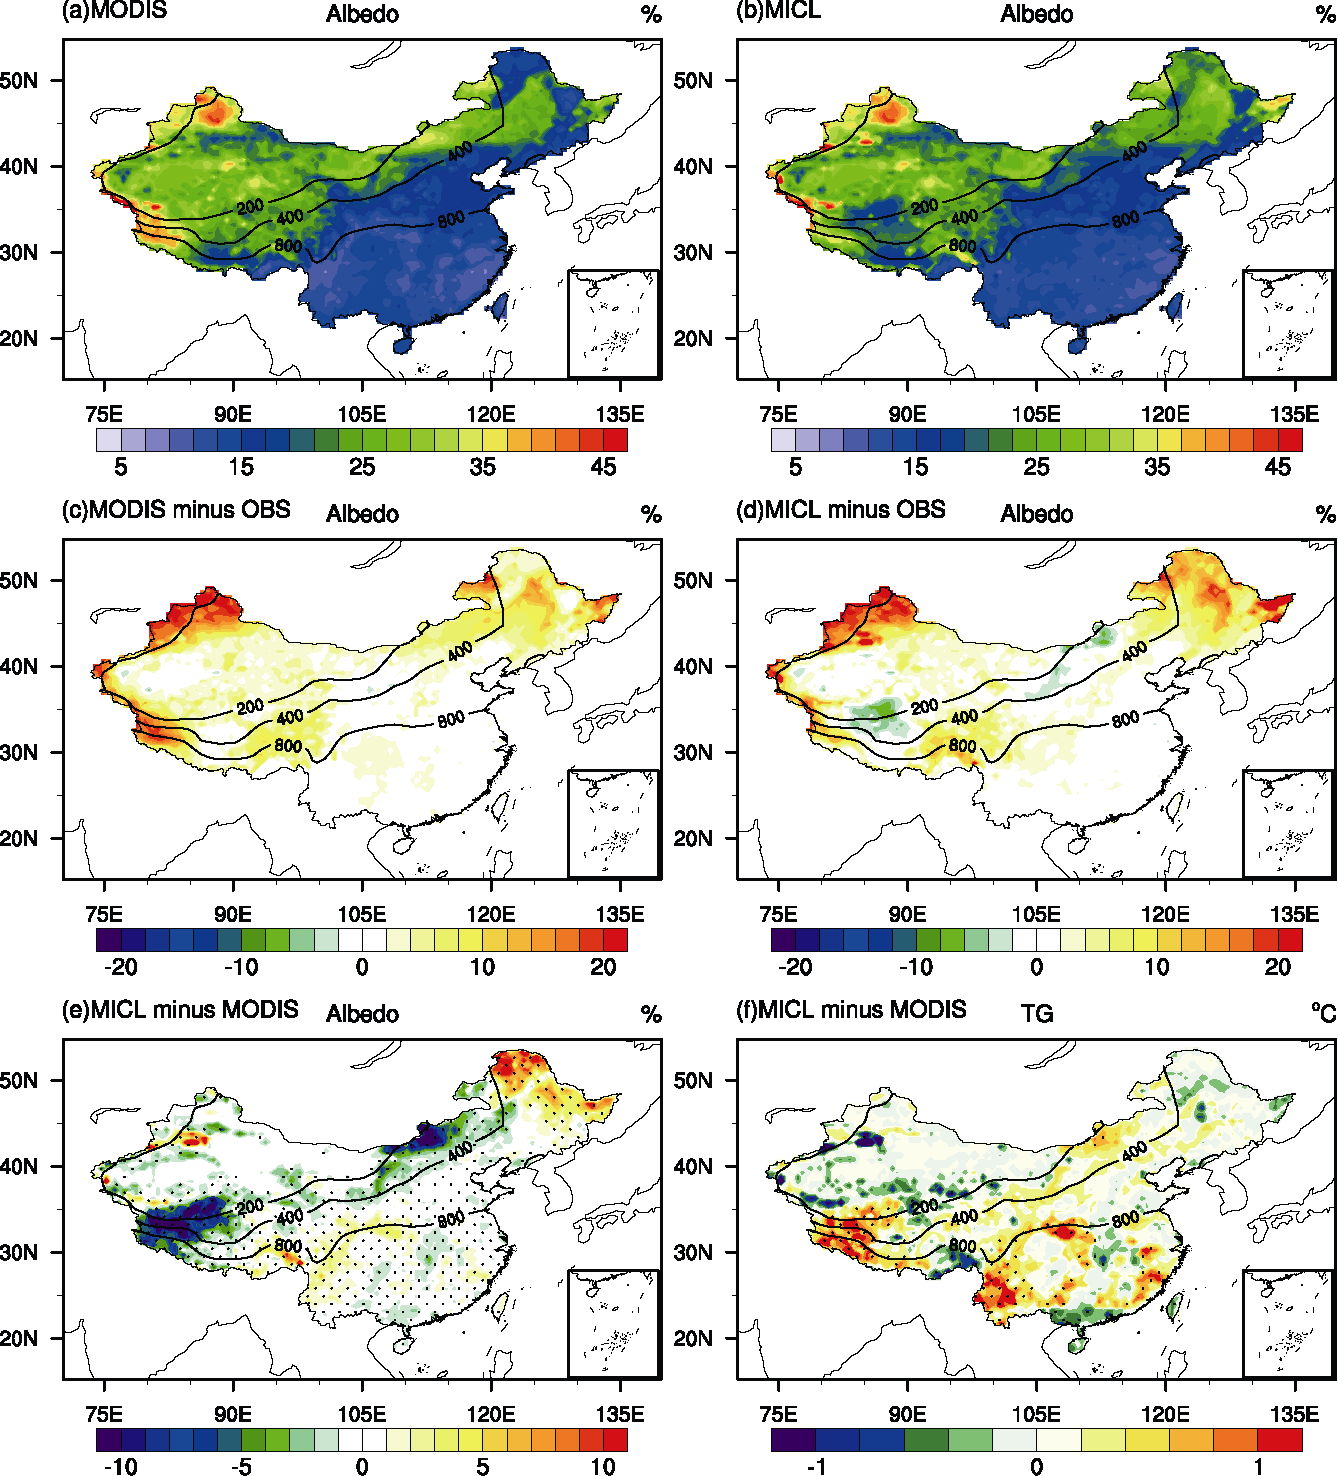 | Figure 2 Mean annual spatial distributions for (a) surface albedo simulated by the MODIS run and (b) by the MICL run; (c) differences of surface albedo between MODIS and OBS; (d) differences of surface albedo between MICL and OBS; (e) differences of surface albedo between MICL and MODIS; and (f) differences of land surface temperature between MICL and MODIS. Differences in (e, f) with confidence level greater than 95% are stippled. |
| Table 2 Seasonal and annual surface albedo (%) simulated by the MODIS run (MO) and the MICL run (MI), and differences between the two runs (MI-MO). Differences between each run and observation are in brackets. |
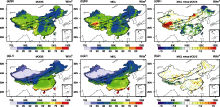
Figure 3 displays the spatial pattern of mean annual sensible and latent heat flux, and the differences between the results for the MODIS and MICL datasets. The sensible heat flux greatly increased in areas where the surface albedo decreased by a large amount, resulting in a greater absorption of shortwave radiation on such surfaces (Fig. 3c). Sensible heat flux was reduced in northeastern and southern China to different extents. The latent heat flux increased over the whole region, except in the southern Tibetan Plateau. Simulated local changes in sensible heat flux (>15 W m-2) were higher than for latent heat flux. The mean seasonal and annual heat fluxes for each sub-region are shown in Table 3. The sensible heat flux increased in all seasons over arid and semiarid regions, especially in summer across semiarid regions, when the increase was 4.5 W m-2, but these tended to be balanced by decreases up to about 3 W m-2 for all seasons in humid and semihumid regions, so that the mean annual sensible heat flux averaged over China did not change significantly (0.1 W m-2). The latent heat flux increased generally in all seasons across all sub-regions, leading to an increase of 1 W m-2 in the mean annual value for the whole of China.
4.3 Runoff
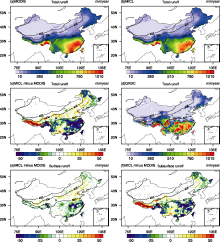
Figure 4 shows simulated total runoff using MICL data and MODIS data, and the differences of total runoff, surface runoff, and subsurface runoff between the two runs, and also using data from the Global Runoff Data Centre (GRDC) ( Fekete et al., 2000). The spatial distributions of runoff simulated by MICL and MODIS data coincided with that from the GRDC data, all showing a distinct northwest-southeast gradient over China (Figs. 4a, 4b, and 4d). The MICL run simulated less runoff over southern China, Daxing'anling, Xiaoxing'anling, and the Sanjiang Plain over northeastern China, with local decreases of up to 100 mm yr-1. Compared to surface runoff, changes in subsurface runoff made the greater contribution to changes in total runoff (Figs. 4e and 4f). Increased runoff was displayed mainly in the northeastern plains and the southern Tibetan Plateau. Small but statistically significant changes were shown for semiarid regions. Table 4 lists the detailed results for each sub-region for the four seasons. A slightly higher runoff was simulated using MICL data for all seasons in arid and semiarid regions. The mean annual runoff averaged over semihumid regions remained unchanged due to the balancing effect of the opposite changes during summer and autumn. Relatively large changes were shown for humid regions, with decreased runoff in all seasons, the largest reduction being 37.2 mm yr-1 in summer. In summary, the mean simulated annual runoff for all of China decreased by 6.8 mm yr-1, consisting of decreased surface runoff by 2.6 mm yr-1 and decreased subsurface runoff by 4.2 mm yr-1, with the humid areas making the greatest contribution.
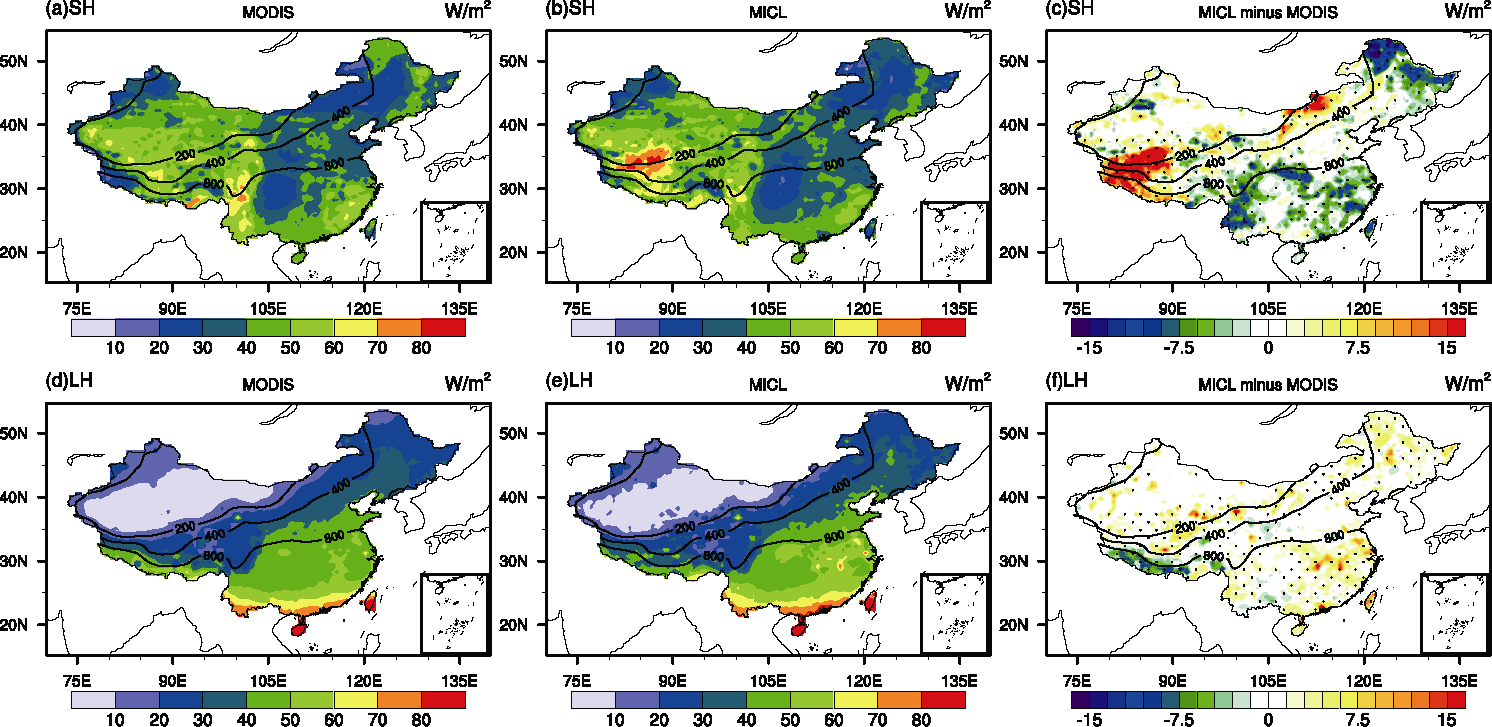 | Figure 3 Mean annual spatial distributions for (a) sensible heat flux simulated by the MODIS run and (b) by the MICL run; (c) difference of sensible heat flux between MICL and MODIS; (d) latent heat flux simulated by the MODIS run and (e) by the MICL run; and (f) differences of latent heat flux between MICL and MODIS. Differences in (c, f) with confidence level greater than 95% are stippled. |
| Table 3 Seasonal and annual sensible heat flux (SH) and latent heat flux (LH) (W m-2) simulated by the MODIS run (MO) and the MICL run (MI), and differences between the two runs (MI-MO). |
 | Figure 4 Mean annual spatial distributions of (a) total runoff simulated by MODIS run and (b) by the MICL run; (c) differences of runoff between MICL and MODIS; (d) GRDC data; (e) differences of surface runoff between MICL and MODIS; and (f) differences of subsurface runoff between MICL and MODIS. Differences in (c, e, and f) with confidence level greater than 95% are stippled. |
| Table 4 Seasonal and annual runoff (mm yr-1) simulated by the MODIS run (MO) and the MICL run (MI), and differences between the two runs (MI-MO). |
5 Conclusions
A land cover dataset for China (MICLCover) developed by Ran et al. (2012) combining multiple information sources was used in CLM4 in this study to assess the impacts of the new land cover information on land surface simulation over China. Two 33-yr simulations (1972- 2004) were conducted, one using the MICL dataset as the input for the CLM4, and the other using the default MODIS dataset.
Compared to the MODIS data, simulations using the MICL data showed decreases in bare soil cover (reduced by 14.6%), needleleaf tree cover (3.6%), and broadleaf tree cover (1.9%), resulting from increased areas of shrubland (increased by 1.8%), grassland (9.9%), crops (5.0%), glaciers (0.5%), lakes (1.6%), wetlands (1.1%), and unchanged urban areas. These differences led to a reduction of 0.3% in the simulated mean annual surface albedo over China as a whole, with the largest change occurring across semiarid regions (-2.1%). Simulated surface albedo using MICL data was more consistent with observed albedo than previously, for arid and semiarid regions. The land surface temperature increased over Inner Mongolia and the western Tibetan Plateau using MICL data mainly due to the reduced surface albedo. A reduced number of trees over the eastern humid region resulted in an increased land surface temperature.
Sensible heat flux was shown to increase greatly in areas where the surface albedo decreased by a large amount, resulting in higher levels of incident shortwave radiation being absorbed by those surfaces. However, no significant change (0.1 W m-2) was found in the mean annual sensible heat flux when averaged over China, due to variations in arid and semiarid regions being almost cancelled out by opposite variations in humid and semihumid regions. The latent heat flux increased by 1 W m-2, with almost identical changes being simulated across the whole of China.
In addition, both sets of simulations captured the same spatial distribution of mean runoff as obtained from the Global Runoff Data Centre (GRDC) data. The mean simulated annual runoff over all of China decreased by 6.8 mm yr-1, consisting of decreased surface runoff of 2.6 mm yr-1 and decreased subsurface runoff of 4.2 mm yr-1, with the greatest contribution to this change being from humid regions.
Accurate descriptions of land cover have the potential to improve land surface modeling and even climate modeling; therefore, more simulations and analyses are required to further investigate the detailed mechanism of climate effects.
Acknowledgements. This study was supported by the National Basic Research Program of China (Grants Nos. 2010CB951101 and 2010CB428403) and the National Natural Science Foundation of China (Grant No. 91125016).
Reference
| 1 |
|
| 2 |
|
| 3 |
|
| 4 |
|
| 5 |
|
| 6 |
|
| 7 |
|
| 8 |
|
| 9 |
|
| 10 |
|
| 11 |
|
| 12 |
|
| 13 |
|
| 14 |
|
| 15 |
|
| 16 |
|
| 17 |
|
| 18 |
|
| 19 |
|
| 20 |
|
| 21 |
|
| 22 |
|
| 23 |
|