Characterization of Stratospheric Aerosol Distributions during the Volcanically Quiescent Period of 1998-2004
Cite this Article
YANG Jing-Mei, ZONG Xue-Mei, WANG Pu-Cai. Characterization of Stratospheric Aerosol Distributions during the Volcanically Quiescent Period of 1998-2004. Atmospheric and Oceanic Science Letters, 2014, 7(4): 291-296 
Permissions
Copyright?2014, Editorial office of Atmospheric and Oceanic Science Letters
This is an Open Access article under the terms of CCAL.
Characterization of Stratospheric Aerosol Distributions during the Volcanically Quiescent Period of 1998-2004
Abstract
The Stratospheric Aerosol and Gas Experiment (SAGE) II aerosol extinction profiles at 1020 nm were used to study the distribution characteristics of stratospheric aerosols during the volcanically quiescent period of 1998-2004. The stratospheric aerosol distributions exhibited hemispheric asymmetry between the Northern Hemisphere (NH) and the Southern Hemisphere (SH). In the lower stratosphere below 20 km, the zonal averaged aerosol optical depths in the NH were higher than those of the corresponding SH; whereas at higher altitudes above 20 km, the optical depths in the SH- except the equatorial region-were higher than those of the NH. At 0-10°N and 10-20°N, the stratospheric aerosol optical depth (SAOD) exhibited larger values in boreal winter and lower values in the spring and summer; at 0-10°S and 10-20°S, the SAOD presented small seasonal variations. At 30-40°N, the SAOD presented larger values in the boreal fall and winter and lower values in the spring and summer; while at 30-40°S, the SAOD exhibited larger values in the austral winter and early spring and lower values in the summer and fall. These characteristics can mainly be attributed to the seasonal cycle of the dynamic transport, and the effects of the buildup and breakdown of the polar vortex. At 50-60°S, the SAOD exhibited extremely high values during austral winter associated with the Antarctic polar vortex boundary; at 50-60°N, the SAOD also exhibited larger values during the boreal winter, but it was much less obvious than that of its southern counterpart.
Keyword:
aerosol; stratosphere; distribution; optical depth
1 Introduction
Stratospheric aerosols have been recognized as playing an important role in the climate system by influencing the radiative and chemical balance of the atmosphere (e.g., Hofmann and Solomon, 1989; McCormick et al., 1995; Hu and Shi, 1998). Therefore, a reliable characterization of the global distribution of stratospheric aerosols is necessary for a correct understanding and modeling of stratospheric processes. During the last two decades, stratospheric aerosol properties have been observed and studied by many authors (e.g., Brogniez et al., 1996; Wu et al., 2001; Bingen et al., 2006), and several studies were devoted to the description of stratospheric aerosol distributions over different time periods and locations (e.g., Hitchman et al., 1994; Choi et al., 1998; Barnes and Hofmann, 2001; Wang et al., 2004; Padma Kumari et al., 2006; Niwano et al., 2009; Parameswaran et al., 2010; Sunilkumar et al., 2011; Liu et al., 2012; Yang, 2012).
Since the late 1990s, stratospheric aerosols have been characterized by relatively steady levels because of the lack of major volcanic eruptions after the Pinatubo eruption in June 1991 ( Thomason et al., 2008). These steady levels may represent a volcanically quiescent stratosphere and are often referred to as "background stratospheric aerosol levels" ( Deshler et al., 2006). This quiescent period has provided an opportunity to study the stratospheric aerosol distributions under volcanically quiescent conditions. Parameswaran et al. (2010) studied the seasonal variation of aerosol extinction in the upper troposphere and lower stratosphere in the region (0-30°N, 70-90°E) using lidar and the Stratospheric Aerosol and Gas Experiment (SAGE) II observations during 1998-2003. They reported that the annual variation of particulate optical depth in the upper troposphere region showed relatively low values during winter and high values during summer, while the optical depth in the lower stratosphere region had relatively high values during winter and low values during summer. Liu et al. (2012) analyzed SAGE II data over 60°S-60°N for the period 1998-2004, and noted that the seasonal means of aerosol extinctions in the lower stratosphere were typically higher in winter/spring than in summer/fall. To better understand the distribution behavior of the stratospheric aerosol layer during volcanically quiescent periods, quantitative descriptions of global-scale aerosol distributions are necessary. In this paper we examine the stratospheric aerosol distribution and seasonal variation characteristics during the volcanically quiescent period of 1998-2004. We present calculations of the zonal-averaged aerosol optical depth for different altitude levels based on SAGE II 1020-nm aerosol extinction data, and analyze the distributions and seasonal variations of stratospheric aerosols over 10° latitude intervals from 60°S to 60°N.
2 Data and method
The SAGE II measurements provided the vertical profiles of aerosol extinction coefficients at four wavelengths (1020, 525, 452, and 386 nm) from October 1984 to August 2005 ( McCormick et al., 1979; McCormick, 1987; Chu et al., 1989). The profile dataset has near global coverage (80°S-80°N) with a vertical resolution of 0.5 km. The sensitivity study by Thomason et al. (2008) indicated that the bias errors for SAGE II 1020-nm aerosol extinction measurements under non-volcanic conditions were less than 5% from the tropopause to 30 km. Comparisons by Hervig and Deshler (2002) showed that the mean differences between SAGE II and balloon-borne optical particle counters were within 5%-20%. Detailed validations by many other authors (e.g., Russell and McCormick, 1989; Kent et al., 1994; Reeves et al., 2008) have also demonstrated that the SAGE II aerosol extinction profiles are reliable and accurate, particularly for the 1020-nm channel.
In this study, we used SAGE II (version 6.2) 1020-nm aerosol extinction profile data from January 1998 to December 2004. In data processing, the measurement errors for each profile, also provided by the SAGE II data, were checked for each altitude level, and the data with measurement error exceeding 30% were removed. For all the profiles, the extinction value was examined. If it was within 4 km of the tropopause level and exceeded four times the standard deviation plus the zonal mean values, the data were considered to be affected by clouds and thus removed.
To obtain a representative stratospheric aerosol distribution pattern for different latitude bands, the zonal- averaged monthly mean aerosol extinction profiles were calculated by averaging every 10° of latitude from 60°S to 60°N for each month during the period 1998-2004. The zonal-averaged annual mean extinction profiles used in the study were computed by averaging the 12 monthly mean profiles. Besides the extinction data, we also use aerosol optical depth to describe the stratospheric aerosol distribution pattern.
The aerosol optical depth ( τ) for the altitude region z1- z2 was calculated as follows:
| , (1) |
where βa ( z) is the aerosol extinction coefficient at altitude z.
Using Eq. (1), the zonal-averaged aerosol optical depth can be calculated by integrating the zonal-averaged extinction coefficients between the two specified height levels.
3 Results and discussion
3.1 Zonal-averaged annual mean stratospheric aerosol distributions
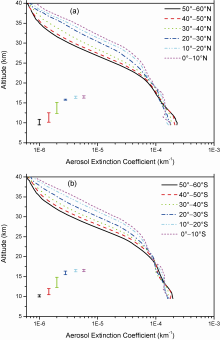
Figure 1 shows the vertical profiles of the zonal- averaged annual mean SAGE II 1020-nm aerosol extinction coefficients for each 10° latitude band during the period 1998-2004 in the Northern Hemisphere (NH) and Southern Hemisphere (SH). The zonal-averaged annual mean tropopause heights and the one standard deviation values for each latitude band are also shown in Figs. 1a and 1b. These figures show that, in both hemispheres, the aerosol extinction coefficients at altitudes above 20 km decreased monotonically with latitudes and, as expected, the aerosol extinction coefficients decreased with the increase in altitude. These extinction profiles are consistent with the reference aerosol distributions presented by McCormick et al. (1996), and are believed to represent typical aerosol vertical distributions during volcanically quiescent periods. To minimize the effects of the tropo-pause height variation and cloud contamination, the lowest bounds chosen in the following analysis were 2 km above the zonal-averaged tropopause heights.
gives the zonal-averaged annual mean aerosol optical depths and the one standard deviations within the altitude ranges from 2 km above the tropopause ( HT+2) to 20 km, 20-40 km, 26-40 km, and HT+2 to 40 km for each latitude band. The zonal-averaged tropopause heights are also given. Table 1 shows that the zonal averaged aerosol optical depths in the lower stratosphere below 20 km increased with the increase in latitude, while the optical depth values above 20 km levels decreased with the increase in latitude. This distribution pattern is associated with the transport effects of the Brewer-Dobson circulation in the lower stratosphere ( Brewer, 1949; Dobson, 1956). The Brewer-Dobson circulation, which is driven by extratropical wave forcing in the middle atmosphere ( Holton et al., 1995), consists of an upward motion in the tropics, poleward and downward flow in the midlatitudes, and subsidence at high latitudes. Table 1 also shows that there is an obvious asymmetry in aerosol distribution between the NH and the SH. At the lower stratosphere below 20 km, the zonal-averaged aerosol optical depth values in the NH were 3.6% to 6.8% higher than the values of the corresponding SH. This distribution behavior can be explained by the stronger upward mass transport from the upper troposphere into the lower stratosphere in the northern tropics and more effective meri-dional poleward and downward transport in the northern midlatitude lower stratosphere regions. At the altitude level above 20 km, the zonal mean aerosol optical depths in the SH-except the equatorial region where the NH and SH share approximately the same optical depth values-were 2.7% to 13.7% higher than in the NH. This distribution is due to the more pronounced rising motions in the SH lower stratosphere.
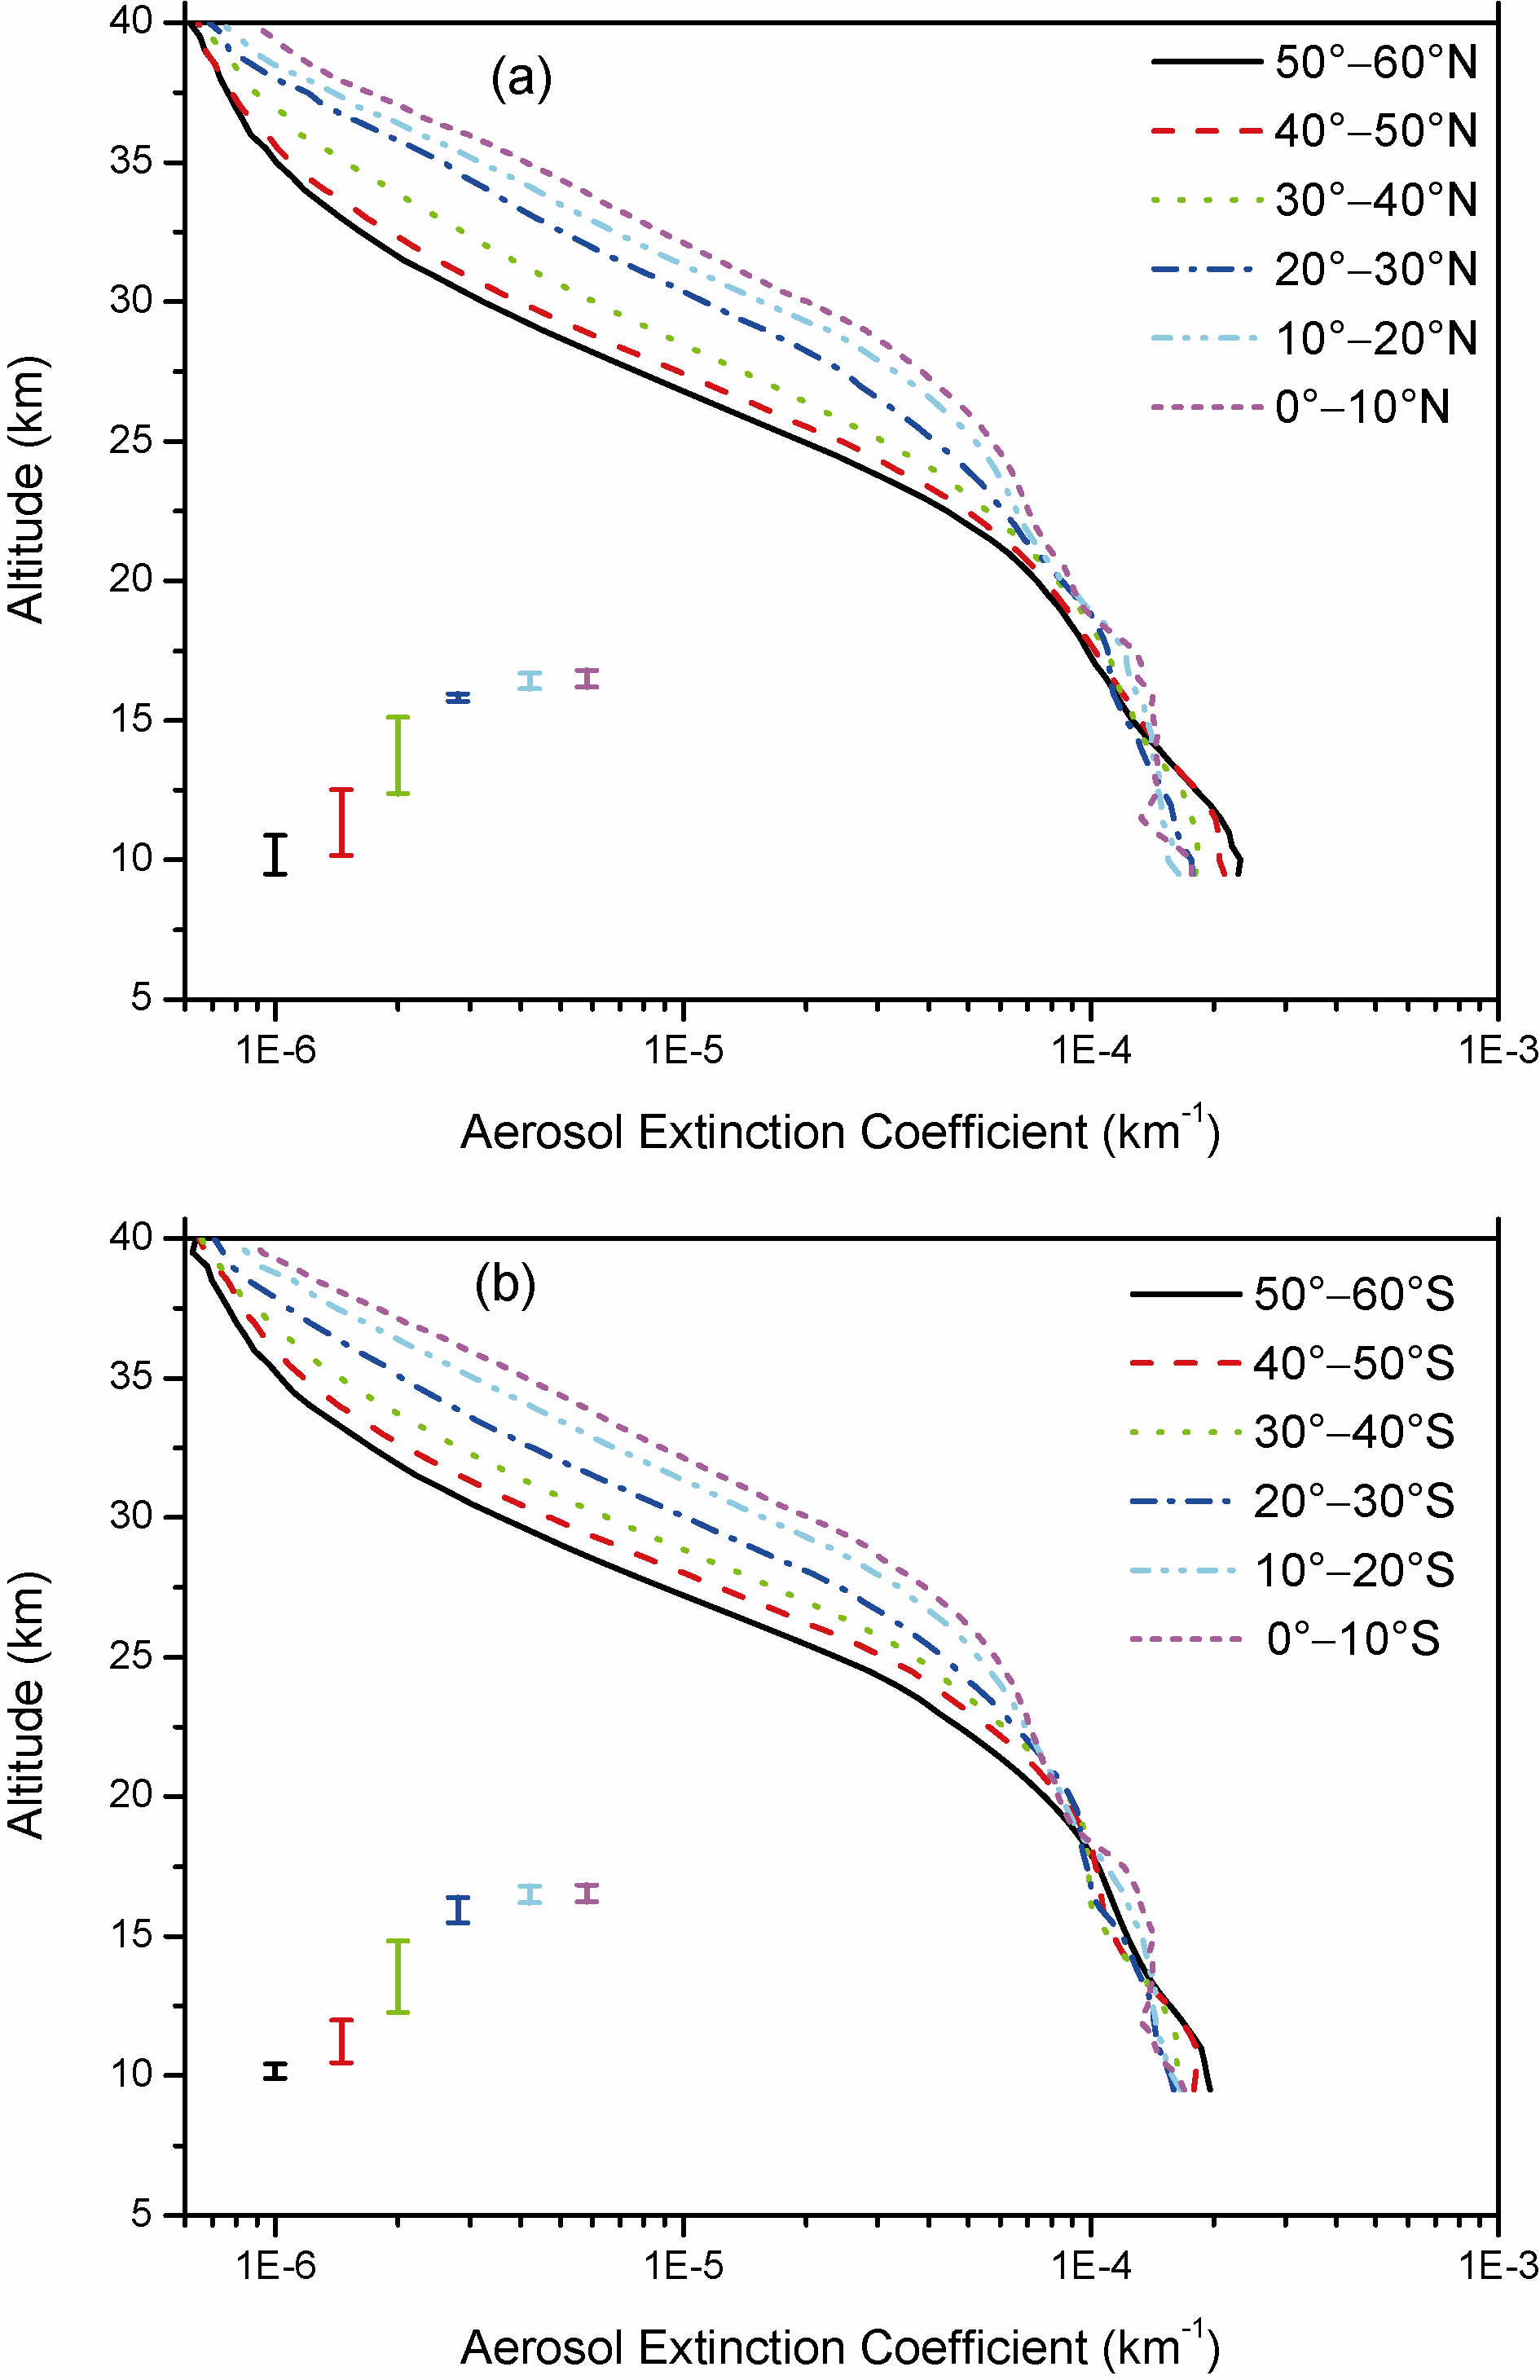 | Figure 1 Zonal-averaged annual mean SAGE II 1020-nm aerosol extinction profiles for each 10° latitude band from (a) 0-60°N and (b) 0- 60°S for 1998-2004. The observed heights of the tropopause are indicated by the vertical bars (one standard deviation) using the same color as the corresponding extinction profiles. |
| Table 1 Aerosol optical depths ( τ) ( multiplied by 1000) within the altitude ranges from 2 km above the tropopause ( HT+2) to 20 km, 20-40 km, 26-40 km, and HT+2 to 40 km for each latitude band. The corresponding standard deviations ( σ) and the zonal-averaged tropopause heights ( HT) are also listed. |
Table 1 also shows that in the tropical lower stratosphere, the standard deviations in the NH were higher than in the SH, whereas in the tropical higher altitude region (> 26 km), the standard deviation values were higher in the SH than in the NH, revealing that the NH exhibited greater variability in aerosol loading in the lower stratosphere, while the SH had more pronounced variability at altitudes above 26 km. Furthermore, Table 1 shows that in the southern high-latitude band of 50-60°S, the standard deviation values for HT+2-20 km and 20-40 km were obviously higher than those of the corresponding NH, suggesting a greater seasonal variability at the southern high-latitude stratosphere. The seasonal variation behavior of the stratospheric aerosol layer for different latitude bands is discussed in the next section.
3.2 Latitudinal and seasonal variations
Figure 2 presents the zonal-averaged monthly mean aerosol optical depths for different altitude ranges for the tropics (Figs. 2a and 2b), midlatitudes (Fig. 2c) and high latitudes (Fig. 2d). The figures show that in the northern tropical latitude bands 0-10°N and 10-20°N, the stratospheric aerosol optical depths (SAODs) (integrated aerosol extinction coefficients from 2 km above the tropo-pause to 40 km) displayed a seasonal variation with larger values in the northern winter (December-February) and lower values in the spring and summer (April-July). In the tropical region, the aerosol loading in the lower stratosphere is mainly associated with the amount of aerosol entering the stratosphere. The quantities studies by Rosenlof and Holton (1993) and Rosenlof (1995) revealed that the upward mass flux in the tropics across the 100 mb surface (about the height of the tropical tropopause) is much stronger in the northern winter than in the summer, and these processes normally lead to a wintertime maximum and summertime minimum in aerosol loading at the lower stratosphere levels. The springtime lower aerosol loadings in the northern tropical regions shown in Figs. 2a and 2b can be explained by the meridional transport effects. During boreal spring, after the breakdown of the Arctic polar vortex, the confined aerosol in the tropical region spread poleward, resulting in a decrease in aerosol amounts in the lower stratosphere. In the southern tropical latitude bands 0-10°S and 10-20°S, the SAOD values exhibited small seasonal variations with relatively larger values in December to February. The larger seasonal amplitude at 0-10°N and 10-20°N than at 0-10°S and 10-20°S can be explained by the following two reasons: (1) Larger amounts of aerosols were brought up to the northern tropics upper troposphere by the Asian summer monsoon and other strong convective systems during boreal summer, causing the high aerosol concentrations in the upper troposphere region, as noted by Parameswaran et al. (2010), and these aerosols were further transferred into the stratosphere by the stronger upward convention wind during boreal winter, thus creating a higher seasonal maximum of aerosol loading in the northern stratosphere during the winter. (2) The meridional dispersion was more efficient during boreal spring due to the breakdown of the Arctic polar vortex, resulting in the lower seasonal minimum of aerosol loading in the northern tropical lower stratosphere during the late spring and summer.
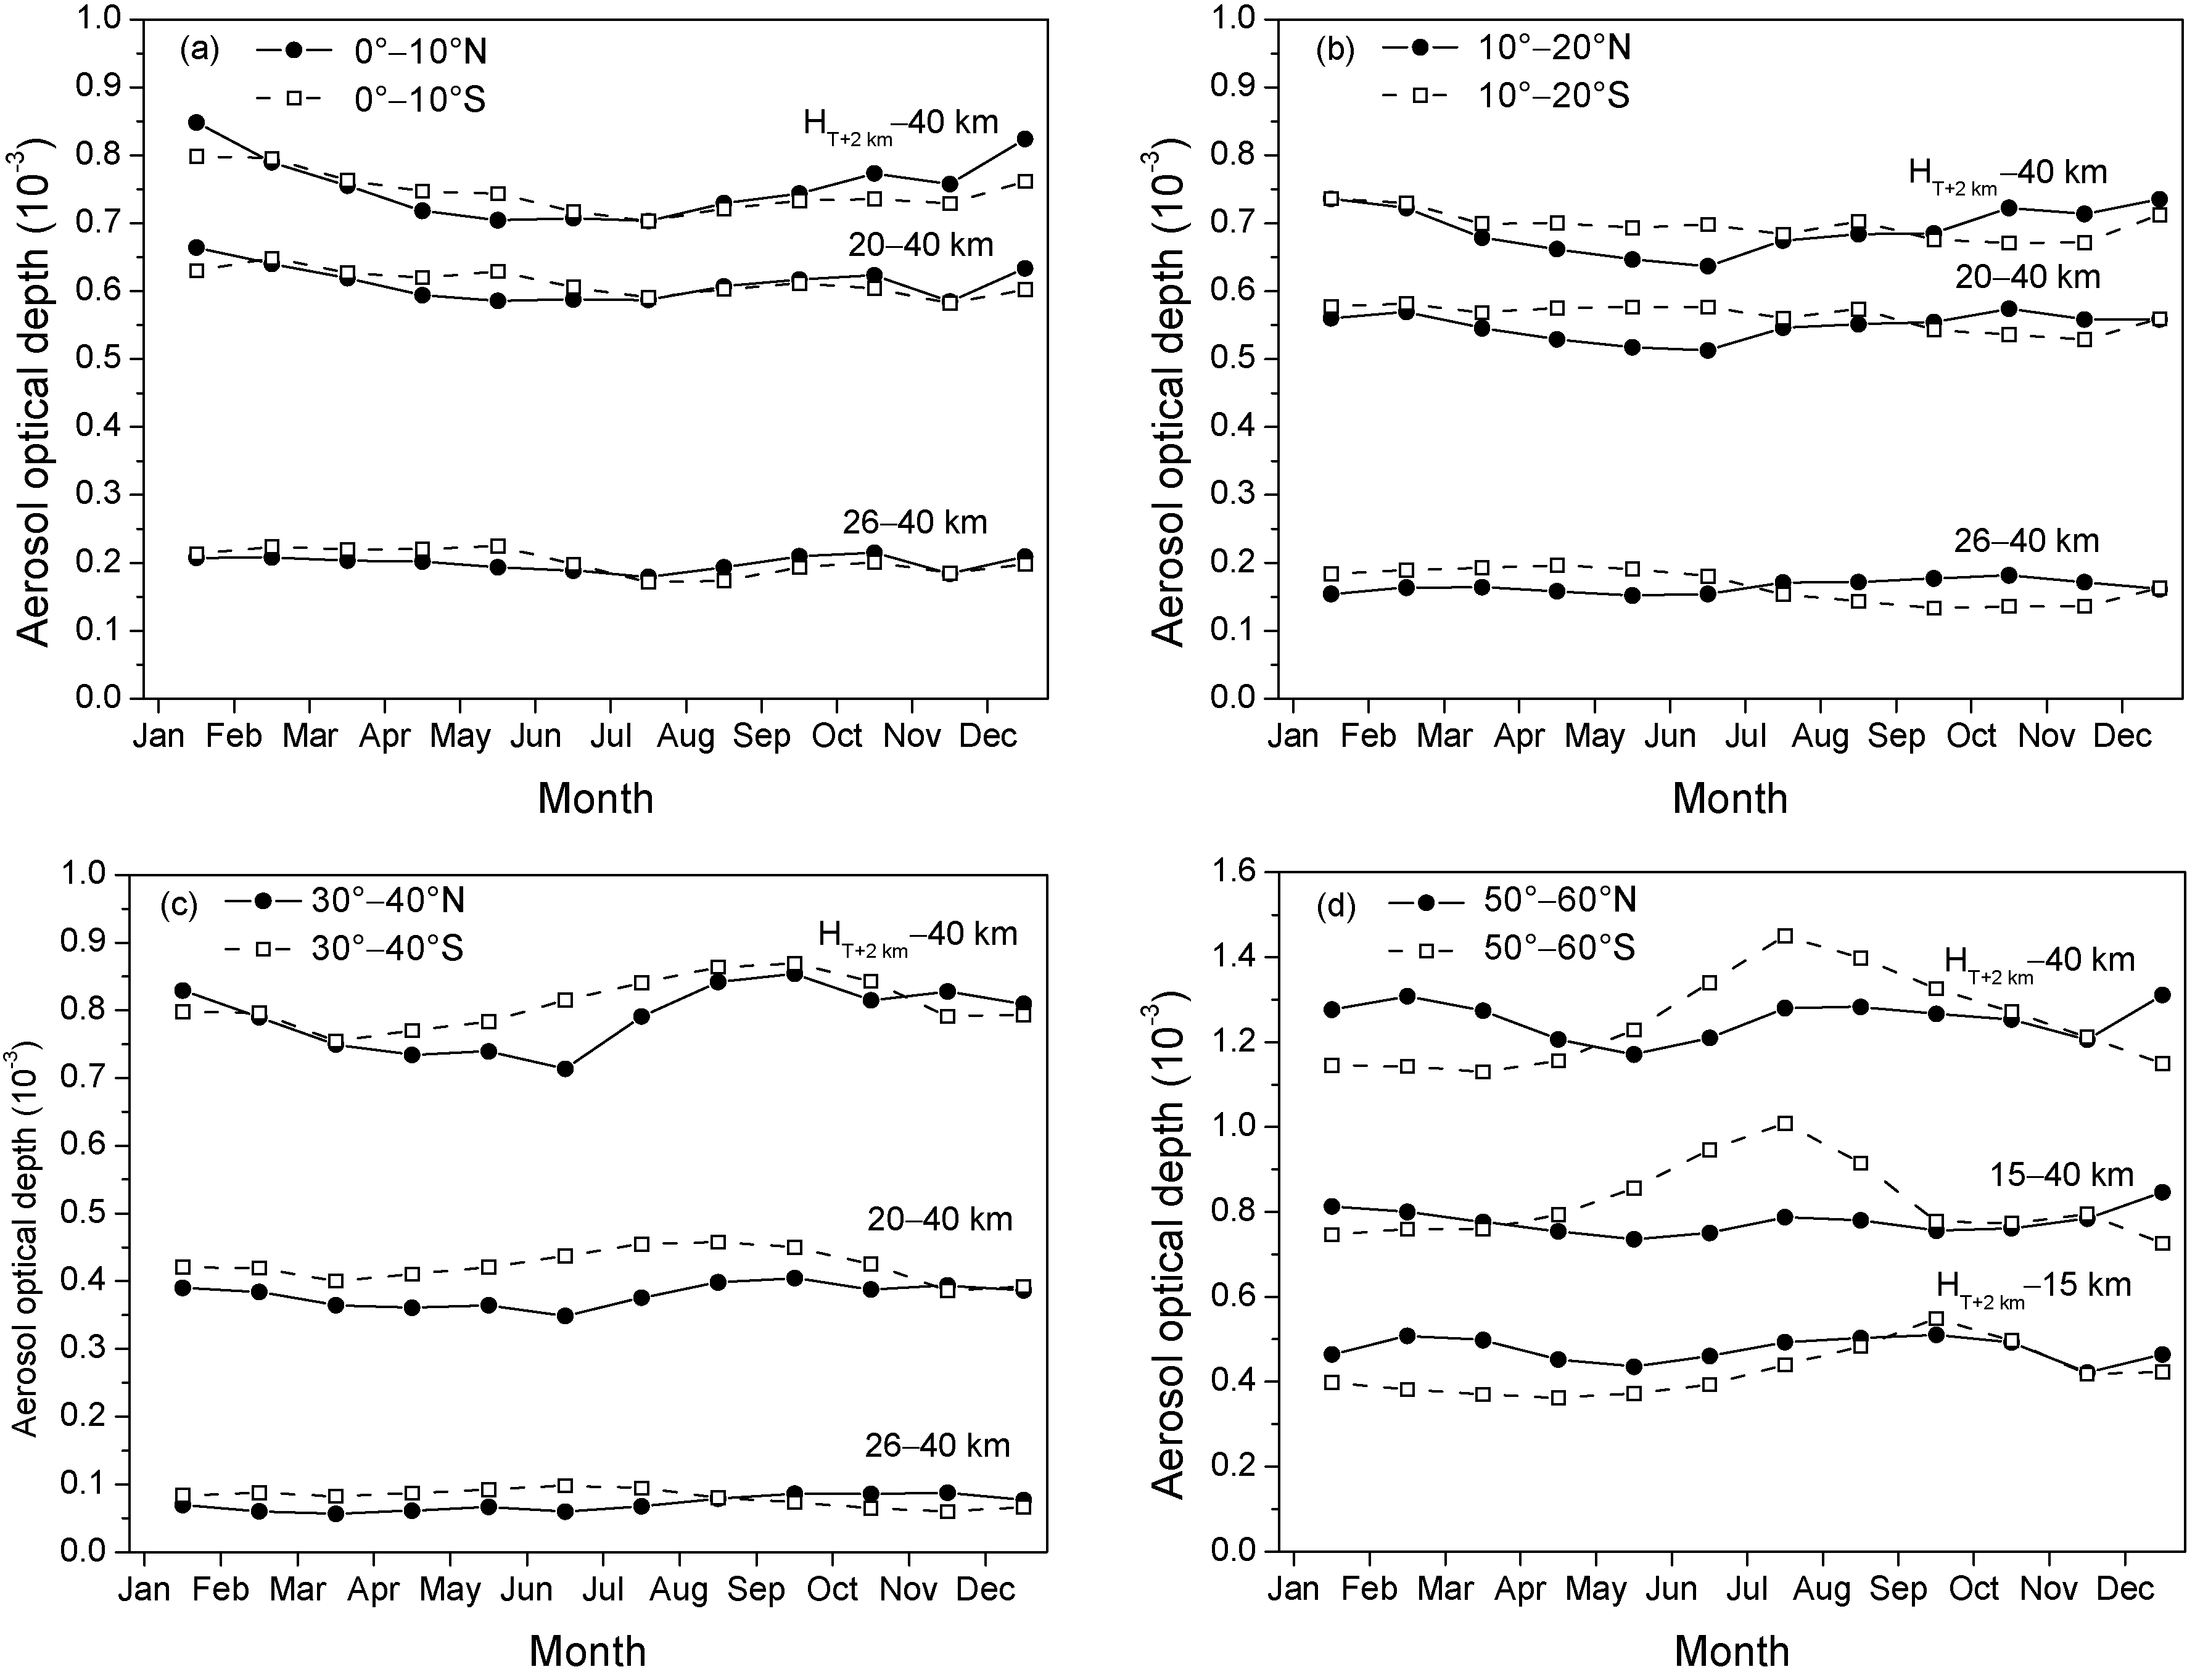 | Figure 2 Zonal monthly mean SAGE II 1020-nm aerosol optical depths within the altitude ranges from 2 km above the tropopause ( HT+2) to 40 km, 20-40 km, and 26-40 km for the latitude bands of (a) 0°-10°, (b) 10°-20°, (c) 30°-40°, and (d) within the altitude ranges from HT+2 to 40 km, 15-40 km, and HT+2 to 15 km for the latitude band of 50°-60°. |
Figure 2b also shows that the optical depths above 26 km (26-40 km) for both hemispheres were characterized by higher values in the local fall, and the amplitude of the seasonal cycle was larger in the SH than in the NH. This is in general agreement with the studies of Niwano et al. (2009), and can be explained by the ascent of the mean meridional aerosol transport in the local summer and the descent in the local winter; and the ascent of the mean meridional circulation has a larger seasonal amplitude in the SH ( Niwano et al., 2009).
For the midlatitude bands shown in Fig. 2c, the SAOD in the northern 30-40°N band is characterized by seasonal variations with larger values in the local fall and winter and lower values in the spring and summer. This characterization was primarily related to the seasonal cycle of the dynamic aerosol transport from the tropics toward the polar regions, which was stronger toward the winter hemisphere than toward the summer hemisphere ( Kent and McCormick, 1984). The fall month high optical depth values can be explained by the effects of the polar Arctic vortex. In the late summer (August), when the Arctic polar vortex began to build up, the horizontal aerosol trans-port from the midlatitudes to the polar region was suppressed, causing an increase in aerosol concentration in the northern lower stratosphere during the fall months. In the southern 30-40°S band, the seasonal variation of the SAOD exhibited larger values during the local winter and early spring and lower values during the summer and fall. These variations were also primarily related to the stronger poleward and downward aerosol transport during the winter, and the effects of the Antarctic polar vortex. During austral winter and early spring, the meridional aerosol transport to the polar region was inhibited by the strong Antarctic polar vortex, and the aerosol loading was enhanced, while after the breakdown of the polar vortex in late October and early November, the aerosol spread poleward, resulting in a decrease in aerosol concentrations during the austral summer months.
It is worth noting that our results of aerosol seasonal variation are different from the results of higher values in winter/spring and lower values in summer/fall obtained by Liu et al. (2012) using the same SAGE II data set of 1998-2004. This difference could be explained by the fact that the data used in our study excluded data considered to be affected by clouds, whereas the data used by Liu et al. (2012) included the data contaminated by clouds.
For the high-latitude bands shown in Fig. 2d, the aerosol optical depth between 15 km and 40 km in the southern 50-60°S latitude band exhibited extremely high values during the austral winter (June-August), while the aerosol optical depth below 15 km remained relatively constant. Figure 2d shows that the main contributor to the high SAOD values during austral winter was the enhan-cement of aerosol amounts in the altitudes above 15 km. This aerosol pattern is associated with the Antarctic polar vortex boundary. As discussed in detail by Hartmann et al. (1989), the polar vortex acts as a barrier inhibiting the horizontal transport from lower latitudes. As the Antarctic polar vortex intensifies during austral wintertime, the poleward aerosol transport above the base of the vortex (about 15 km) is suppressed, inducing an enhancement in aerosol loading outside the vortex. At the lower stratosphere below 15 km levels, the horizontal aerosol trans-port occurs freely, and the enhancement of aerosol loading does not occur. In the northern 50-60°N latitude band, a high stratospheric aerosol loading can also be seen during the boreal winter, but it is much less obvious than that of its southern counterpart, since the Arctic polar vortex is not so pronounced and persistent as the Antarctic one.
4 Conclusions
In this study, we used SAGE II 1020-nm aerosol extinction profile data to describe the distribution characteristics of the stratospheric aerosol in the different altitude levels during the volcanically quiescent period of 1998- 2004. We have shown that the zonal-averaged annual mean aerosol optical depths in the lower stratosphere below 20 km increased with the increase in latitude, while the optical depth values above 20 km levels decreased with the increase in latitude. We have also shown that the zonal-averaged stratospheric aerosol distributions presented a hemispheric asymmetry between the NH and the SH.
The seasonal variation of the stratospheric aerosols also exhibited hemispheric asymmetry between the NH and the SH. At 0-10°N and 10-20°N, the SAOD presented larger values in the northern winter (December-February) and lower values in the spring and summer (April-July), which was mainly due to the stronger upward aerosol transport from the troposphere into the stratosphere during the northern winter. At 0-10°S and 10-20°S, the SAOD values exhibited small seasonal variations with rela-tively larger values in December to February. The seasonal variation differences between the NH and the SH were mainly associated with the differences in the amount of aerosol entering the tropical stratosphere and the meridional transport effects.
At 30-40°N, the SAOD exhibited larger values in the local fall and winter, and lower values in the spring and summer; whereas at 30-40°S, the seasonal variation of the SAOD presented larger values in the local winter and early spring and lower values in the summer and fall. These variations were mainly associated with the seasonal cycle of transport processes, and the effects of the buildup and breakdown of the polar vortex in both hemispheres.
At 50-60°S, the SAOD presented quite a strong seasonal variation with pronounced larger values in austral winter (June-August) associated with the Antarctic polar vortex boundary. At 50-60°N, the SAOD also exhibited larger values during boreal winter, but it was much less obvious than that of its southern counterpart.
Acknowledgements. The authors wish to acknowledge the National Aeronautics and Space Administration (NASA) Langley Research Center for the SAGE II aerosol data. This work was supported by the National Basic Research Program of China (Grant No. 2013CB955801), the National Natural Science Foundation of China (Grant No. 41275047), and the Strategic Priority Research Program of the Chinese Academy of Sciences (Grant No. XDA05100300).
Reference
| 1 |
|
| 2 |
|
| 3 |
|
| 4 |
|
| 5 |
|
| 6 |
|
| 7 |
|
| 8 |
|
| 9 |
|
| 10 |
|
| 11 |
|
| 12 |
|
| 13 |
|
| 14 |
|
| 15 |
|
| 16 |
|
| 17 |
|
| 18 |
|
| 19 |
|
| 20 |
|
| 21 |
|
| 22 |
|
| 23 |
|
| 24 |
|
| 25 |
|
| 26 |
|
| 27 |
|
| 28 |
|
| 29 |
|
| 30 |
|
| 31 |
|
| 32 |
|
| 33 |
|
| 34 |
|