
Correlation between Atmospheric Water Vapor and Diurnal Temperature Range over China
Cite this Article
ZHAO Tian-Bao. Correlation between Atmospheric Water Vapor and Diurnal Temperature Range over China. Atmospheric and Oceanic Science Letters, 2014, 7(4): 369-375 
Permissions
Copyright?2014, Editorial office of Atmospheric and Oceanic Science Letters
This is an Open Access article under the terms of CCAL.
Correlation between Atmospheric Water Vapor and Diurnal Temperature Range over China
Abstract
Diurnal temperature range (DTR) is an important measure in studies of climate change and variability. The changes of DTR in different regions are affected by many different factors. In this study, the degree of correlation between the DTR and atmospheric precipitable water (PW) over China is explored using newly homogenized surface weather and sounding observations. The results show that PW changes broadly reflect the geographic patterns of DTR long-term trends over most of China during the period 1970-2012, with significant anticorrelations of trend patterns between the DTR and PW, especially over those regions with higher magnitude DTR trends. PW can largely explain about 40% or more (
Keyword:
atmospheric water vapor; precipitable water; diurnal temperature range; anticorrelation; China
Received 17 January 2014; revised 29 May 2014; accepted 30 May 2014; published 16 July 2014
Citation: Zhao, T.-B., 2014: Correlation between atmospheric water vapor and diurnal temperature range over China, Atmos. Oceanic Sci. Lett., 7, 369-375, doi:10.3878/j.issn. 1674-2834.14.0005.
1 Introduction
Diurnal temperature range (DTR), i.e., the difference between daily maximum and minimum temperature 2 m above the surface, is an important index used to describe climate change and variability ( Karl et al., 1984; Braganza et al., 2004). As the global average surface air temperature has risen on average by 0.74°C over the past 100 years (1906-2005), the DTR has decreased by 0.38°C since 1950 (Intergovernmental Panel on Climate Change (IPCC), 2007). The widespread decrease of the DTR over many land areas has resulted mostly from a faster increase in daily minimum temperature ( Tmin) than daily maximum temperature ( Tmax), with most of the decrease occurring prior to 1980 ( Karl et al., 1993; Easterling et al., 1997; IPCC, 2001, 2007; Vose et al., 2005; Wild et al., 2007 , Wild, 2009). Associated with this asymmetric warming are changes in extremes of weather and climate, e.g., reduced frost days, increased warm nights, reduced cold nights, longer heat waves, and an increased frequency of heavy precipitation events in some regions ( IPCC, 2007; Zhou et al., 2009). In a warmer future climate, a related aspect of temperature extremes is that there is likely to be a decrease in the daily (diurnal) temperature range in most regions ( IPCC, 2007).
The decline in the DTR is mainly attributed to an increase of cloud cover, precipitation, and soil moisture ( Karl et al., 1993; Dai et al., 1997, 1999; Zhou et al., 2008, 2009). The regional differences in the changes of the DTR are determined by many different factors, such as greenhouse gas and aerosol concentrations ( Hunter et al., 1993; Mitchell et al., 1995; Stenchikov and Robock, 1995; Stone and Weaver, 2003; Huang et al., 2006), land use change ( Kalnay and Cai, 2003; Christy et al., 2006; Scheitlin and Dixon, 2010; Wang et al., 2012), vegetation composition ( Collatz et al., 2000), and solar radiation ( Wild et al., 2007; Makowski et al., 2009). Since water vapor is one of the most important greenhouse gases (GHGs) in the atmosphere, changes in the water vapor concentration are also likely to lead to an asymmetry in the DTR, due to its absorption of solar radiation in the near infrared range of the spectrum ( Stenchikov and Robock, 1995). Increasing atmospheric water vapor in terms of surface observed humidity increases both nighttime and daytime temperatures and thus has little effect on the DTR over most land areas, except at northern high latitudes ( Dai et al., 1999). Such effects are relatively small when considering the large-scale average, while the local effects over a long period of time are even less clear. Furthermore, analyzing the relationship between atmospheric water vapor and the DTR at local scales is very important for understanding water vapor-temperature feedback me-chanisms, and is thus critical to the prediction of future climate change. The apparent trends of changes in the DTR and their causes still possess many uncertainties; however, the sources of these uncertainties in the DTR and its physical interpretation are becoming clearer ( Har-tmann et al., 2013).
Similar to the global average temperature, over the past 50 years China has also experienced a significant warming in both the Tmin and Tmax, as well as a long-term decrease in the DTR. However, these trends have been established based on a relatively sparse network of observation stations, or with certain adjustments to the data (e.g., Qian and Lin, 2004; Zhou and Ren, 2009, 2011; Ren and Zhou, 2014; Xia, 2013; You et al., 2011), and thus should be revisited as observations improve and new ideas for examining the trends arise. Several previous studies have shown that atmospheric aerosols (e.g., Huang et al., 2006; Gong et al., 2006), land surface change ( Wu et al., 2011; Hua and Chen, 2013), solar radiation ( Liang and Xia, 2005), and urbanization (e.g., Zhou et al., 2004; Hua et al., 2006; Zhou and Ren, 2009, 2011; Yang et al., 2011; Wang et al., 2012; Ren and Zhou, 2014), rather than cloud cover and precipitation, seem to be the main causes of the decline in the DTR over China in recent decades ( Liu et al., 2004; Zhou et al., 2004). However, to the best of our knowledge, a systematic analysis of the relationship between atmospheric column-integrated water vapor (i.e., atmospheric precipitable water, PW) and the DTR over China does not yet exist. Thus, the objective of this paper is to examine, using an improved (homogenized) observational dataset, the relationship between the long-term DTR changes and atmospheric PW to quantitatively assess their degree of correlation over China.
2 Data and computation
A long term and homogeneous time series is crucial when analyzing results and drawing conclusions regarding climate change. In this study, a new homogenized Tmax and Tmin dataset based on observations at 549 Chinese stations, with no missing records during the period 1960- 2008 available athttp://159.226.234.56/index.php; Li and Yan, 2009) but now updated to 2012, was used to cal-culate the DTR. The dataset was homogenized using the Multiple Analysis of Series for Homogenization (MASH) ( Szentimrey, 1999, 2008) software package. Applying this software can effectively reduce most discontinuities in raw data and make long-term trends more spatially coh-erent than if manually estimating the trends by comparing data across a large area ( Li and Yan, 2009). The dataset has also demonstrated good performance in describing extreme climatic events over China (e.g., Yan et al., 2011; Wei and Chen, 2011; Qian et al., 2011; Zhang and Qian, 2011; Ding and Qian, 2011).
The tropospheric PW data integrated from the surface to 300 hPa used in this study are derived from daily radiosonde humidity data homogenized by Dai et al. (2011). There are a total of 160 stations in this dataset located in China, but 100 of them have humidity records that are around 80% complete since 1970. Zhao et al. (2012) utilized this dataset to analyze long-term trends of tropospheric humidity during the period 1970-2008 over China and found that, compared with the raw data, the homogenized data are better able to represent the tropospheric humidity trend with more temporal and spatial coherence,as well as describe the climatic effect of water vapor feed-back.
Figure 1 shows the geographic distribution of the 549 observation stations used to calculate the DTR and the around 100 radiosonde stations ( with humidity records over 85% complete since 1970) used for the PW along with an indication of the surrounding topography. As can be seen, the locations of most of the sounding stations match well with those of the surface observation stations. The densities of both are lower in the sparsely populated high mountainous and desert areas of West and Northwest China.
Following Zhao et al. (2012), monthly anomalies were computed as deviations from the long-term mean of the study period (1970-2012) for each month. Annual anomalies were then calculated from the monthly anomalies, requiring at least 10 months with data. Similarly, seasonal anomalies were formed for winter (December-February (DJF)) and summer (June-August (JJA)) by averaging the monthly anomalies for the individual seasons, requiring at least two months with data. The PW anomalies and changes in this paper are expressed as percentages of the 1970-2012 mean to make them spatially more comparable and easier to comprehend. To minimize the effect of outliers and end points, trends and their statistical significance at individual stations were estimated using the Mann-Kendall Tau-b non-parametric technique including Sen's slope method ( Sen, 1968). To obtain regional mean values, the monthly anomalies were first interpolated onto a 1°×1° latitude-longitude grid using the Cressman interpolation technique ( Cressman, 1959), and then the gridded data were averaged using the grid-box area as the weight to derive regional means.
3 Results and discussion
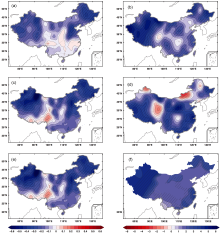
Figure 2 shows the spatial distribution of linear trends in the DTR and surface-to-300-hPa PW over China during the period 1970-2012. It can be seen that, apart from a
 | Figure 1 Geographic distribution of the surface (green dots) and sou-nding (red circles) observation stations. The underlying topography (m) is also shown. |
 | Figure 2 Spatial distributions of the linear trends for DTR (°C per decade, left panels) and surface-to-300-hPa PW (% per decade, right panels) over China during 1970-2012 for (a, b) annual, (c, d) winter, and (e, f) summer changes. The stippled areas are statistically significant at 0.05 level. The pattern correlations of PW trends with their DTR counterparts are -0.30, -0.15, and -0.40 for annual, winter, and summer changes, respectively. |
few areas in central, Southeast, and North China, downward DTR trends of -0.1°C to -0.5°C per decade dominate across the country, despite displaying certain seasonal and regional dependencies (Figs. 2a, 2c, and 2e). The stronger DTR decreases -0.3°C to -0.5°C per decade are seen in most of northern China, and the largest decreases < -0.5°C per decade over this region appear in winter (Fig. 2c). These results are broadly consistent to those reported by Alexander et al. (2006) for the DTR over the Northern Hemisphere during the period 1970-1990, albeit with smaller magnitude. With respect to the long-term changes of PW, the annual and seasonal PW anomalies demonstrate upward trends of 2% to 5% per decade for most of mainland China. However, the most statistically significant trends of ~ 5% per decade are seen in the annual and summer-season results over Northeast and Northwest China, as well as some parts of central and Southeast China (Figs. 2b, 2d, and 2f). This result is broadly in agr-eement with that of Zhao et al. (2012), albeit with slight differences that are likely due to our use of gridded data extending from 2008 to 2012. It is clear that the pattern of PW increase reflects the main
spatial features of the DTR decrease in most areas of China, with negative pattern correlations of -0.34, -0.15, and -0.40 for the annual, winter and summer trends respectively. In particular, the trends are more comparable in those areas displaying greater magnitudes of change, i.e., Northeast and North-west China. The relatively weak pattern correlations in winter are likely due to the PW trends with larger positive or negative magnitude over central China or the fringes of northern China.
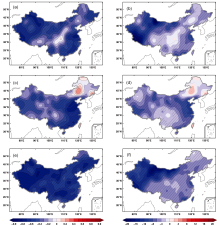
To explore how closely the PW changes are related to the DTR long-term variations, the correlation and linear regression slope coefficients at each grid box between the DTR and PW anomalies are examined. As shown in Figs.
3a, 3c, and 3e, most of China is covered by negative correlations, apart from a few regions in central China on the annual timescale and in Northeast China in winter. The most significant negative correlations ( r~-0.60) dominate most of northwestern and Southeast China on the annual timescale, as well as most of southeastern China in winter and across the whole of China in summer. This suggests that PW can generally explain about 40% or more ( r2≥0.40) of the DTR changes over these areas. The linear regression slope coefficients between the DTR and PW anomalies (Figs. 3b, 3d, and 3f) indicate that, overall, the relationships between the DTR and PW are similar to those found in Fig. 2 and Figs. 3a, 3b, and 3c; for a given
 | Figure 3 Correlation coefficients (left panels) and linear regression slope coefficients (right panels) at each grid box between the DTR and PW anomalies for (a, b) annual, (c, d) winter, and (e, f) summer changes. The stippled areas are statistically significant at 0.05 level. |
decrease in the DTR during the period 1970-2012, there would be an increase of PW, and vice versa. The slope patterns suggest that a 1 K decrease/increase in the DTR is associated with a 2% to 10% increase/decrease of PW over most of China. The largest slope coefficients are found over northwestern China on the annual timescale and in summer, but over southeastern China in winter, which is comparable with the distributions of correlation coefficients shown in Figs. 3a, 3c, and 3e.
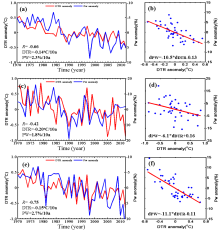
Wild et al. (2007) found that the observed decline in the DTR over global land surfaces from the 1950s to the 1980s fits with a large-scale dimming of solar radiation, and its stabilization thereafter with a subsequent large-scale brightening. Meanwhile, some recent studies have found similar temporal features in the DTR changes over China during the past 50 years as those reported in the present study (e.g., Zhou and Ren, 2011; Ren and Zhou, 2014; Xia, 2013). Small differences between the results of the present study and those recent studies are most likely due to the length of the dataset, as well as the different methods of data homogenization. Figures 4a, 4c, and 4e show the time series of DTR and PW anomalies averaged across the whole of China. It can be seen that the DTR decreases rapidly before 1990 and becomes stable thereafter, with negative trends of -0.14, -0.20, and -0.15°C per decade for annual, winter and summer
changes respectively. These magnitudes of DTR trends are very similar to those found by Ren and Zhou (2014), Zhou and Ren (2011), and Xia (2013). By examining the long-term changes of Tmin/ Tmax over China, the suggestion is that Tmin/ Tmax has increased at a rate of approximately 0.36/0.20, 0.48/0.21, and 0.30/0.16°C per decade for annual, winter and summer changes respectively, indicating that Tmin plays a more important role than Tmax in mitigating the DTR decrease during this period, especially in winter. The time series of PW variations is almost opposite to that of the DTR, with upward trends of approximately 2.3%, 1.8%, and 2.7% for annual, winter and summer changes respectively. These results are consistent with those of Zhao et al. (2012) in terms of the annual trend, but suggest a relatively smaller/larger magnitude in winter/summer. Regarding the level of correlation between the PW and DTR series, the PW series can explain around 44% ( r2 = 0.44), 18% ( r2 = 0.18), and 56% ( r2 = 0.56) of the DTR variance on the annual scale and in winter, and summer respectively. If based only on the explained variances, and by comparing the present results with those of Zhou and Ren (2011) and Ren and Zhou (2014), the effects of PW on DTR long-term changes seem to be more obvious than those of urbanization on the annual timescale and in winter. The scatterplots of DTR vs. PW anomalies (Figs. 4b, 4d, and 4f) suggest that the
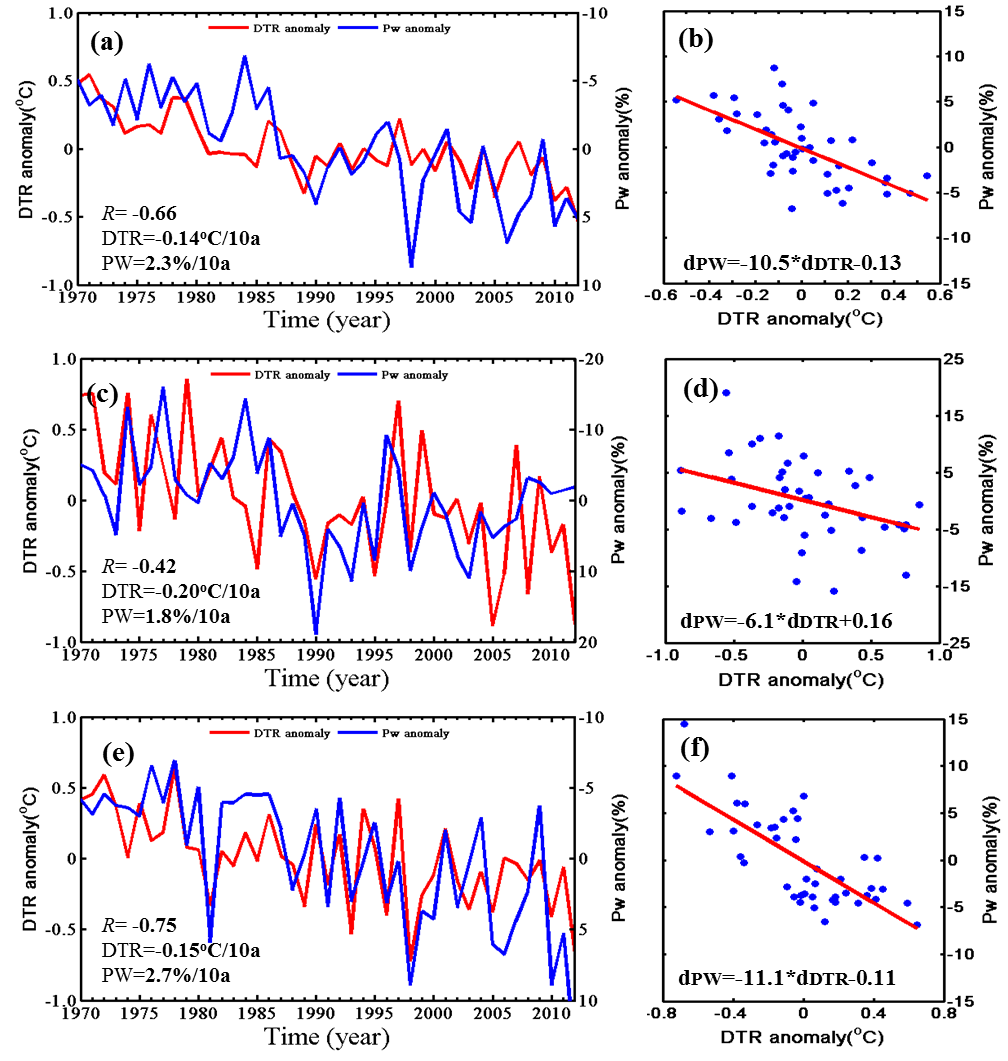 | Figure 4 Time series of PW and the DTR (left panels) averaged across China, and scatterplots of DTR vs. PW for (a, b) annual, (c, d) winter, and (e, f) summer changes. The correlation coefficient ( r) between the DTR and PW series, as well as their linear trends, are also shown in (a, c, e). |
increases of PW, expressed as a function of the decrease in annual, winter, and summer DTR changes, are 10.5%, 6.1%, and 11.1% K-1, respectively, which are absolutely higher than the value of 7.5% expected from the Clausius-Clapeyron relation on the annual timescale and in summer. This result further suggests that long-term DTR changes are mostly associated with opposite changes in tropospheric water vapor content, approximately following the Clausius-Clapeyron equation.
The anticorrelations of nationwide averaged DTR and PW anomalies were also examined for spring and autumn, and it was found that negative correlations of long-term changes between the DTR and PW anomalies approach -0.37 and -0.60 respectively. The result is consistent with the findings from the results presented in Figs. 2 and 3, and further indicates that the PW increase has an important role in affecting the decreases in DTR over China, despite certain regional and seasonal differences. Therefore, PW change can be regarded as a potential indicator of long-term changes in the DTR over China.
4 Concluding remarks
In this study, daily DTR data derived from a new homogenized 2 m Tmax and Tmin dataset ( Li and Yan, 2009), together with tropospheric humidity from a homogenized radiosonde dataset ( Dai et al., 2011; Zhao et al., 2012), were used to analyze how closely atmospheric column-integrated water vapor is correlated with long-term DTR changes over China during the period 1970-2012. The main findings can be summarized as follows.
The DTR shows a downward trend over most of China during the period 1970-2012, decreasing by approximately 0.1°C to 0.5°C per decade, and in particular by lower than -0.5°C per decade mainly over northwestern and northeastern China in winter, resulting mostly from a faster increase in Tmin than Tmax. In contrast with the DTR, the surface-to-300-hPa PW exhibits a statistically significant upward trend of 2% to 5% per decade across most of China, but with an increase of over 5.0% per decade for most of northwestern China and northern parts of Northeast China, as well as some areas of southeastern China. The more significant anticorrelations between the DTR and PW trends patterns range from -0.14 to -0.40, and are especially higher in summer ( r =-0.40). It seems that PW changes generally reflect the geographic patterns of DTR long-term trends over most of China, but especially over those regions with higher magnitude DTR trends.
Further examination suggests that PW can largely explain about 40% or more ( r2 ≥ 0.40) of DTR changes over most of northwestern and Southeast China, most of southeastern China in winter, and across the whole of China in summer. A 1 K change in the DTR is associated with an opposite variation tendency of about 2% to 10% in PW for most areas of China. This relationship is also clearer over northwestern China both annually and in summer, as well as over southeastern China in winter.
For China as a whole, the long-term change in DTR is significantly anticorrelated with PW variation during the period 1970-2012 ( r= -0.42 to -0.75), with a d(PW)/ d(DTR) slope of -61% to -11.1% K-1. This result implies that long-term DTR change is associated with an opposite PW change and, by suggesting a slope of 7% K-1with a constant relative humidity, approximately follows the Clausius-Clapeyron equation ( Trenberth et al., 2003). However, these anticorrelations between PW and long- term DTR changes also possess seasonal dependency, being more significant in the warm season than in the cold season. Thus, it is possible that PW can be considered as one potential factor when exploring long-term DTR changes over China.
It is important to note that the findings reported in this paper are mainly of a statistical nature, based on independent high-quality surface observations of Tmin and Tmaxas well as homogenized sounding observations. However, the underlying physical processes responsible for the correlations between the DTR and PW remain unclear, being beyond the scope of the current study. It also remains unclear whether similar relations can be generalized to other regions. Hence, future studies should focus on examining the relationship between PW and long-term DTR changes, as well as their mechanisms of interaction, over large scales and based on multiple data sources; for instance, by employing global atmospheric reanalysis data and climate model simulations.
Acknowledgments. This work was funded by the National Basic Research Program of China (Grant No. 2012CB956203), the Strategic Priority Research Program-Climate Change: Carbon Budget and Relevant Issues of the Chinese Academy of Sciences (Grant No. XDA05090101), and the Climate Change Special Fund of the China Meteorological Administration: Atmospheric Water Vapor Changes in China and Its Causes (Grant No. CCSF201330).
Reference
| 1 |
|
| 2 |
|
| 3 |
|
| 4 |
|
| 5 |
|
| 6 |
|
| 7 |
|
| 8 |
|
| 9 |
|
| 10 |
|
| 11 |
|
| 12 |
|
| 13 |
|
| 14 |
|
| 15 |
|
| 16 |
|
| 17 |
|
| 18 |
|
| 19 |
|
| 20 |
|
| 21 |
|
| 22 |
|
| 23 |
|
| 24 |
|
| 25 |
|
| 26 |
|
| 27 |
|
| 28 |
|
| 29 |
|
| 30 |
|
| 31 |
|
| 32 |
|
| 33 |
|
| 34 |
|
| 35 |
|
| 36 |
|
| 37 |
|
| 38 |
|
| 39 |
|
| 40 |
|
| 41 |
|
| 42 |
|
| 43 |
|
| 44 |
|
| 45 |
|
| 46 |
|
| 47 |
|
| 48 |
|
| 49 |
|
| 50 |
|
| 51 |
|
| 52 |
|
| 53 |
|