
An Optical Disdrometer for Measuring Present Weather Parameters
[JIA Sheng-Jie1, 2 , LÜ Da-Ren1, *  , XUAN Yue-Jian
1 ]
, XUAN Yue-Jian|
|


A new present weather identifier (PWI) based on occlusion and scattering techniques is presented in the study. The present weather parameters are detectable by the meteorological optical range (MOR) approximately up to 50 km and by droplets with diameters ranging from 0.125 mm to 22 mm with velocities up to 16 m s-1. The MOR error is less than 8% for the MOR within 10 km and less than 15% for farther distances. Moreover, the size errors derived from various positions of the light sheet by the particles were checked within ± 0.1 mm ± 5%. The comparison shows that the MOR, in a sudden shower event, is surprisingly consistent with those of the sentry visibility sensors (SVS) with a correlation coefficient up to 98%. For the rain amounts derived from the size and velocity of the droplets, the daily sums by the PWI agree within 10% of those by the Total Rain Weighing Sensor (TRwS205) and the rain gauge. Combined with other sensors such as temperature, humidity, and wind, the PWI can serve as a present weather sensor to distinguish several weather types such as fog, haze, mist, rain, hail, and drizzle.
Present weather patterns are based on phenomena subjectively perceived by human observation according to standard codes defined by the World Meteorological Organization ( WMO; 2003, 2008). With the rapid development of technology, the automatic present weather identifier (PWI) provides an objective and a higher temporal resolution measurement of present weather parameters than those observed by humans ( Merenti-Välimäki and Hanna, 2001). In the present study, we examined vision-obscurity phenomena including fog, haze, and mist, mainly distinguished by meteorological optical range (MOR) and precipitation weather phenomena such as rain. Based on different principles, types of PWI can be mainly classified as imaging ( Anton and Witold, 2002), impact ( Joss and Waldvogel, 1967), and optical types ( Campbell, 2006). The two most common optical techniques are outlined in the following paragraphs.
The first is based on the scattering technique by measuring the scintillation at one or more angles as hydrometeors pass through the sample area; typical instruments are VPF730 and PWD22 ( Vaisala, 2005). However, it is noted that the size and terminal velocity parameters are only approximate and vary considerably when the hydrometeors entering the sample area by a method other than that followed the fixed algorithm ( Ellis et al., 2006).
The second is based on light-beam occlusion techniques by measuring the amplitude and duration of the light occluded from the light sheet and obtaining the actual size and terminal velocity; example instruments are the Particle Size and Velocity (Parsivel) ( Löffler-Mang and Joss, 2000) and Optical-Spectro Pluviometer (OSP) ( Hauser et al., 1984) disdrometers. However, their poor ability in distinguishing the small variations of receiving-light intensity causes visibility estimation within only 5 km ( OTT, 2010).
The advantages of occlusion and scattering techniques were introduced into the prototype PWI designed by the Institute of Atmospheric Physics (IAP), Chinese Academy of Sciences (CAS), named PWIAP. Particles were detectable in the diameter range of 0.125-22 mm, whereas the terminal velocities of up to 16 m s-1 and the MOR were distinguished up to approximately 50 km. In section 2, we introduce the hardware design of PWIAP. In section 3, the capabilities in identifying present weather parameters are checked in an application to 2012 and 2013 observational data. The final section presents a summary and some suggestions for future development of PWIAP.
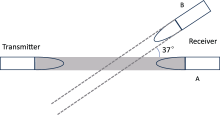
As shown in Fig. 1, PWIAP was designed with one transmitter and two receivers, and has the capability of measuring present weather parameters such as MOR, size and terminal velocity of droplets. The three units are on the same plane: receiver A lies opposite the transmitter, or opposite receiver (OR); and receiver B, hereinafter referred to as the scatter receiver (SR), receives light scattered through a 37° angle along the direction of the incident wave. In addition, a highly absorbent sponge has been added to the house heads of the three units to protect against drop splashing.
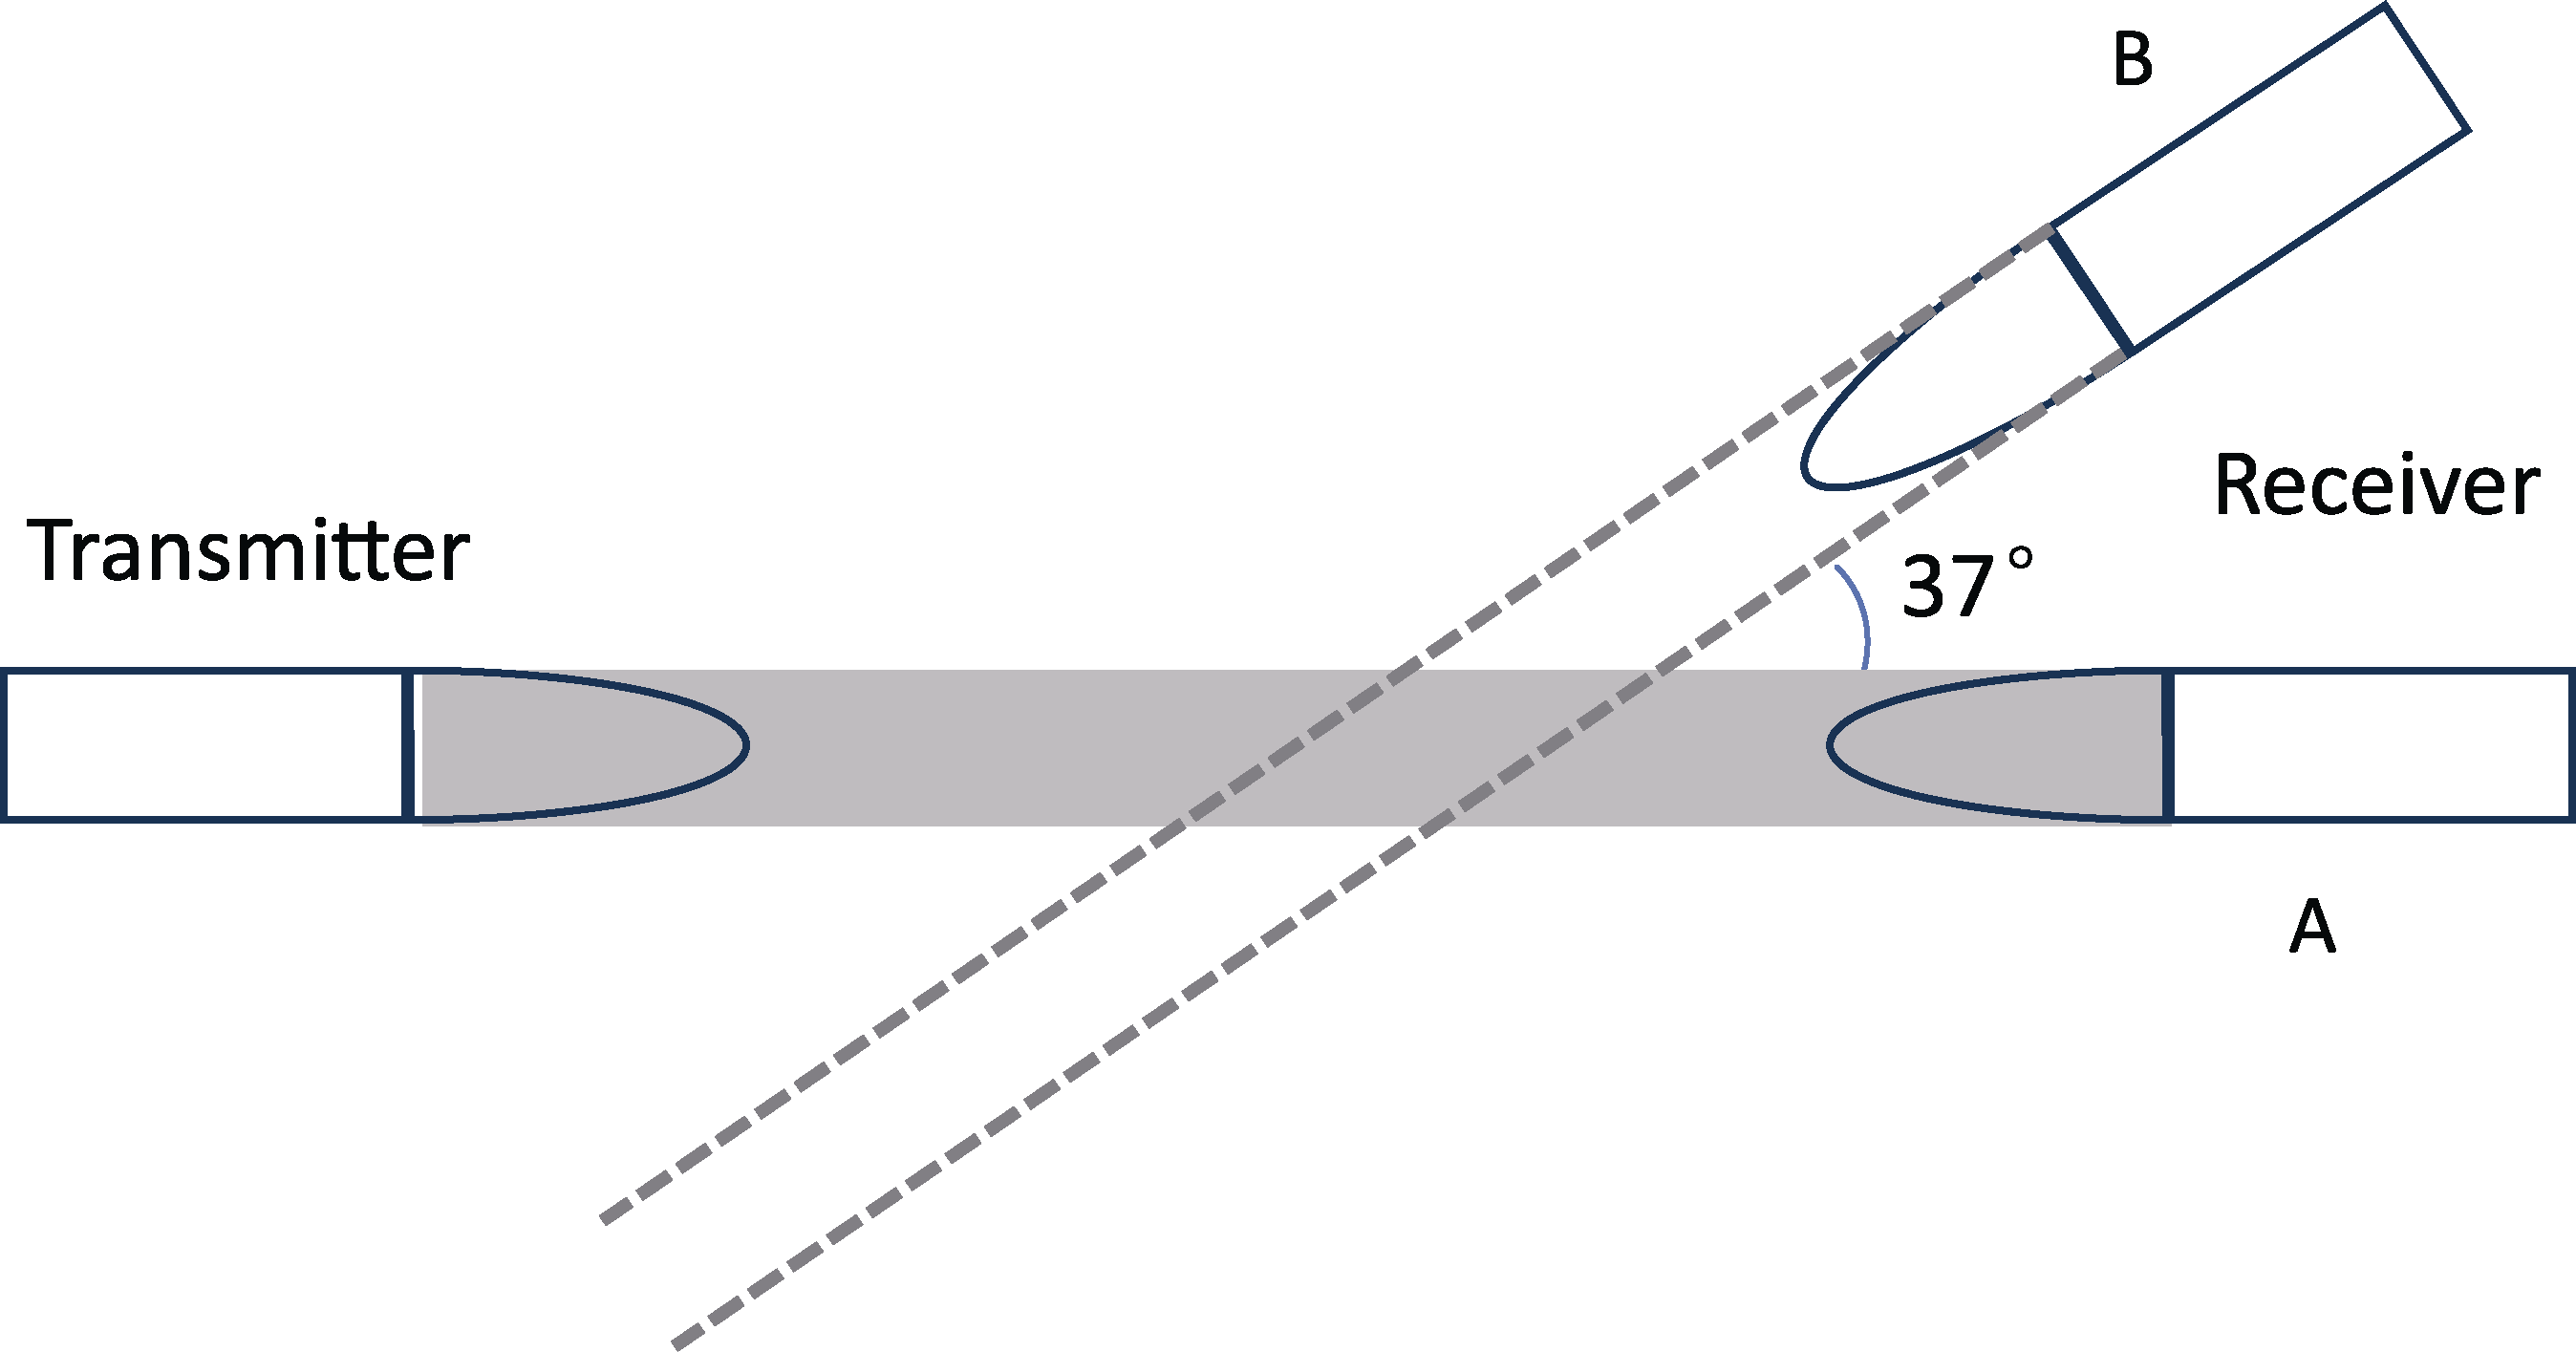 | Figure 1 Component arrangement from above of the proposed present weather identifier (PWIAP). |
The transmitter is constructed of an 830 nm laser diode(LD) with a power of 30 mW, a collimating lens, and a beam expander (10×). The laser is modulated by a 20 kHz transistor-transistor logic (TTL) signal and is coupled into the collimating lens by a single-mode fiber. The collimated beam then enters the expander for approximately 10 times expansion, and the outgoing circular beam has a spot diameter up to 22 mm. The detailed parameters are shown in Table 1.
| Table 1 Detailed parameters of the proposed PWIAP. |
The receivers are composed mainly of convex lenses, filters, and Positive-Intrinsic-Negative (PIN) junction structure silicon photodetectors. The convex lens converges the incident parallel light filtered by an 830 ± 5 nm filter onto the photosensitive surface of the PIN detector. The light signal is then converted into a voltage signal by a fast Analog to Digital (A/D) convertor in the main controller. The SR can receive parallel scattered beams with a diameter up to 60 mm, whereas the OR detects the direct incident sheet by a narrow slot within 22 mm (Width) × 1.5 mm (Height).
In the absence of droplets, the OR receives constant voltage, but when droplets pass through the sampling space, the voltage signal temporarily decreases. The deviation amplitude of the signal serves as a measurement of particle size, and the duration of the signal allows for an estimate of particle terminal velocity. Here, the signal attenuation dI from the light sheet received by the OR is expressed as dI = I0× ( s/S0), (1) where I0 is the light intensity of transmitter, s is the occlusion area caused by particles through the light sheet, and S0 is the area of the narrow slot. The equivalent spherical diameter d of a drop can be calculated from the maximum reduction of the signal, when a drop is assumed to be spherical. Moreover, the terminal velocity V of a drop can be outlined as V=( d + D) /t, (2) where D is the height of the slot (~ 1.5 mm) and t is the product between the time of each sample point multiplied by the sample number during the changing of the signal.
The signal duration and its amplitude can be automatically recorded, and the size and velocity of droplets can be calculated by using the acquisition software. In the non-spherical droplets case, such as single snowflakes, which may have rather complicated shapes, the spherical particle assumption is not well fulfilled. However, for the ensembles measured during the course of 1 min or more, the stochastical variation can be reduced. Detailed analysis of droplets with irregular shapes will be discussed in future work.
For calibration of the size and velocity of droplets, we adopted the method used by most optical disdrometers ( Hauser et al., 1984), and 19 different sizes of glass spheres and water droplets in size ranges from 0.13 mm to 6.2 mm were selected. Signals were measured after a free fall of droplets in air of 3 m above the sampling space in the laboratory. The typical voltage signals for various sizes of droplets were checked to determine the empirical relationships between the voltage signals and the droplet sizes. The error in estimating the diameter of droplets in the observation scale did not exceed ± 0.1 mm ± 5%. For the velocity measurements of particles, the errors were within 43% for the smaller droplets of less than 1 mm and 12% for larger droplets of more than 1 mm. This result occurred because the terminal velocities of the particles could not have all reached the balanced terminal velocity, and the non-spherical effects of the droplets were not obvious for the limitation of experimental height.
Because two or more droplets can occur in the light sheet, the error should be considered ( Raasch and Umhauer, 1984). Although it is negligible for normal rain, this error is less than 10% in extremely heavy stratiform rain events, whereas it is less than 5% in extremely heavy convective showers ( Löffler-Mang and Joss, 2000).
The SR detector with an optimal forward scattering angle is used to detect the MOR value. According to observed aerosol data from North China, Jia and Lü (2014) suggested that the optimal forward scattering angle should be set between 37° and 40°. This measurement is assumed to fulfill three hypotheses generated by Jia and Lü (2014). The scattering intensity I( q) from a fixed forward-scat-tering angle of atmospheric aerosol particles is expressed as I( q) =k × se830, (3) where k is the measuring constant, se830 is the scattering coefficient for a wavelength of 830 nm, and the subscript e is extinction.
Obviously, I( q) increases with a linear dependence on se830. It is noted that the wavelength of PWIAP is 830 nm, not 550 nm. According to Roberto (2005), se830 can be expressed as se830 =(550/830) q× se550, (4) where se550 is the scattering coefficient at 550 nm and q is a variable from MOR. The MOR can then be expressed as ( Koschmieder, 1924) MOR = -ln t/se550, (5) where t is the contrast threshold of human visual, which is generally set to 0.05 ( WMO, 2008).
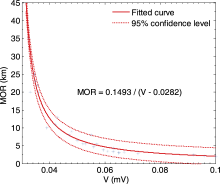
Therefore, by combining Eqs. (3)-(5), the MOR can be directly checked from the scattering intensity I( q). However, due to the machine noise, the MOR calculated by Koschmieder (1924) generally is not consistent with the actual MOR, particularly on a clear day with a high MOR value. To further improve the measurement accuracy, the following model was used to fit the observed value: MOR = a/( V + b), (6) where V is the voltage value from the SR detector, and a and b are the empirical parameters.
To reduce the uncertainty of judgment for high MOR values, artificial observed data at 1200/1300/1400 Local Standard Time (LST) from 6 to 18 April 2012 was chosen for the fully mixed air. It is shown in Fig. 2 that the empirical parameter a is 0.1493, whereas b is -0.0282. The relative error is less than 8% for MOR less than 10 km, and less than 15% for that greater than 10 km. However, due to the noise level, the maximum range of the MOR is approximately 50 km, and the lowest theoretical limitation is approximately 1.49 cm, while the maximum received voltage is 10 V.
To evaluate the capability for measuring actual weather parameters, the MOR and the precipitation amount derived from the sizes and velocities of the droplets are checked with standard instruments in section 3.
The precipitation experiment was simultaneously conducted with PWIAP, a TRwS205 weighting pluviometer ( MPS, 2012) and a tipping-bucket rain gauge ( Zhonghuan Tig, 2012), which were placed at a 60 cm distance apart on the roof of Building No. 40 at the IAP in Beijing from 1 August to 31 October 2013.
 | Figure 2 Scatterplots of the artificial observation meteorological optical range (MOR) versus measurement voltage by the proposed PWIAP during 6-18 April 2012. Asterisks show the observed MOR. The solid line is the fitted empirical curve of the data points, and the dashed line is beyond 95% confidence level. |
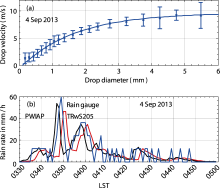
A comparison of rainfall observations is presented for the three instruments in Fig. 3b. A strong convective event occurred in the morning of 4 September 2013, between 0330 and 0500 LST, reaching maximum rain rates of more than 40 mm h-1. In Fig. 3a, each class of droplet diameter versus the average velocity and its variance is plotted. The solid line in Fig. 3a also shows the empirical relation from Atlas et al. (1973) after measurements from Gunn and Kinzer (1949). The measurement mean values significantly agreed with the empirical curve when the diameter of the droplets was more than 0.4 mm. However, the velocity of droplets with diameters of less than 0.4 mm was abnormally higher than the empirical value, and the variance was also somewhat higher than the other size intervals. This phenomenon may have been caused by air turbulence near the ground. The breakup of large droplets and the partially trapped droplets, also known as the edge effect, conducted by the turbulence may have influenced the detected fall velocity ( Guillermo et al., 2009), and could have led to an underestimated result.
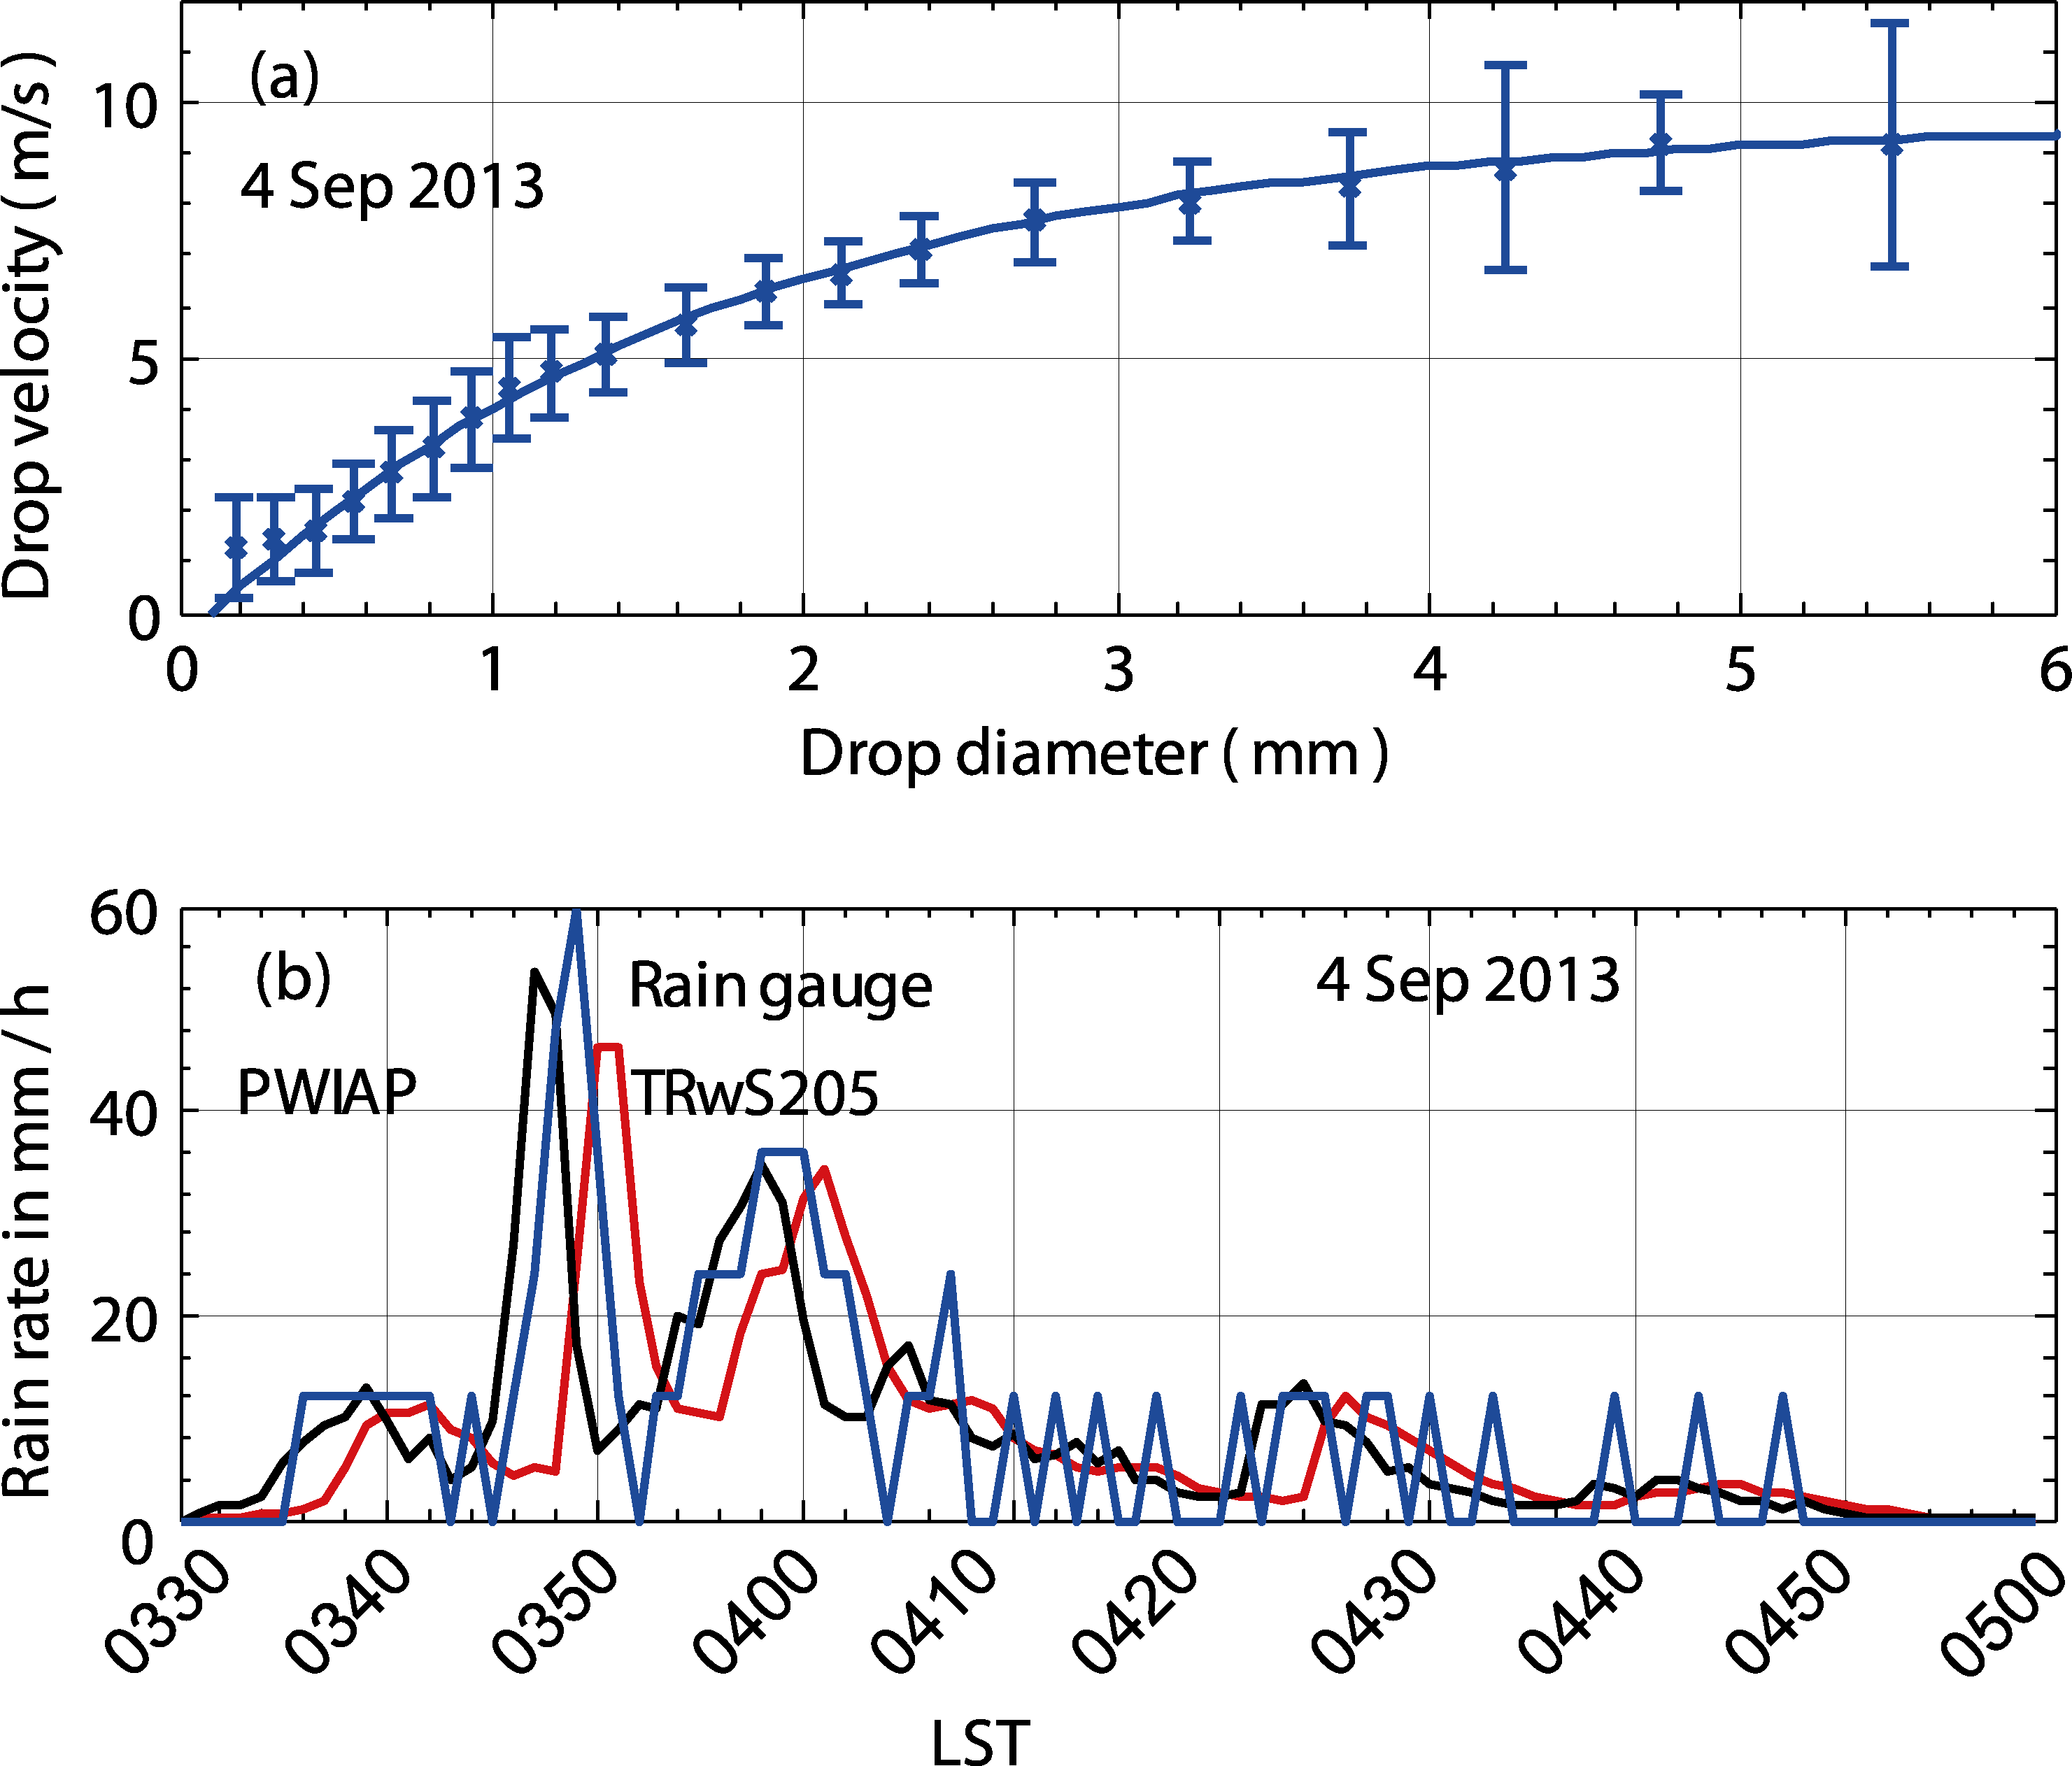 | Figure 3 (a) Scatterplot of the fall velocity of the drops measured by the proposed PWIAP as a function of diameter on 4 September 2013 LST. Crosses show the mean arithmetic velocity, and vertical bars cover the mean arithmetic velocity of one standard deviation. The solid line shows the empirical fall velocities derived from Atlas et al. (1973) after Gunn and Kinzer (1949). (b) Time series of rain rates during 0330-0500 4 September 2013 LST. A comparison is given for PWIAP (black line), the tipping-bucket rain gauge (blue line), and the TRwS205 (red line). |
For remote-sensing applications, this effect for high- velocity small droplets is neglected ( Leijnse and Uijlenhoet, 2010). However, the variance of the velocity of the large droplets, with diameters greater than 4 mm, was up to 25% of the measured value due to the rapidly decreased sample numbers of the droplets.
In Fig. 3b, the trends for the rain rates (mm h-1) measured by PWIAP are similar to those of the TRwS205 and the rain gauge, although the detailed changes show higher clarity. It is noted that the extremely heavy rain rates beyond the rain gauge��s ability cause a high error of observation for the abnormally high skip velocity of the tipping bucket. However, the quantitative agreement between PWIAP and TRwS205 were quite good, considering the TRwS205 has a delay of approximately 4 min.
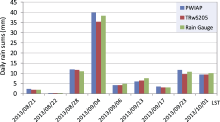
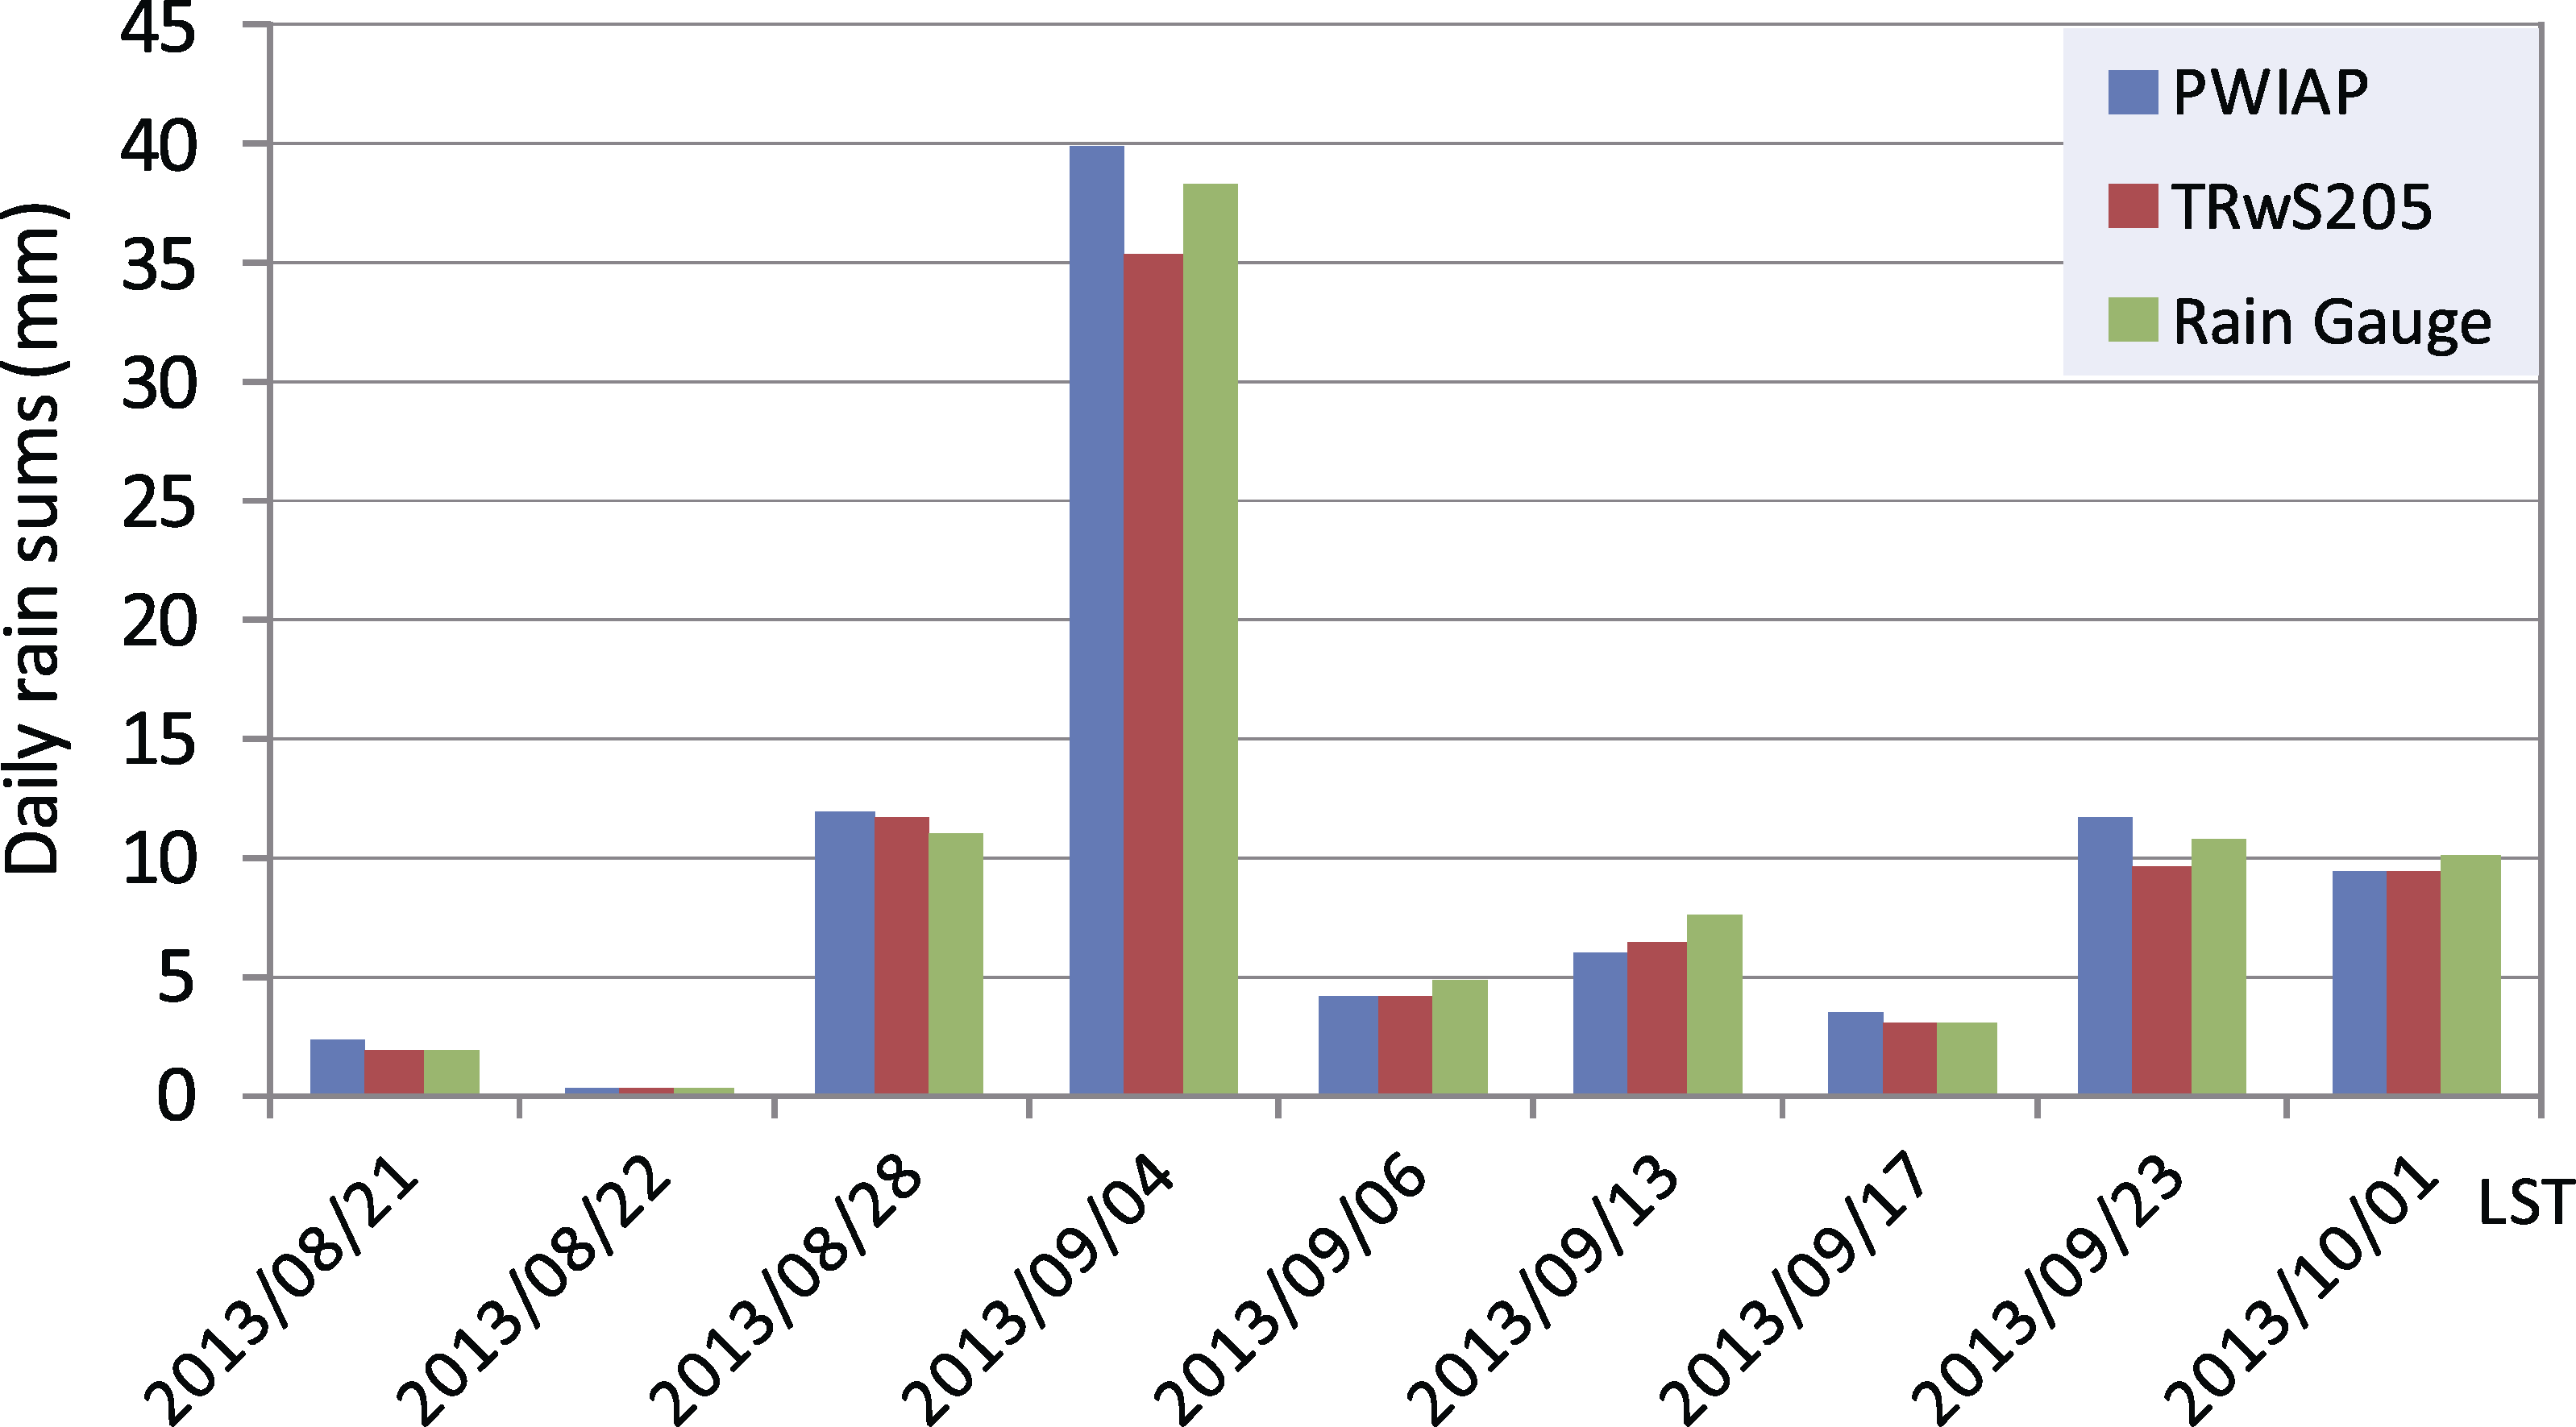 | Figure 4 Daily rainfall comparison of the proposed PWIAP (blue), the tipping-bucket rain gauge (green), and the TRwS205 (red) for 1 August to 31 October 2013. |
The three methods of daily rain are compared in Fig. 4. For most of the days, the results of the three methods agree within 10%. In five out of nine cases, the TRwS205 showed slightly smaller (10%) values than PWIAP and the rain gauge, which may have been due to the effect of evaporation. Despite the high precision of weight (~ 0.001 mm), the rainfall was undetectable by TRwS205, whereas the rain amount was less than the evaporation.
According to Eqs. (3)-(6) in section 2.2.2, we can directly obtain the MOR data from the raw voltage of PWIAP. Figure 5 shows the MOR data collected by PWIAP and the SVS instrument ( Environment TECH, 2011) located approximately 10 m from PWIAP during 25 May to 7 June 2012, on the roof of No. 40 building at the IAP in Beijing. The 15 min average visibility observation of PWIAP and the SVS are shown in Fig. 5. The two instruments agreed well for most of the periods, except for those with local fluctuations of haze, such as the days of 27-29 May. Moreover, abnormal values under artificial maintenance, such as the day of 1 June, could have led to some discrepancies. Particularly after rainfall from 1400 to 1600 on 3 June 2012, the two instruments exhibited very good performances under the sudden change of the MOR, and the correlation coefficient reached up to 98%. MOR larger than 10 km was not compared due to limitations of the SVS visibility meter.
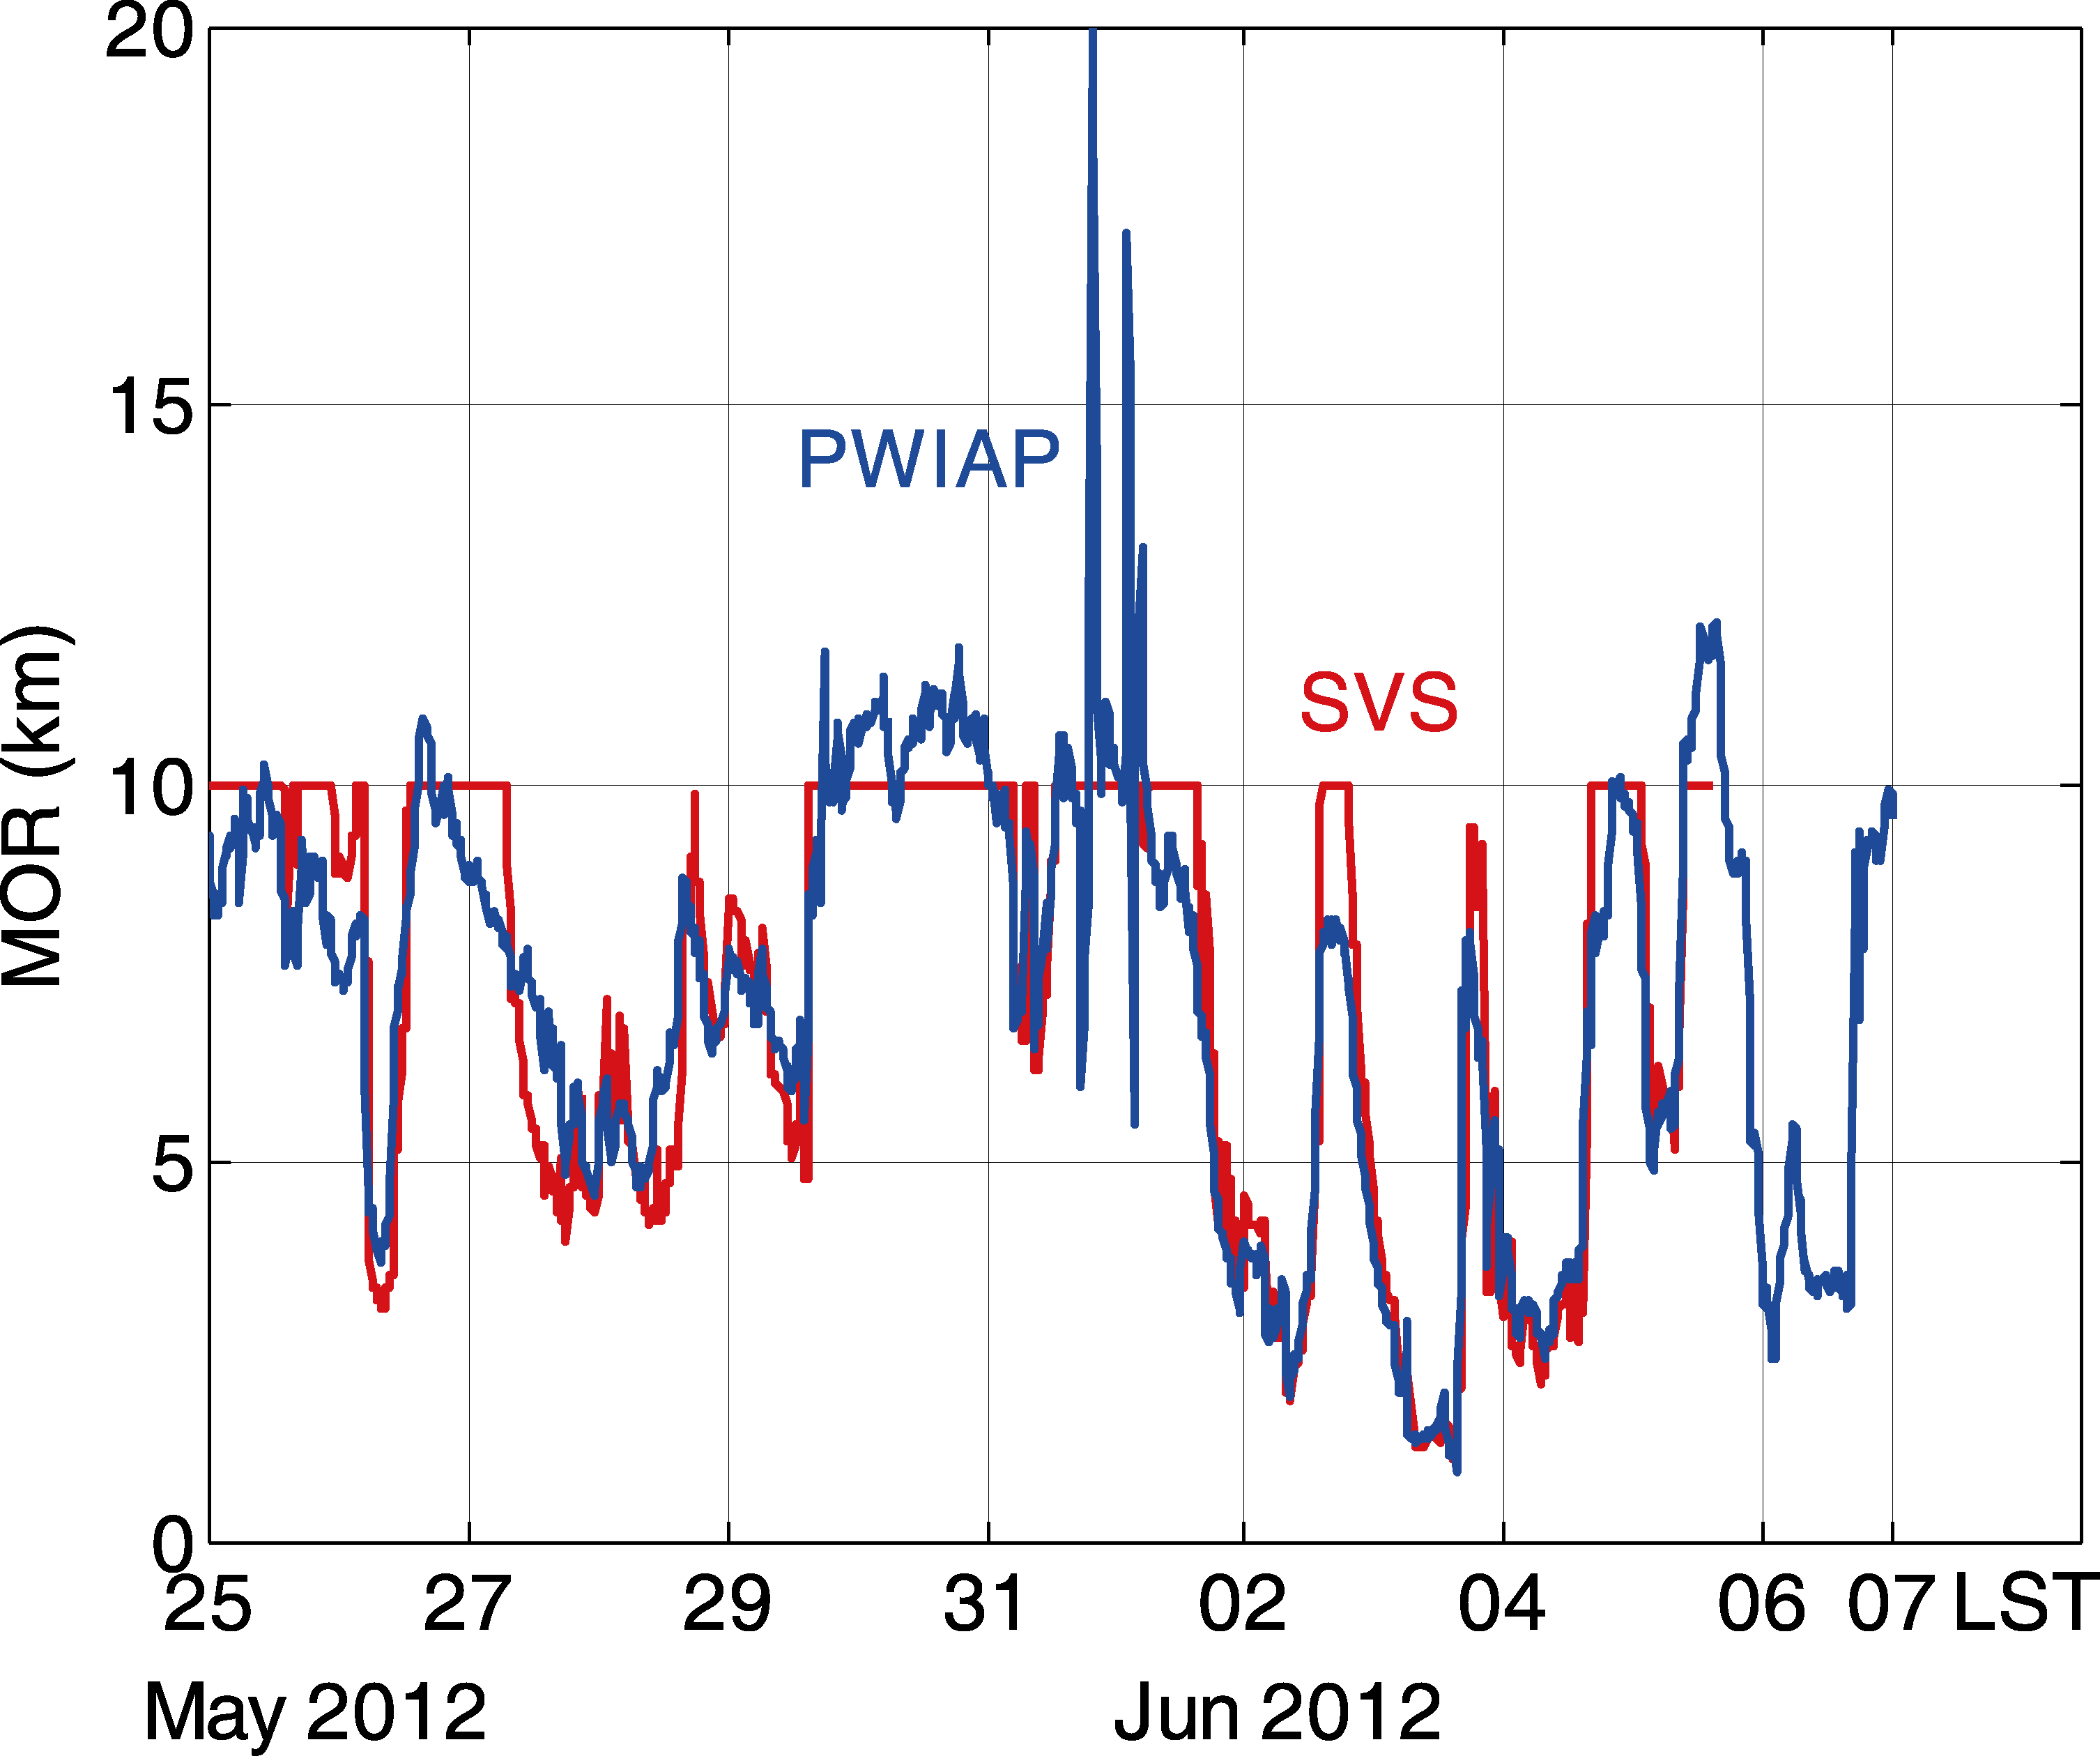 | Figure 5 Comparison of MOR for PWIAP (blue) and the SVS (red) for 25 May to 7 June 2012. |
This study introduced a new PWI instrument, PWIAP, based on occlusion and scattering techniques. The composition, measurement principle, and calibration of PWIAP have been described in this paper. In addition, a comparison with standard instruments showed the ability to measure the size and terminal velocity of the hydrometeors and MOR. The conclusions of this study can be summarized as follows:1) It is possible that, despite the inhomogeneous light source energy of the Gauss distribution, the uncertainty caused by the hydrometeor through the various positions of the sample area will be greatly reduced by the narrow slot of less than 22 mm. The error in estimating the diameter in the entire range of PWIAP does not exceed ± 0.1 mm ± 5%. Due to the limitations of the experimental height, the error of velocity observation is within 43% for smaller droplets of less than 1 mm and 12% for larger droplets of more than 1 mm.
2) The SR, fixed in an optimal forward-scattering angle, receives the scattering parallel beam and can improve the measurement precision. The measurement error for the SR is less than 8% for MOR within 10 km and less than 15% for that farther than 10 km. Moreover, the theoretical dynamic range of the SR is up to 60 dB for the detecting voltage range from 0.03 mV to 10 V. However, due to the noise level of the instrument, the maximum range of the MOR is approximately 50 km, and the lowest theoretical limitation is approximately 1.49 cm, which requires additional study for validation.
3) The rain experiments show that the abnormally high velocity of the droplets, with diameters of less than 0.4 mm, may be caused by air turbulence near the ground for the breakup of large droplets and the edge effect. The daily rainfall observed by PWIAP agreed well with that by TRwS205 and the rain gauge during the three-month experiment with a relative bias of less than 10%. In this respect, PWIAP can serve as an automatic rain gauge in the future.
4) The MOR experiment showed good agreement with other instruments such as SVS. Particularly during sudden shower events, the two instruments exhibited very good performance with a 98% correlation coefficient. When rain events with fog are present, particularly a heavy rain event, information concerning the number and types of droplets can be used to improve the visibility estimate.
This paper has introduced the basic design of PWIAP. A comparison of measurements with PWIAP and more PWIs by other manufacturers for haze, fog or rain, snow, and other solid precipitation events will be conducted in the near future. Moreover, like Parsivel ( Löffler-Mang and Joss, 2000) and PWS100 ( Ellis et al., 2006), additional measurements such as temperature, relative humidity, and wind should be combined to distinguish present weather. However, such methods are beyond the scope of the present study.
Acknowledgements. This study was supported by Automatic Observation System for Cloud, Visibility and Weather Phenomena (Grant No. GYHY200806031) and Carbon Satellites Verification Systems and Comprehensive Observations (Grant Nos. GJHZ1207 and XDA05040302).
| 1 |
|
| 2 |
|
| 3 |
|
| 4 |
|
| 5 |
|
| 6 |
|
| 7 |
|
| 8 |
|
| 9 |
|
| 10 |
|
| 11 |
|
| 12 |
|
| 13 |
|
| 14 |
|
| 15 |
|
| 16 |
|
| 17 |
|
| 18 |
|
| 19 |
|
| 20 |
|
| 21 |
|