

A Climatology of the Southwest Vortex during 1979-2008
[ZHONG Rui1 , ZHONG Lin-Hao2, *  , HUA Li-Juan
3 , FENG Shi-De4 ]
, HUA Li-Juan|
|


Using a new vortex detection and tracing method, a dataset of the Southwest Vortex (SWV) is established based on Japanese 25-year Reanalysis (JRA-25) reanalysis data during 1979-2008. The spatiotemporal features of the SWV are derived from the dataset. In comparison to other seasons, summer yields the least SWVs, but with the highest probability that they will migrate from their region of origin. SWVs mostly emerge in the southwest of the Sichuan Basin and the southeast of the Tibetan Plateau. Migratory SWVs mainly move along either an eastward or southeastward path. Detailed composite analysis of warm-season SWVs shows that the subtropical high is a key factor in determining the direction of migratory SWVs. Furthermore, the steering wind at 700 hPa dominates the moving direction of migratory SWVs. Potential stability diagnosed by pseudo-equivalent potential temperature is of certain significance for the evolution and movement of SWVs. On the other hand, migratory SWVs possess relatively greater strength than stationary SWVs, due to a stronger low-level jet with enhanced baroclinicity and moisture transport providing more energy to support the growth of SWVs along their paths of movement.
The Southwest Vortex (SWV) is a mesoscale cyclonic synoptic system which is impacted by the Tibetan Plateau, Hengduan Mountains, and Sichuan Basin ( Chen et al., 2007). The horizontal scale of the SWV is about 300-500 km. Its cyclonic circulation is mostly found at the pressure level of 700 or 850 hPa in Southwest China, and is a mesoscale system often associated with severe weather over the Sichuan Basin ( Wang et al., 1993). Under favorable conditions (spring and summer, especially), the SWV may move out from the Sichuan Basin and lead to heavy rainfall and thunderstorms in downstream areas, such as the Yangtze River, Huaihe River Basin, and even North China ( Chen et al., 2003; Jiang et al., 2004; Zhao and Fu, 2007).
A great number of statistical studies of the SWV have been carried out based on observation or reanalysis data ( Ding and Lü, 1991; Chen, 2007; Chen et al., 2003, 2007; Shen and He, 2008; Gao et al., 2009; Pan et al., 2011), in which a significant seasonal variation has been found in terms of the frequency of SWV occurrence. The interaction of the background flow and the Tibetan Plateau is one of the main reasons for the formation of the SWV. In particular, the low-level jet plays an important role in the formation and development of the SWV ( He, 2012). On the other hand, the meridional shift of the high-level jet has also been found to relate to the frequency of SWV occurrence ( Gao et al., 2009), i.e., a southward shift is conducive to SWV genesis. The divergence of the large-scale background flow and the latent heat release are another two factors that have a major impact on the development of the SWV ( Kuo et al., 1988; Chen, 1989).
However, some contradictory results can nevertheless be found among these previous studies, even for the seasonal distribution of the SWV ( Chen et al., 2007; Shen and He, 2008). In fact, to date, there is no universal definition of the SWV. As a result, the features of its seasonal distribution are still under debate. Furthermore, most previous studies of the SWV have mainly been based on analyses of specific cases or relatively few samples, and thus lack a strong representation of the climatological picture. In particular, the basic characteristics associated with the factors dominating the SWV's migration and its relationship with larger-scale systems deserve further investigation based on larger datasets. We aim to address this knowledge gap in the current paper.
The Japan Meteorological Agency (JMA) reanalysis (JRA-25) data spanning from 1979 to 2008 are used in this study. This dataset is a global long-range reanalysis dataset produced by the data assimilation and forecast system of the JMA ( Onogi et al., 2007). The horizontal resolution is 1.25° (latitude) × 1.25° (longitude)-equiva-lent to a horizontal grid size of around 120 km-and 40 vertical pressure levels from 1000 to 0.4 hPa. In terms of the temporal resolution, the data are recorded four times a day. This study uses the JRA-25 reanalysis as the basic dataset mainly because it is relatively higher in quality for Asia, as compared to other regions.
In order to extract the SWV quantitatively from the reanalysis, a new vortex detection and tracing method is used in this work. Gao et al. (2009) extracted this information by simply identifying the closed isoline at 700 hPa and using it to define the SWV. However, this method requires high-resolution data and suffers from too much subjective influence. Another method involves considering the low-pressure center and the closed isoline at 700 and 850 hPa ( Chen et al., 2007). These two methods do not, however, consider the strength of the SWV, nor its divergence field. Additionally, the tilting of the physical quantities should be considered in methods of vortex detection. Hart (2003) and Zhong et al. (2009) used a scheme to produce the tropical cyclone tracks based on reanalysis data, and this method can be easily extended to detect and trace the SWV. In this work, the studied region is confined to the SWV activity in (20-50°N, 100-130°E). In this region, a Barnes filter ( Barnes, 1964) is first used to exclude the large-scale circulation. Then, the resulting mesoscale divergence/relative vorticity fields at 700 and 850 hPa are used to detect and trace low/high-value centers.
To determine the threshold of the relative vorticity of the SWV, the intensity distribution of 11 cases during 1979-2008 presented in previous research ( Jiang et al., 2004; Yang et al., 2001, 2006; Chen et al., 2003; Xu, 2003; Zhao and Fu, 2007; Lu et al., 2010) are investigated (Fig. 1). From the relative vorticity distribution at 700 hPa throughout the life cycles of the 11 recorded SWVs, the relative vorticity is higher than 0.8 × 10⁻⁵ s-1 at more than 85% of the time levels (200 of 225 time levels). Therefore, to avoid including excessively weak vortices, this value is used in the present study as the threshold value for vortex detection.
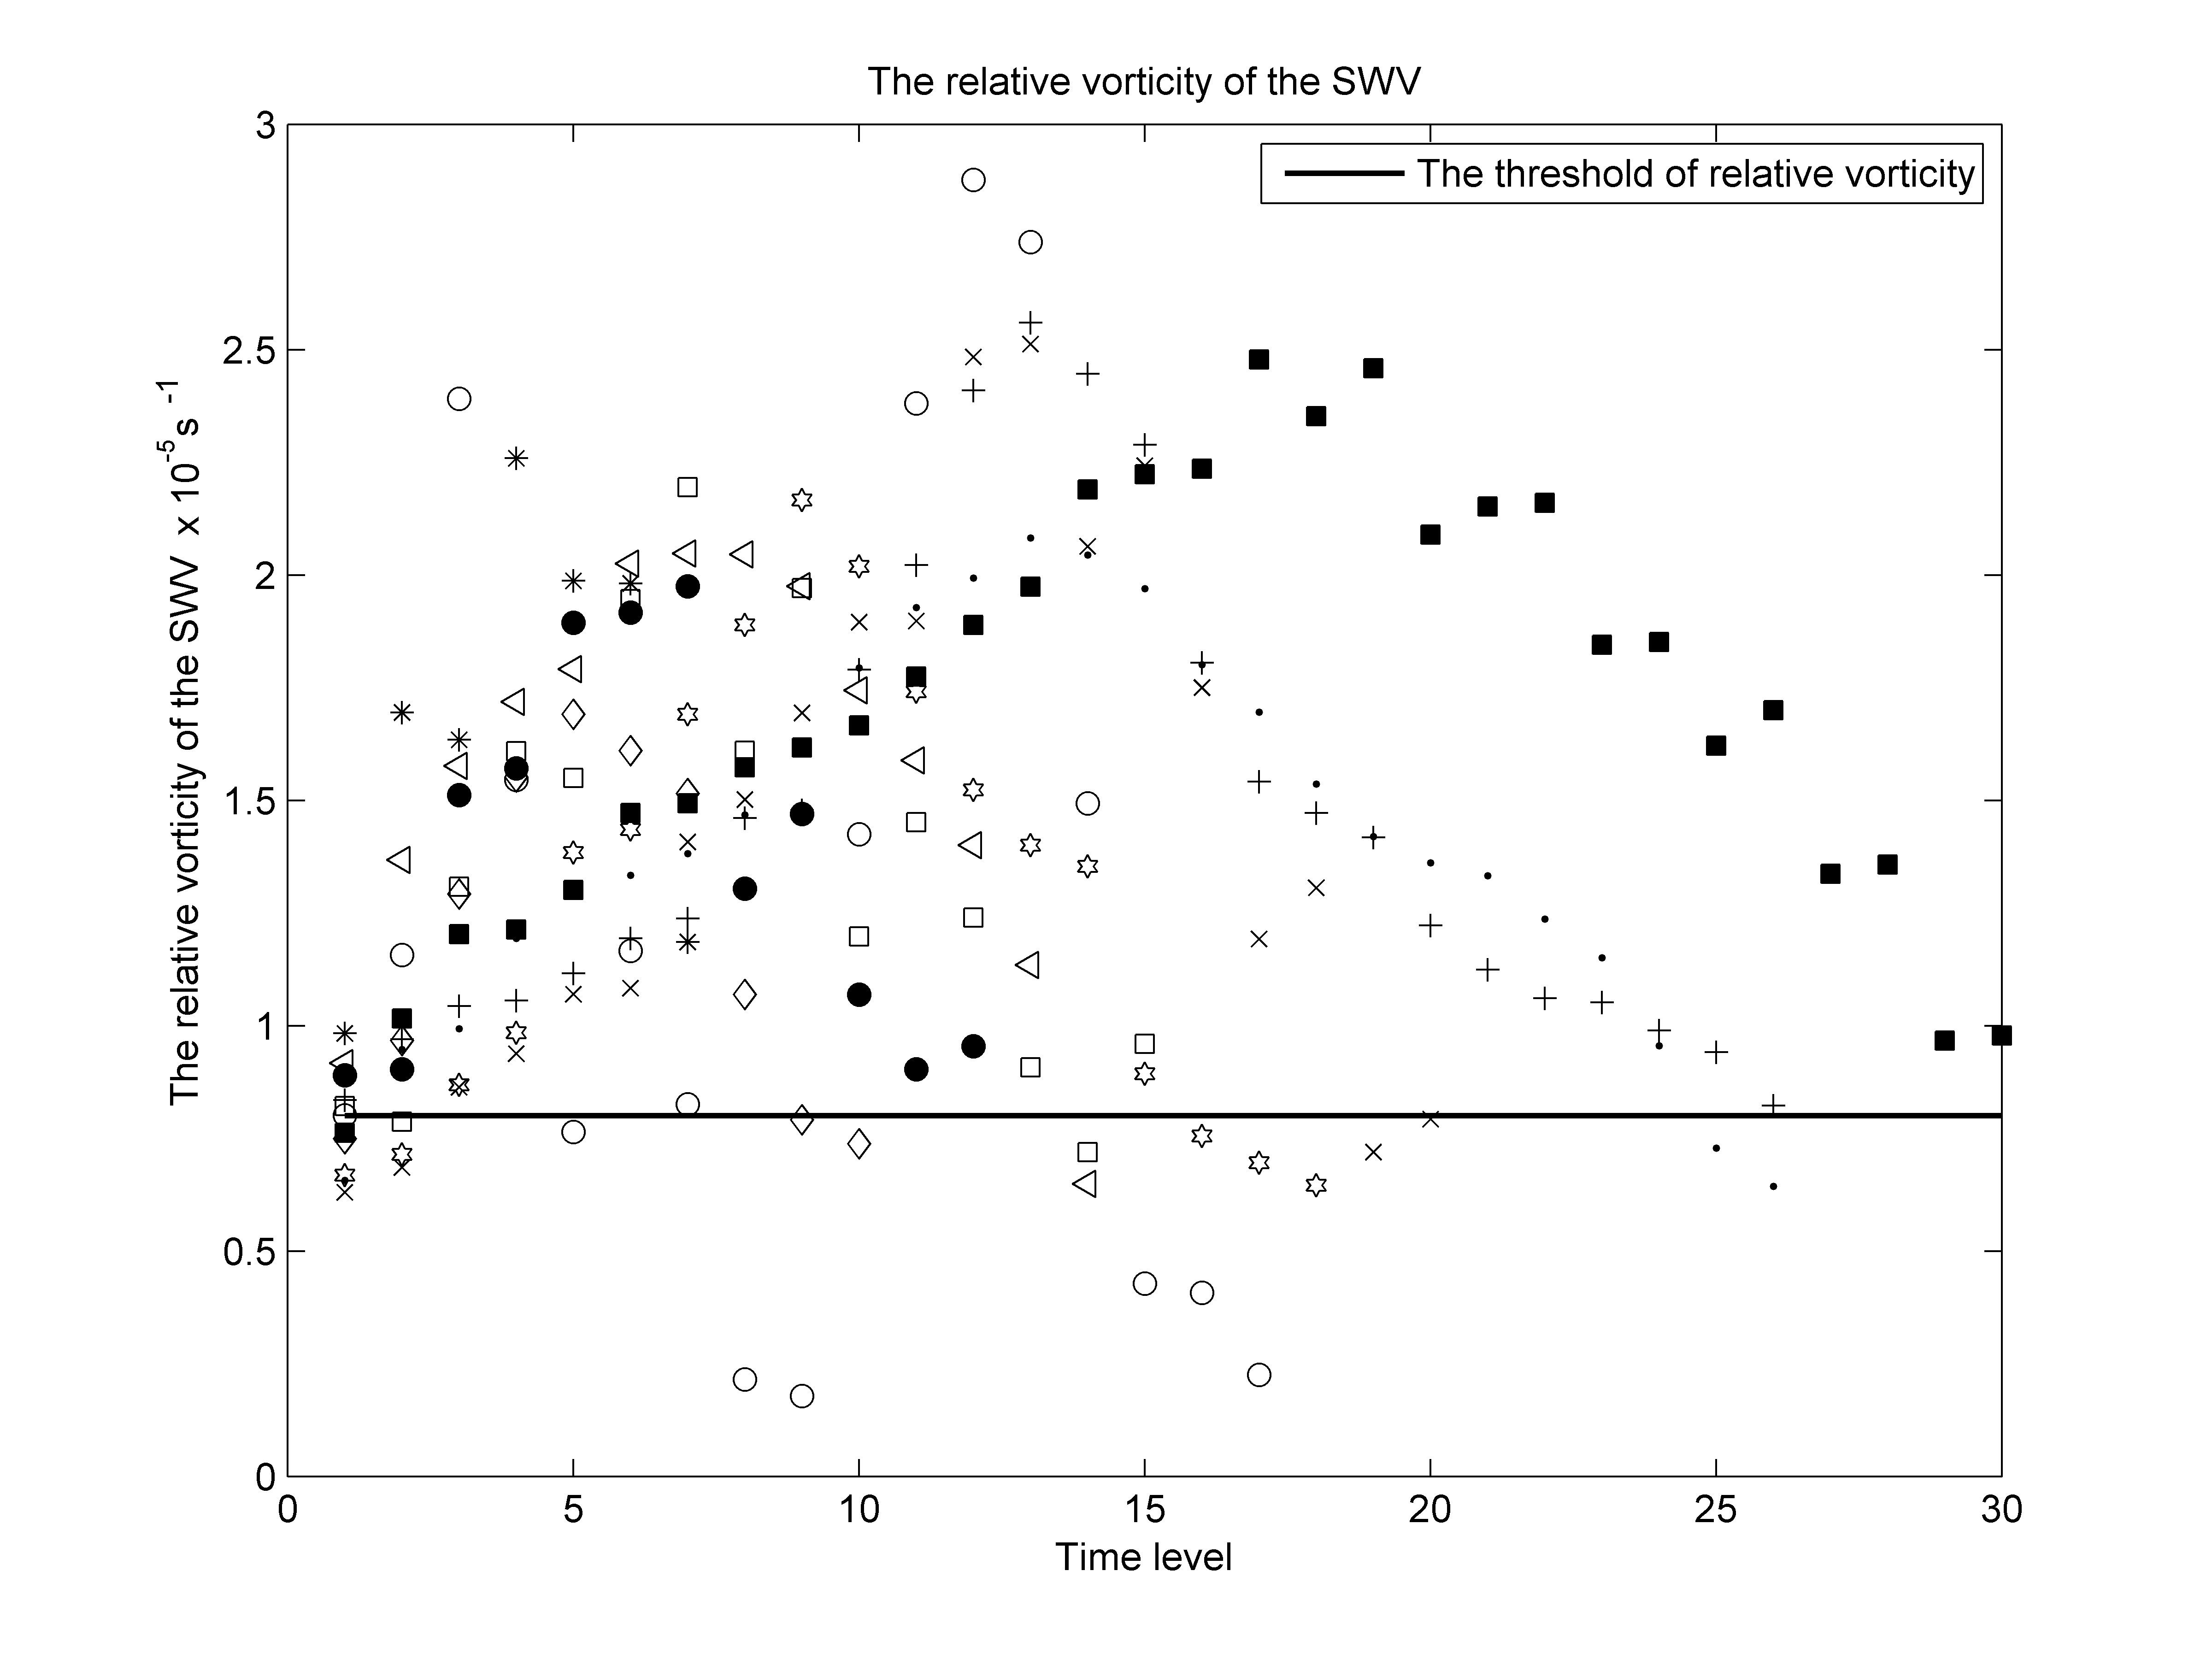 | Figure 2 Figure 1 Distribution of the relative vorticity of typical SWVs. The horizontal line is the threshold value of 0.8 × 10⁻⁵ s-1. The open circles, asterisks, open triangles, solid circles, crosses, solid triangles, plus signs, dots, diamonds, left-pointing triangles, and hexagons represent the relative vorticity of the SWV on 8 July 1989, 5 July 1991, 27 June 1998, 30 June 1998, 3 July 1998, 1 July 2000, 2 September 2004, 2 July 2007, 8 July 2007, 16 July 2007, and 11 June 2008, respectively. |
The vortex detection step differs from previous studies ( Hart, 2003; Chen et al., 2007; Gao et al., 2009) in that the centers at different pressure levels in a horizontal 5° × 5° box are included. In these possible centers, only the one with the maximal value is regarded as the vortex at each pressure level. This differs from the method in which only the centers at the same horizontal location are considered. The method used here permits the centers of the same vortex to be located in different horizontal positions in the 5° × 5° box, which to some extent considers the titling structure along the vertical axis of the vortex. As a result of this, some vortices with tilting structures not regarded as SWVs according to previous methods can be extracted in this work.
Using the above method, a total of 1773 SWVs are extracted from the reanalysis during 1979-2008, which is an average of 59.1 vortices each year. This number differs from the 38.4 per year reported by Gao et al. (2009) and the 69.2 per year in Chen et al. (2007). The different criteria applied in our method are responsible for the result. The method simultaneously considers the relative vorticity field, divergence field, and the closed isoline at 850 hPa; the greater number of constrains results in fewer SWVs being detected in our work compared to that of Chen et al. (2007). The maximum number of vortices in the 30-year study period is 80, in 2005, while the minimum number (37) of SWVs appears in 1999. The frequency of occurrence seems to possess decadal variability (figure omitted).
For the seasonal distribution (Fig. 2a), on average there are 671, 330, 217, and 555 SWVs in spring (March to May), summer (June to August), autumn (September to November), and winter (December to next February), respectively. SWVs mostly occur in spring and winter, which account for 69.5% of the total number. The minimum number (37) of SWVs occurs in August and the maximum (80) is found in March. This is similar to the result of Shen and He (2008), but quite different from that of Chen et al. (2007). One possible reason is, as mentioned above, that our method can identify those SWVs possessing physical quantities with a tilting vertical structure. Furthermore, a greater number of SWVs in winter have that vertical structure. This results in a seasonal distribution that is contrary to that of Chen et al. (2007), although more SWVs were found per year in their work.
According to previous studies, there are two major birthplaces of SWVs; namely, the Sichuan Basin ( Chen et al., 2004) and Jiulong (around (29.5°N, 101°E)) (Shen and He (2008). Based on the SWV dataset established in this work, the two main birthplaces of SWVs are the southeast of the Tibetan Plateau (around (30°N, 100°E)) and the southwest of the Sichuan Basin (around (30°N, 103.75°E)). The Sichuan Basin is the most important locality for SWVs, accounting for 56.40% of all the SWVs during 1979-2008. This coincides with the result of Chen et al. (2004). The secondary genesis location is in the southeast of the Tibetan Plateau, which accounts for 17.03% of all SWVs. Additionally, there are 64 (3.6%) SWVs that originate in the north of the Sichuan Basin (around (32.5°N, 105°E)). Controlled by the prevailing wind and water vapor transport, the birthplace distribution shows remarkable seasonal variation. Under the summer monsoon from the southwest during summer and fall, the SWVs tend to generate in a southwest-northeast band region from the southeast of the Tibetan Plateau to the southern slope of the Daba Mountains at about 34°N, located in the north of the Sichuan Basin (figure omitted). However, in winter and spring, most SWVs originate in a zonal region along the southern portion of the Sichuan Basin. This north-south shift suggests that the seasonal variation of the northern and southern branches of the Tibetan Plateau flow, as well as the southwest monsoon from the ocean, are key factors for SWV generation.
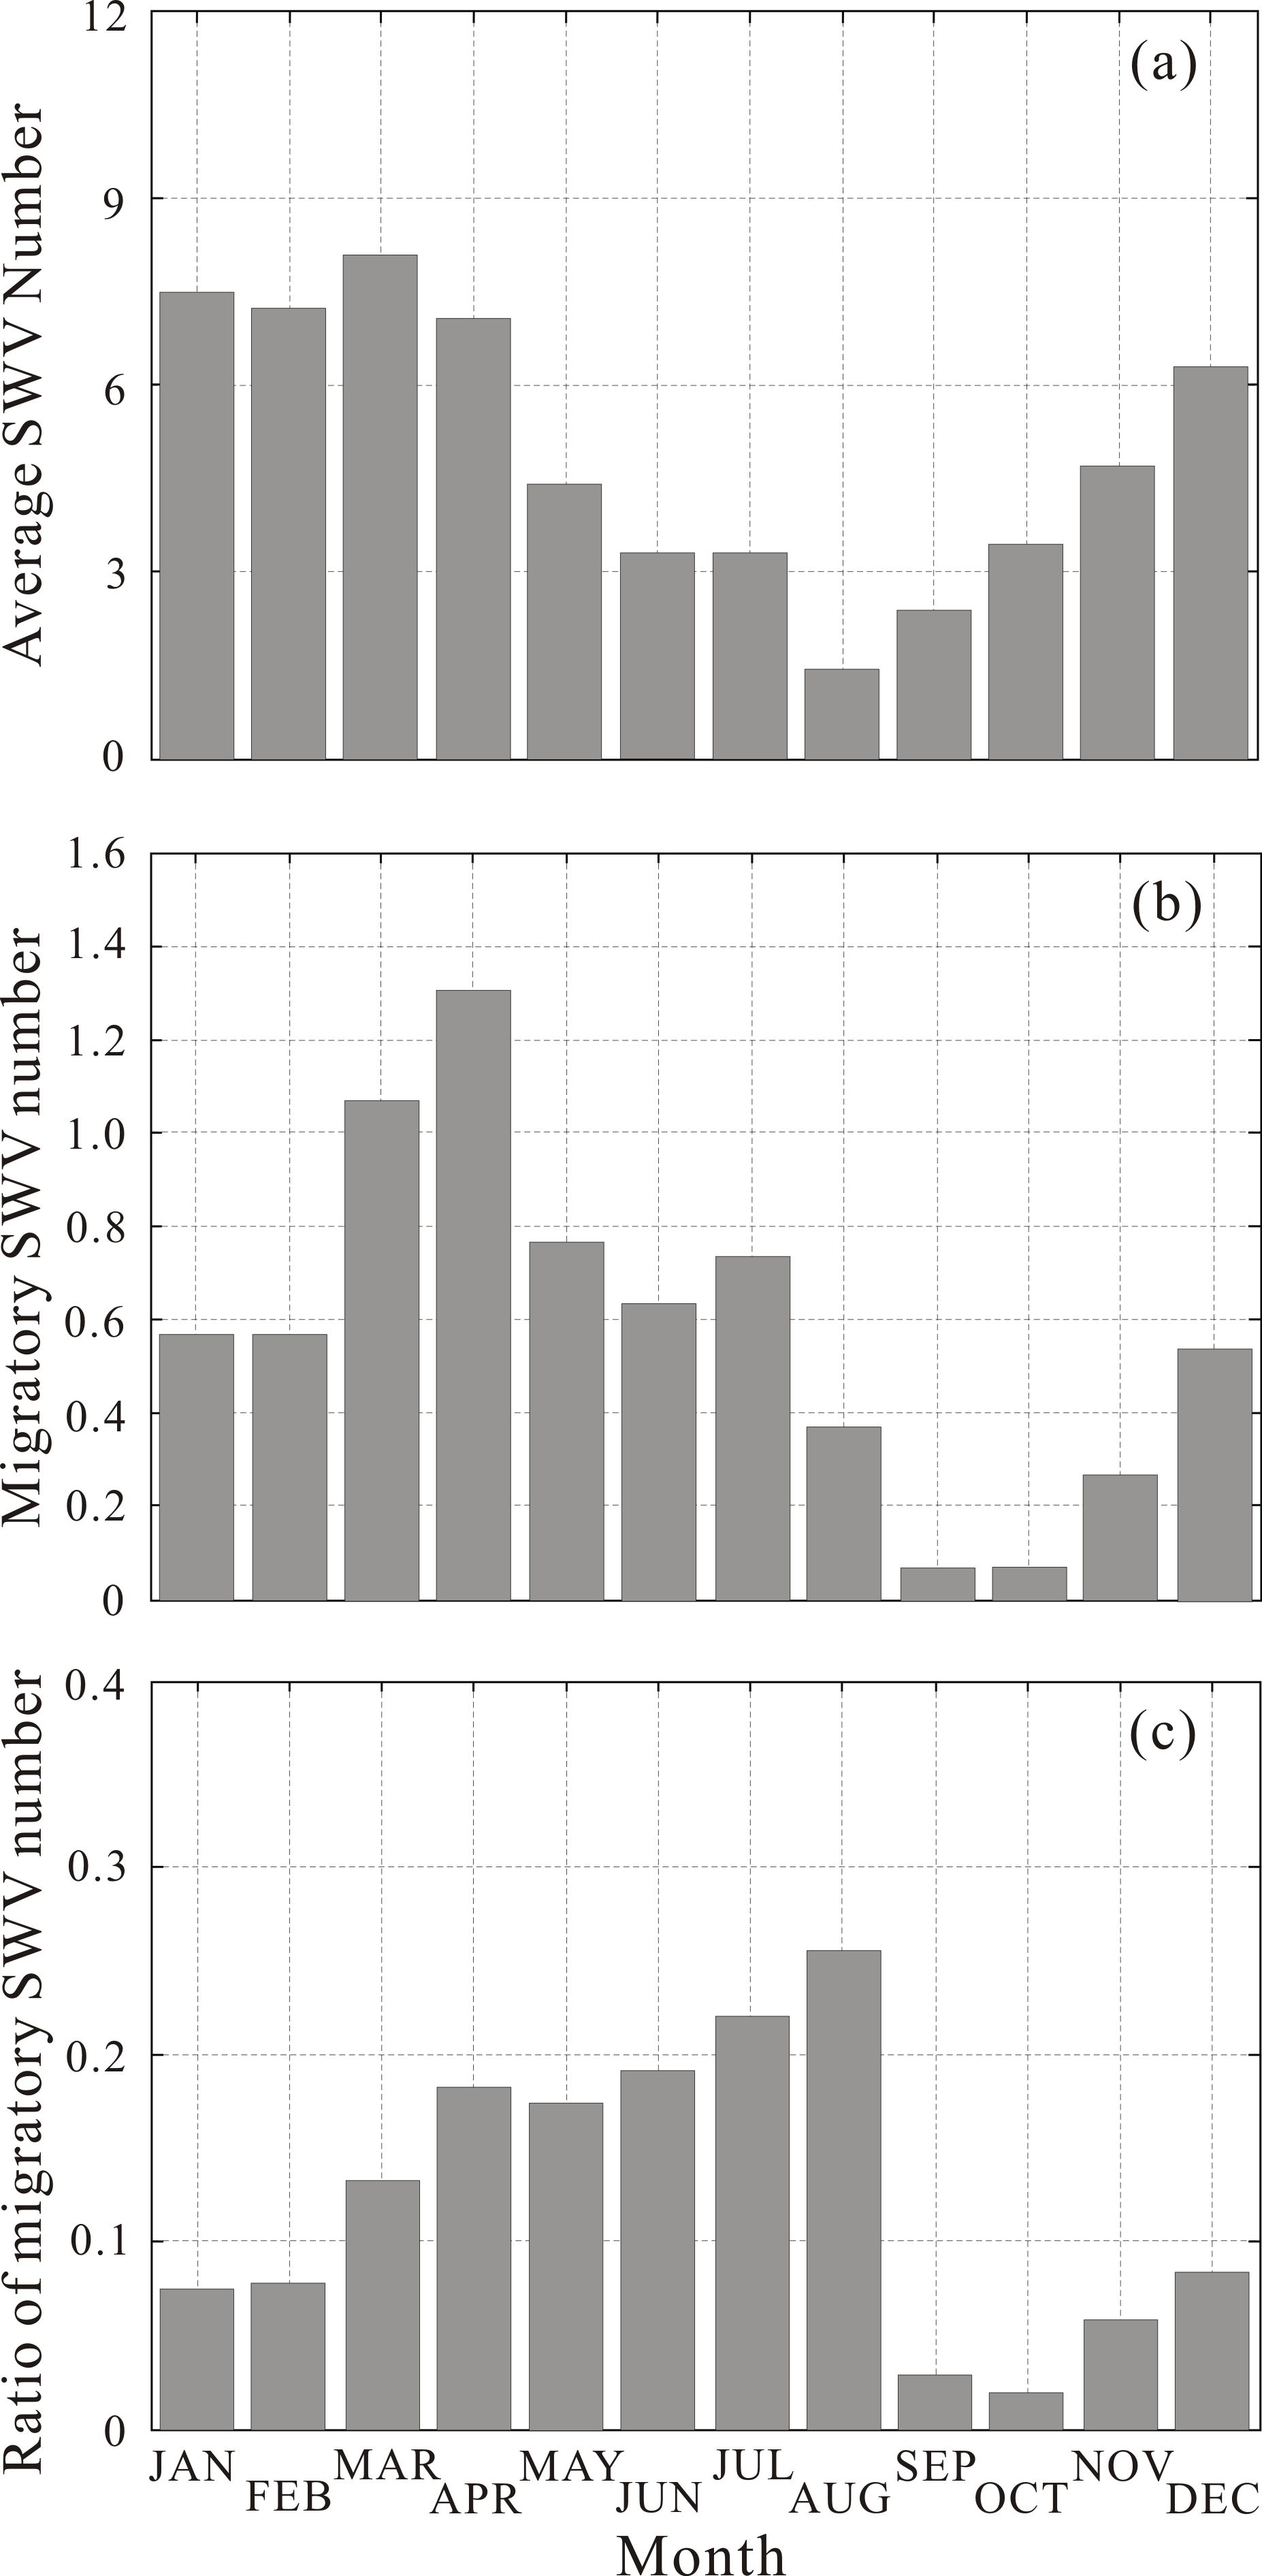 | Figure 2 Monthly mean number and ratio of SWVs during 1979- 2008: (a) monthly mean of all SWVs; (b) monthly of migratory SWVs; (c) ratio of the number of migratory SWVs to total SWVs. |
The migration of SWVs is an important topic because it brings severe weather to downstream areas. For example, the catastrophic flood in the Yangtze River basin during June-August 1998 was closely related to a migratory SWV ( Chen et al., 2003). In this paper, a migratory SWV is defined as one that moves out to the north of 35°N, to the south of 25°N, or to the east of 110°E. In 30-year study period, there are 205 migratory SWVs (11.56% of total SWVs). This number is less than that (23.8%) in the research of Chen et al. (2004). From Fig. 2b, the number of migratory SWVs fluctuates almost consistently with that of the total number of SWVs (Fig. 2a), and reaches its highest number in April. However, it is interesting to note that the number of migratory SWVs in October and November is less than that in August, despite there being more SWVs in the former (Fig. 2a).
Figure 2c shows the ratio of migratory SWVs to total SWVs. Although there are less SWVs in summer (Fig. 2a) in comparison to other seasons, an SWV has the highest probability of moving away from its origin at this time. On the contrary, this probability is much lower in winter, when more SWVs are found. This suggests that SWVs have a stronger tendency to migrate in the warm season. As mentioned above, another point worthy of attention is the gap between August and September. Comparing the mean wind velocity field in September to that in August (figure not shown), the difference between them at 700 hPa indicates that, in August, stronger westerlies (by 2 m s-1) and southerlies (by 1 m s-1) dominate the migration of SWVs. The stronger northeastward steering flow makes it easier for SWVs in August to move away from their area of origin. A possible reason is the transition of the thermal forcing of the Tibetan Plateau. The Tibetan Plateau transforms from a heat source to a cold source during September and October ( Wang et al., 2008), which may streng-then the westerly flow and enhance the migration of SWVs.
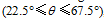
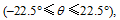
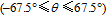
In terms of the movement characteristics of migratory SWVs, in this work the SWV tracks are classified into four categories according to the direction of the vector linking the initial position to the farthest position of the SWV. With the angle of the migration 


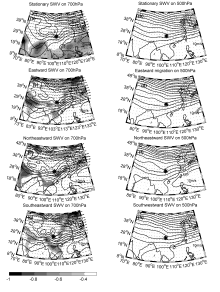
In order to identify the main factors determining the movement of SWVs, Figs. 3a-h present the composites of stationary, northeastward-moving, eastward-moving, and southeastward-moving SWVs in the warm season (April to August). Because the features of the northward- and southward-migrating SWVs are respectively similar to those of the northeastward and southeastward SWVs, the composites of these two categories have been omitted. Furthermore, only the warm-season cases are selected in the composite analysis due to the relatively higher probability of occurrence (as shown by Fig. 2c) of migratory SWVs.
For mesoscale systems such as SWVs, ' 


Compared to other types of SWVs, motionless SWVs (Figs. 3a and 3b) have weaker large-scale flows and lower convective instability, although a large area of instabilitytends to be located in the south of the SWV. These two factors together determine the non-migration characteristic of the vortex. In comparison with that 35% of migratory SWVs occurring in May and June, more stationary SWVs (53%) are found in the same months. Related to the active region of the southwest monsoon, a higher percentage of late-spring and early-summer samples in the composite of the stationary SWVs includes more instability features in the low-latitude regions, such as the Bay of Bengal and the South China Sea, as shown in Fig 3a. For migratory SWVs (Figs. 3c, 3e, and 3g), weak stable areas are found downstream on the migratory path, which provide enough unstable energy for the SWVs to move out of their locations of origin. In terms of the large-scale flow, one of the most remarkable features is the relationship between the subtropical high and the westerly trough. For those SWVs migrating in a northeastward direction (Fig. 3c), an enhanced and westward-extending subtropical high deepens the upstream trough and produces strong southwesterly flow downstream of the SWVs. This kind of wind can transport large amounts of moisture from the Bay of Bengal into the vortex movement area, causing the northeastward-moving SWVs to possess relatively greater strength and persistence to move to farther locations. For the other three SWV types, a weaker and eastward-ret-reating subtropical high is the most prominent feature. Additionally, the relative position of the SWV to the large-scale trough is also an important factor affecting the movement of the SWV. Through comparison of the relationships between the SWV and the large-scale trough at 500 and 700 hPa, the high-level steering flow at 700 hPa is more consistent with the moving direction of the SWV. At 700 hPa, migratory SWVs locate just in the bottom (Fig. 3d), downstream area (Fig. 3f) or upstream area (Figs. 3h) of the westerly trough, which produce the northeastward, eastward, and southeastward steering flow, respectively. Therefore, the subtropical high and downstream potential instability area combined with the steering flow at 700 hPa are key factors in judging the movement of SWVs.
 | Figure 3 Composites of (a, b) stationary, (c, d) northeastward-migrating, (e, f) eastward-migrating, and (g, h) southeastward-migrating SWVs in the warm season at 700 hPa (left column) and 500 hPa (right column). Solid lines represent the geopotential height (units: gpm), and the vectors the wind velocity (units: m s-1). Shaded areas represent the negative departures of  |
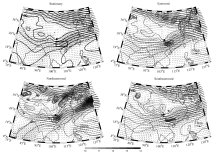
As a mesoscale vortex, the barocilinic energy is another important factor for the evolution of an SWV. According to Hoskins and Valdes (1990), the baroclinic Eady growth rate is a good indicator of the baroclinic instability. The diagnostic variable is defined as 


 | Figure 4 Composites of (a) stationary, (b) eastward-migrating, (c) northeastward-migrating, and (d) southeastward-migrating SWVs in the warm season at 700 hPa. Solid lines represent the geopotential height (units: gpm), and vectors the wind velocity (units: m s-1). Areas with σBI higher than 1×10⁻⁷ s are shown as dashed lines. The contour interval of σBI is 10-7. The speed of the wind in the shaded area is ≥ 10 m s-1. The asterisks represent the mean locations of the SWVs. |
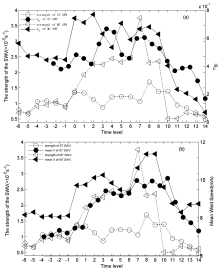
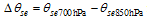
To further investigate the relationship between the SWV and the baroclinic Eady growth rate maximum 


 thermal processes are a key factor for SWV evolution and movement. The low-level jet plays an important role in both dynamical and thermal aspects.
 | Figure 5 Composites of SWV strength, mean wind velocity, and σBI for motionless and migratory SWVs at 700 hPa: (a) SWV strength and σBI of stationary and migratory SWVs; (b) the same as (a) but for SWV strength and wind speed. The above variables are spatial means in the zone depicted in Fig. 4a, defined as the 5° × 10° box in the southeast quadrant of the SWV center. The numbers on the horizontal axis represent the time levels covering the lifecycle of the SWV, where level 0 is the time of SWV genesis. Negative numbers represent time levels prior to SWV genesis. |
In this paper, we present a new vortex detection and tracing method. Based on JRA-25 reanalysis data, a dataset spanning 1979 through 2008 focusing on the SWV is established using the new method. In the studied time period, there are 1773 SWVs, i.e., an average of 59.1 vortices each year. There are fewer SWVs in the warm season (April to August), but with a higher probability of migrating from the genesis region than in the cold season (September to the following March). Furthermore, the spatial distribution of SWV genesis shows significant seasonal variation.
Migratory SWVs mainly move along two routes: an eastward or southeastward path. For warm-season migratory SWVs, we find that the subtropical high combined with the westerly trough have strong dynamical and thermal effects on SWV migration. The steering flow at 700 hPa is a relatively better indicator of SWV movement. Further composite analysis shows that migratory SWVs are generally more intense than motionless ones. The strength of an SWV is closely correlated to the baroclinicity in the southeast quadrant of the SWV center. The enhanced baroclinicity accompanied by a low-level jet in the downstream area provide more energy for migratory SWVs. Under a favorable dynamical environment, the low-level jet is involved in a process that produces weak potential stability in the downstream area of the SWV's movement. This process includes both dynamical and thermal effects, such as baroclinic instability, steering flow, moisture transport, and latent heat release. The energy produced supports the SWV in moving out of its genesis region.
Acknowledgements. This work was jointly supported by the National Natural Science Foundation of China (Grant Nos. 41275064 and 41175057) and the Public Science and Technology Research Fund Projects of the Ocean (Grant No. 201005019).
| 1 |
|
| 2 |
|
| 3 |
|
| 4 |
|
| 5 |
|
| 6 |
|
| 7 |
|
| 8 |
|
| 9 |
|
| 10 |
|
| 11 |
|
| 12 |
|
| 13 |
|
| 14 |
|
| 15 |
|
| 16 |
|
| 17 |
|
| 18 |
|
| 19 |
|
| 20 |
|
| 21 |
|
| 22 |
|
| 23 |
|
| 24 |
|
| 25 |
|