
Trends of Lower- to Mid-Stratospheric Water Vapor Simulated in
Chemistry-Climate Models
Chemistry-Climate Models
[HU Ding-Zhu1 , HAN Yuan-Yuan1 , SANG Wen-Jun1 , XIE Fei2, *  ]
]
]
|
|


Using the outputs from 16 chemistry-climate models (CCMs), the trends of lower- to mid-stratospheric water vapor (WV) during the period 1980-2005 were studied. Comparisons were made between the CCM results and European Centre for Medium-Range Weather Forecasts (ECMWF) Interim Reanalysis (ERA-Interim). The results of most of the CCMs, and those based on ERA-Interim, showed the trends of lower- to mid-stratospheric WV during the period 1980-2005 to be positive, with the extent of the trend increasing with altitude. The trend of lower- to mid-stratospheric WV in the ensemble mean of the CCMs was 0.03 ppmv per decade, which was about twice as large as that based on ERA-Interim. The authors also used a state-of-the-art general circulation model to evaluate the impacts of greenhouse gas (GHG) concentration increases and ozone depletion on stratospheric WV. The simulation results showed that the increases of lower- to mid-stratospheric WV affected by the combined effects of GHG and ozone changes happened mainly via warming of the tropopause and enhancement of the Brewer-Dobson circulation (BDC), with the former being the greater contributor. GHG increase led to a higher and warmer tropopause with stronger BDC, which in turn led to more WV entering the stratosphere; while ozone depletion led to a higher and cooler tropopause, which caused the decreases of lower- to mid-stratospheric WV, despite also causing stronger BDC.
Water vapor (WV), an important greenhouse gas, is closely related to the global radiative balance and climate change and has been studied widely (e.g., Forster and Shine, 2002; Bi et al., 2007, 2008; Dessler et al., 2013). Stratospheric WV can not only affect the temperature structure via radiative effects (Hansen et al., 2005), but also affect the composition of the stratosphere via chemical processes (Tian et al., 2009). The trends of stratospheric WV have been studied extensively in the past several decades. For example, Oltmans et al. (2000) revealed that atmospheric WV increased by 1%-1.5% per year (0.05-0.07 ppmv yr-1) in the past 35 years. In a study based on 10 different datasets, Rosenlof et al. (2001) found that stratospheric WV increased by 1% per year from 1954 to 2000. However, Randel et al. (2006) demonstrated that the WV in the lower stratosphere (LS) has been decreasing since 2000, a phenomenon that has been confirmed in later research (Dhomse et al., 2008; Hurst et al., 2011). In general, the trends of stratospheric WV remain uncertain.
To successfully predict the concentration of stratospheric WV in the future, high-performance numerical models are needed. In recent years, some researchers have used chemistry-climate models (CCMs) to analyze the trends of atmospheric trace gases (e.g., Stenke and Grewe, 2005), revealing that the WV in the LS has increased by 0.7 ppmv in the past two decades. Subsequently, Tian and Chipperfield (2006)showed that such a trend is likely to continue in the future atmosphere via CCM simulations. CCMs are important tools for analyzing atmospheric composition changes, which are coupled to the physical, chemical and dynamical processes taking place in the stratosphere (e.g., World Meteorological Organization, 2007). However, existing models possess many uncertainties in simulating the processes of the atmosphere. Eyring et al. (2006) found that different processes employed in CCMs will inevitably lead to biases in ozone and temperature simulation, which are key factors affecting stratospheric WV. Austin et al. (2003) pointed out that the modeling uncertainty of stratospheric processes varies among different CCMs. Hence, it is important to analyze the trends of stratospheric WV simulated by different CCMs.
In addition, the factors that controlled stratospheric WV during past decades are still under debate. Many previous studies consider the cold-point tropopause (CPT) temperature as the main factor affecting stratospheric WV. This happens via freeze-drying, which occurs in the tropics when tropospheric air enters the stratosphere (Holton et al., 1995). Besides the tropopause temperature, stratospheric Brewer-Dobson circulation (BDC) (e.g., Dhomse et al., 2008) and methane oxidation (e.g., Tian and Chipperfield, 2006; Bi et al., 2011) also have important effects on stratospheric WV. Some research suggests that deep convection near the tropopause is a major contributor to the entrance of tropospheric WV into the LS via the direct transportation of ice (e.g., Rosenlof, 2003). Under global warming, increases in the concentrations of greenhouse gases (GHGs) can alter the structure of temperature via radiation effects to affect stratosphere-troposphere exchange, further affecting stratospheric WV. On the other hand, increasing concentrations of GHGs can indirectly alter convection and wave activities via modifying sea surface temperature (SST), which have important effects on stratospheric WV (Holton et al., 1995). During the latter decades of the 20th century (from the late 1970s to the late 1990s), the globally averaged total ozone column exhibited a negative trend (Solomon, 1999). This depletion of ozone also played an important role in stratospheric WV via direct radiation effects and indirect dynamical effects (Xie et al., 2008). But which, out of stratospheric ozone depletion and increases in the concentrations of GHGs, is more important for stratospheric WV variation?
In the present reported study, we used the outputs from 16 CCMs to investigate the stratospheric WV trends during 1980-2005, and compared the results with reanalysis data. We then explored the possible relationships among the stratospheric WV trends, GHG increases, and ozone depletion.
The datasets used in this study include the WV outputs from 16 CCMs that have been evaluated as part of the Stratospheric Processes and their Role in Climate (SPARC) Chemistry-Climate Model Validation Activity, round 2 (CCMVal-2). A simple description of the CCMs is provided in Table 1, and more detail about these models can be found in Chapter 2 of SPARC CCMVal (2010). These models are all coupled with stratospheric chemistry to improve their performance. In order to validate the results of the CCMs, the WV data from the European Centre for Medium-Range Weather Forecasts (ECWMF) Interim Reanalysis (ERA-Interim) for the period 1980- 2005 were also employed. ERA-Interim has a horizontal resolution of 1.5° × 1.5° and 37 vertical layers from the ground to 1 hPa.
| Table 1 The Chemistry-Climate Model Validation Activity, round2 (CCMVal-2) models used in this study. |
In order to further investigate the factors controlling the stratospheric WV variations, we also used the Whole Atmosphere Community Climate Model, version 3 (WACCM3), which performs well in simulating stratospheric processes (e.g., Eyring et al., 2006). The model has 66 vertical levels from the ground to 5.96× 10⁻⁶ hPa. In this study, four time-slice simulations were performed at the horizontal resolution of 1.9° × 2.5° with interactive chemistry processes switched off. All simulations were run for 56 years. The first four years of model outputs were excluded for spin-up.
The GHG values in all simulations were adopted from the Intergovernmental Panel on Climate Change (IPCC) AR4 B1 scenarios (IPCC, 2007), which are fixed at either 1980 or 2000 values. The monthly mean SST and sea ice climatologies for the time periods 1975-84 and 1995- 2004 derived from the Hadley Centre were used in the corresponding time-slice simulations. The ozone forcings used in this study were two monthly varying zonal-mean climatologies, taken from a WACCM reference simulation performed for CCMVal-2 (SPARC CCMVal, 2010) for the time periods 1978-82 and 1998-2002. According to the configurations of the GHGs, SST, and ozone listed in Table 2, four experiments, denoted REF1980, GHG2000, OZONE2000, and BOTH2000, were designed to investigate the different impacts on stratospheric WV.
| Table 2 Greenhouse gas (GHG), SST, and ozone fields used in the four simulations. |
Figure 1 shows the annual mean trends of simulated WV. Most of the models showed stratospheric WV to have increased during 1980-2005; and these trends increased with altitude, consistent with ERA-Interim (Figs. 1a and 1b). This is also consistent with the results of the Halogen Occultation Experiment satellite (Chen et al. 2009). Stratospheric WV in the Northern Hemisphere (NH; 0-90° N) was a little larger than that in the Southern Hemisphere (SH; 0-90° S) in most CCMs, and the ensemble mean WV of all the models was larger than ERA-Interim in both hemispheres. ULAQ, CNRM-ACM, and CAM3.5 showed the largest discrepancies. Due to the close correlation between stratospheric WV and atmospheric temperature, we also presented the simulated temperature trends in Figs. 1c and 1d. We can see that the CCMs simulated the temperature to have increased in the troposphere, but decreased in the stratosphere. The warming in the troposphere peaked at about 300 hPa. The SH warming in the troposphere was consistent between the CCMs and ERA-Interim (about 0.07 K per decade), while the simulated tropospheric warming peak was larger than that of ERA-Interim in the NH. The warming-cooling transition level in the NH was higher than that in the SH, which could be attributed to the larger increasing trend of the WV in the NH. The warming-cooling transition height in the simulations was larger than that in ERA-Interim, which implies that the simulated warming at the tropopause in most CCMs was larger than in ERA-Interim, and this can be seen clearly in Fig. 2. This may be the reason that the simulated stratospheric WV was larger than in ERA-Interim. Also of note is that the cooling trends in the stratosphere enhanced with increased height, and the simulated cooling trend in the LS was smaller than in ERA-Interim.
 | Figure 1 Profiles of zonal and annual mean (a, b) water vapor and (c, d) temperature trends during 1980-2005 and weighted averaged over (a, c) 0-90° S and (b, d) 0-90° N. The solid gray line represents the ERA-Interim and the solid black line denotes the ensemble mean of the chemistry-climate models (CCMs). The gray shaded area indicates ± 1 standard deviation of the ensemble mean. |
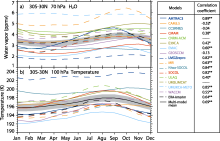
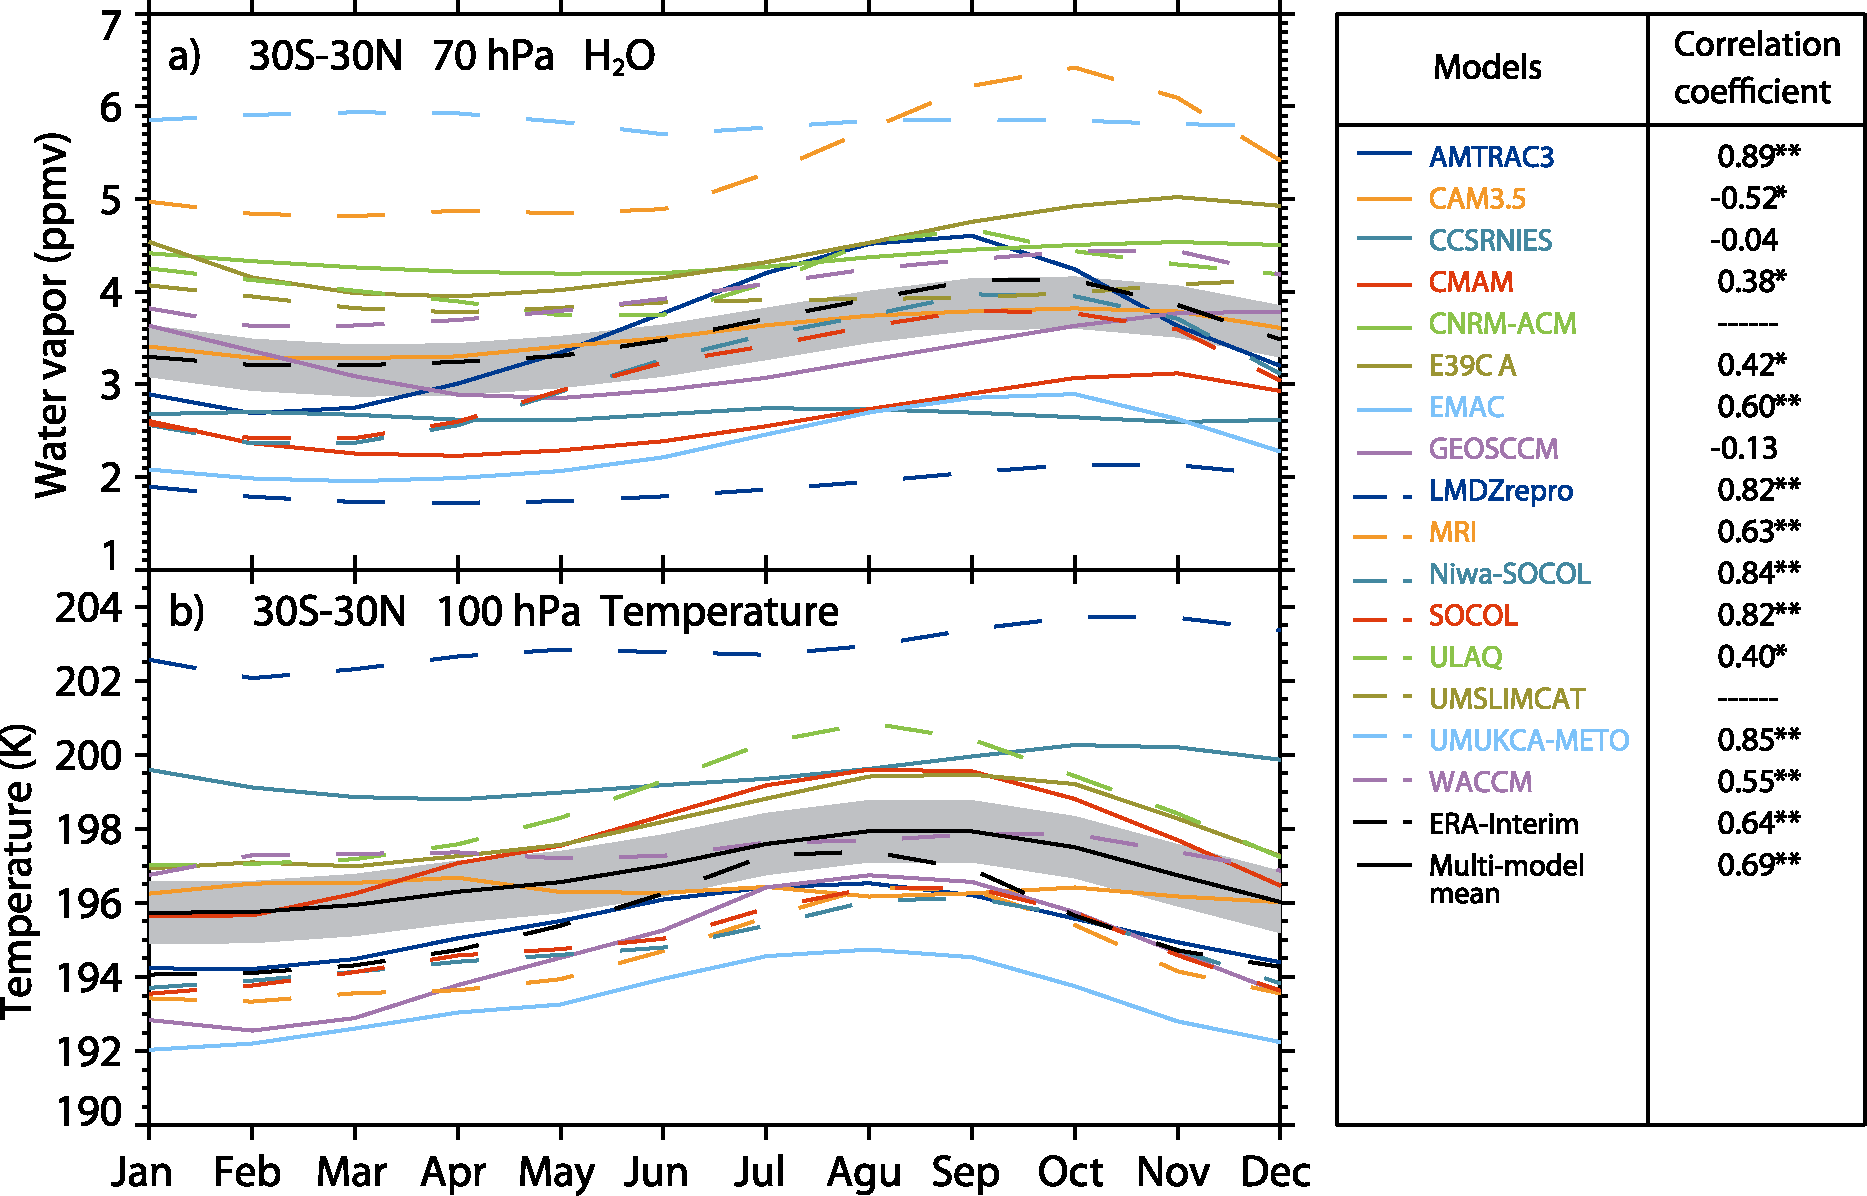 | Figure 2 Seasonal variation of tropical (a) water vapor at 70 hPa and (b) temperature at 100 hPa during 1980-2005. The black dotted line represents ERA-Interim and the thick black line denotes the ensemble mean of the CCMs. The gray shaded area indicates ± 1 standard deviation of the ensemble mean. The data in the table to the right of the figure panels show the correlation coefficients between 70 hPa water vapor and 100 hPa temperature. The single (* ) and double (* * ) asterisks indicate statistically at the 95% and 99% confidence levels, respectively. |
The structure of temperature changes will alter the temperature of the tropopause. Both observations and reanalysis data show that interannual variations of LS WV are closely associated with tropical CPT temperature anomalies (e.g., Zhou et al., 2001). Figure 2 shows the seasonal cycle of 70 hPa WV and 100 hPa temperature averaged over 30° S-30° N. Most of the CCMs were able to simulate the seasonal cycle of tropical CPT temperature and LS WV well, and 70 hPa WV and 100 hPa temperature were positively correlated. However, the ensemble mean of the tropopause temperature was higher than that of ERA-Interim, which may lead to the trends of simulated stratospheric WV being larger than that in ERA-Interim.
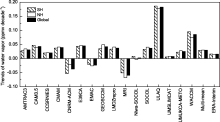
Figure 3 presents the weighted average WV trends from the CCMs over 0-90° S (SH), 0-90° N (NH), and 90° S-90° N (global) between 10 hPa and 100 hPa. Except for CNRM-ACM, EMAC, and MRI, all models showed positive trends over 1980-2005, with the largest trend being 0.182 ppmv per decade (ULAQ), and the smallest upward trend being 0.002 ppmv per decade (Niwa- SOCOL). The ensemble mean global trend was about 0.030 ppmv per decade, while ERA-Interim showed a trend (0.016 ppmv per decade) that was apparently only half of the trend of the CCMs. This was related to the warmer tropopause bias of the simulations (Fig. 2).
 | Figure 3 Trends of annual mean water vapor (units: ppmv per decade) weighted averaged over 0-90° S (Southern Hemisphere, SH), 0-90° N (Northern Hemisphere, NH), and 90° S-90° N (global) between 10 hPa and 100 hPa during the period 1980-2005. |
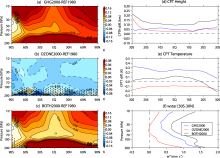
Increases in the concentrations of GHGs and ozone depletion are known to be important factors affecting stratospheric WV (e.g., Hu et al., 2008). In order to examine the stratospheric WV change induced by these two factors, we designed four time-slice simulations. Figures 4a-c show the annual mean WV difference between runs GHG2000 and REF1980, OZONE2000 and REF1980, and BOTH2000 and REF1980. The increases in GHGs caused an overall increase in WV throughout the stratosphere, with the largest change of 0.18 ppmv occurring over the Antarctic (Fig. 4a). The increase in stratospheric WV induced by GHGs grew with altitude and latitude, while ozone depletion decreased the stratospheric WV (Fig. 4b). The largest WV decrease induced by ozone depletion occurred in the tropical and Antarctic stratosphere. The increases in stratospheric WV between runs BOTH2000 and REF1980 showed evident spatial variation, with the largest increase occurring in the mid-stratosphere at high latitude (Fig. 4c). Interestingly, the increase in WV over the Antarctic stratosphere was the smallest (0.01 ppmv), which was caused by the combined effect of GHG and ozone changes. This was mainly related to the increase of polar stratospheric clouds due to Antarctic stratospheric cooling caused by GHG and ozone changes.
 | Figure 4 Zonal and annual mean water vapor differences between runs (a) GHG2000 and REF1980, (b) OZONE2000 and REF1980, and (c) BOTH2000 and REF1980. The dotted areas indicate regions where the statistically does not exceed the 99% confidence level. The contour intervals for (a, c) are 0.02 ppmv and for (b) are 0.01 ppmv. The positive and negative contours in (a-c) are represented by solid and dashed lines, respectively. Differences in zonal and annual mean (d) cold-point tropopause (CPT) height, (e) CPT temperature, and (f) w* (vertical velocity components of Brewer-Dobson Circulation) averaged over 30° S-30° N between the runs of GHG2000, OZONE2000, BOTH2000, and REF1980. |
Previous studies proved that stratospheric WV is sensitive to tropospheric processes (e.g., Bian, 2009; Bian et al., 2011; Zhan and Li, 2012), the tropical tropopause, BDC (e.g., Dhomse et al., 2008; Hu et al., 2014), and methane oxidization (e.g., Tian and Chipperfield, 2006; Bi et al., 2011). Using a CCM, Tian and Chipperfield(2006) revealed that the WV in the upper stratosphere is mainly caused by methane oxidation, while the WV in the LS is more related to the temperature of the tropical tropopause and BDC. Hence, we focused on the contributions of the tropopause and BDC to the WV in the lower- to mid-stratosphere between 100 and 10 hPa. The w* is the vertical velocity components of the BDC defined in Edmon et al. (1980). Figures 4d and 4e show that the GHG increases in run GHG2000 resulted in a higher and warmer CPT, which is consistent with the results of Xie et al. (2008). The ozone decrease between OZONE2000 and REF1980 caused a higher and cooler CPT. The CPT height was highest in run BOTH2000, which was caused by the combined effect of GHG and ozone changes. Previous observational and model results both provide evidence that the height of the tropical tropopause has risen in recent decades (e.g., Seidel et al., 2001; Santer et al., 2003). GHG and ozone changes alter the temperature structure, which leads to corresponding zonal wind changes following the thermal wind relationship, and can also change the propagation of waves into the stratosphere. Hence, BDC enhanced in all the runs (Fig. 4f). Because of enhanced tropical upward transport, the stratospheric WV should have increased in the three runs; however, it decreased in OZONE2000. We found that the stratospheric WV changes were consistent with the CPT temperature. Hence, the CPT temperature is the major factor controlling the WV in the lower- and mid-stratosphere over 100-10 hPa. This can also be proven by comparing the results of GHG2000 and BOTH2000. The w* was largest in run BOTH2000, but the increases of WV were smaller in run BOTH2000 than in GHG2000.
Using simulations from 16 CCMs, we investigated the trends of lower- to mid-stratospheric WV over the period 1980-2005 and compared the results with ERA-Interim data. The CCM simulations and ERA-Interim results both indicated that lower- to mid-stratospheric WV increased during 1980-2005, and such trends increased with altitude. However, the simulated lower- to mid-stratospheric WV in most of the CCM results was larger in the NH than in the SH. This may be related to the fact that the warming-cooling transition level in the NH was higher than that in the SH. Furthermore, the lower- to mid-stratospheric WV trend in the ensemble mean of the CCMs was 0.030 ppmv per decade, about two times that based on ERA-Interim. This was mainly due to the warmer CPT in the CCMs. Negative correlation between the tropical CPT temperature and tropical LS WV was observed both in the ensemble mean of CCMs (-0.69) and ERA-Interim (-0.64).
The results of the simulations suggested that lower- to mid-stratospheric WV increases associated with increases in the concentrations of GHGs and ozone depletion were mainly induced by warming of the CPT and enhancement of BDC, with the former being the greater contributor. GHG increases resulted in a higher and warmer CPT and stronger BDC, which caused the lower- to mid-stratospheric WV increases; while ozone depletion led to a higher and cooler C Previous studies proved that stratospheric WV is sensitive to tropospheric processes (e.g., Bian, 2009; Bian et al., 2011; Zhan and Li, 2012), the tropical tropopause, BDC (e.g., Dhomse et al., 2008; Hu et al., 2014), and methane oxidization (e.g., Tian and Chipperfield, 2006; Bi et al., 2011). Using a CCM, Tian and Chipperfield (2006) revealed that the WV in the upper stratosphere is mainly caused by methane oxidation, while the WV in the LS is more related to the temperature of the tropical tropopause and BDC. Hence, we focused on the contributions of the tropopause and BDC to the WV in the lower- to mid-stratosphere between 100 and 10 hPa. The w* is the vertical velocity components of the BDC defined in Edmon et al. (1980). Figures 4d and 4e show that the GHG increases in run GHG2000 resulted in a higher and warmer CPT, which is consistent with the results of Xie et al.PT, which in turn led to less WV entering the stratosphere, despite the BDC being enhanced as a result of the ozone depletion. This further confirmed that the increases of WV in the lower- to mid-stratosphere were more affected by the CPT temperature change than the BDC change.
Discrepancies still exist among different CCMs. Such problems need further investigation in future studies.
Acknowledgments
This study was supported by the National Natural Science Foundation of China (Grant Nos. 41225018 and 41305036). We thank the SPARC Project of the World Climate Research Programme for providing the CCMVal-2 datasets.
| 1 |
|
| 2 |
|
| 3 |
|
| 4 |
|
| 5 |
|
| 6 |
|
| 7 |
|
| 8 |
|
| 9 |
|
| 10 |
|
| 11 |
|
| 12 |
|
| 13 |
|
| 14 |
|
| 15 |
|
| 16 |
|
| 17 |
|
| 18 |
|
| 19 |
|
| 20 |
|
| 21 |
|
| 22 |
|
| 23 |
|
| 24 |
|
| 25 |
|
| 26 |
|
| 27 |
|
| 28 |
|
| 29 |
|
| 30 |
|
| 31 |
|
| 32 |
|