
Predicting Western Pacific Subtropical High Using a Combined Tropical Indian Ocean Sea Surface Temperature Forecast
[WANG Li-Wei1, 2, 3 , ZHENG Fei1  , ZHU Jiang
1 ]
, ZHU Jiang|
|


Weather and climate in East China are closely related to the variability of the western Pacific subtropical high (WPSH), which is an important part of the Asian monsoon system. The WPSH prediction in spring and summer is a critical component of rainfall forecasting during the summer flood season in China. Although many attempts have been made to predict WPSH variability, its predictability remains limited in practice due to the complexity of the WPSH evolution. Many studies have indicated that the sea surface temperature (SST) over the tropical Indian Ocean has a significant effect on WPSH variability. In this paper, a statistical model is developed to forecast the monthly variation in the WPSH during the spring and summer seasons on the basis of its relationship with SST over the tropical Indian Ocean. The forecasted SST over the tropical Indian Ocean is the predictor in this model, which differs significantly from other WPSH prediction methods. A 26-year independent hindcast experiment from 1983 to 2008 is conducted and validated in which the WPSH prediction driven by the combined forecasted SST is compared with that driven by the persisted SST. Results indicate that the skill score of the WPSH prediction driven by the combined forecasted SST is substantial.
The western Pacific subtropical high (WPSH) is an important part of the Asian summer monsoon system, and its variation is closely related to the weather and climate over the eastern region of China ( Tao et al., 1987; Sun and Ying, 1999). In view of its robust impact on the regional circulation and rainfall in summer over China ( Wu et al., 2003; Tao et al., 2006), the prediction of the WPSH evolution during the spring and summer seasons has been extensively investigated ( Ai and Chen, 2000; Zhang, 2001; Zeng et al., 2010). However, challenges remain in WPSH research ( Wu et al., 2003).
Studies show that the variation of the sea surface temperature (SST) in the tropical Indian-Pacific Ocean plays an important role in affecting WPSH variability. Luo and Jin (1987) determined that the warming of the SST over the North Indian Ocean and the South China Sea during winter, spring, and the period of Meiyu favors strengthening and westward expansion of the WPSH. Nitta (1990) indicated that the WPSH variation is complex and contains inconsistencies between the effect from the SST in the tropical Indian Ocean and that in the tropical Pacific. Wu and Liu (1995) simulated the response of atmospheric circulation to SST anomalies with the Geophysical Fluid Dynamics Laboratory (GFDL) numerical model and revealed that the anomalous SST in the central tropical Indian Ocean can lead a strengthening and southward extension of the WPSH. More recently, Wu et al. (2000) reported a two-stage thermal adaptation in the effects of the SST anomalies in the Indian Ocean on the subtropical anticyclone over the western Pacific Ocean. Zeng et al. (2007) simulated the variation of the northwest Pacific subtropical high (NWPSH) forced by monthly global observed SST by using the Community Atmospheric Model (CAM3) of the National Center for Atmospheric Research (NCAR). They determined that the variation of NWPSH driven by the SST in the tropical Indian Ocean was more consistent with the observation than that driven by the SST in the tropical Pacific. Therefore, SST over the tropical Indian Ocean may provide useful indications of the WPSH prediction confidence.
However, the absence of skillful forecasting of the SST over the tropical Indian Ocean has led to adoption of the predicted SST over the tropical Indian Ocean as the predictor is still an attempt to forecast WPSH variation.
Recently, a linear regression prediction model for the SST over the tropical Indian Ocean was established through a combined dynamics and statistical approach ( Wang et al., 2013). The combined prediction model is an extended application of the large-size ensemble El Niño and the Southern Oscillation (ENSO) forecast system with coupled data assimilation (Leefs_CDA) ( Zheng and Zhu, 2010). Its forecast skill has been examined independently during the period of January 1982 to December 2009 for SSTs over 20°S-20°N, 40°E-120°E with up to a 12-month lead time. Results show that the combined prediction outscores the persisted SST and that a higher correlation coefficient and smaller root mean square (RMS) error can be achieved more effectively by the combined prediction than that by the persistence ( Wang et al., 2013).
In this paper, an analysis of the correlations between the SST over the tropical Indian Ocean and the WPSH variability is first provided. A statistical model is next established to forecast the varying WPSH by choosing the combined forecasted SST in the tropical Indian Ocean as the predictor. Finally, a hindcast is performed from 1983 to 2008 with a six-month lead time to validate the ability of the statistical model for predicting the WPSH variation.
The observed monthly SST anomaly field in the Indian Ocean used in this study was obtained from the National Oceanic and Atmospheric Administration (NOAA) Extended Reconstructed Sea Surface Temperature (ERSST) V3b dataset with a horizontal resolution of 2° × 2° covering the period of January 1950 to December 2009. The forecasted SST over the tropical Indian Ocean (20°S- 20°N, 40°E-120°E) covering the period of 1982 to 2009 was provided by the combined statistical-dynamic model. The WPSH indices in the section of March-April-May- June-July-August (MAMJJA) from 1951 to 2008, including those of area (Index I), intensity (Index II), and the western end of the ridge (Index III), were obtained from the website of the National Climate Center/China Meteorological Administration (NCC/CMA).
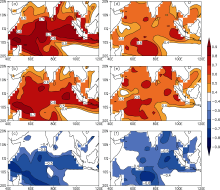
Many studies have analyzed the relationship between the WPSH indices and the SST over the tropical Indian Ocean and have documented a strong correlation with a few months lag time ( Ai and Chen, 2000; Zeng et al., 2010). However, the exact value of the lag is vague, and its indication for prediction has not been completely developed. To examine the relationship of the SST over the tropical Indian Ocean and the WPSH indices during the spring and summer seasons, the correlations between the monthly SST over the tropical Indian Ocean and the WPSH indices in MAMJJA were calculated with specific lagged months of 0 to 12. Different correlation coefficients for each index at each grid appeared as the lagged month changed. We varied the value of the lag from 0 to 12, and calculated the correlation coefficient of each lag. We then compared the resulting 13 different correlation coefficients and selected the maximum value as the maximum correlation coefficient. Accordingly, the value of the lag corresponding to the maximum correlation coefficient was marked as such. Because the interdecadal variability of the WPSH and SST over the tropical Indian Ocean has changed markedly since the 1970s, the correlations were calculated separately for three periods including 1961-90, 1971-2000, and 1981-2010. Figure 1 shows the distribution of the maximum correlation coefficients in April as the middle month of spring and July as the middle month of summer of 1971-2000. The relationships between the lagged SST over the tropical Indian Ocean and the WPSH indices were remarkable, particularly for Index I and Index II, in which the maximal correlation coefficients were greater than 0.8. Zeng et al. (2007) determined that Index III had an out-phase relationship with Index I. Figure 1 indicates that most of the maximum correlation coefficients for Index III were negative and that the absolute values at some grids were greater than 0.6. In addition, the distribution of the relationship showed little variation as the seasons or decades changed (the distributions of 1961-90 and 1981-2010 are not shown).
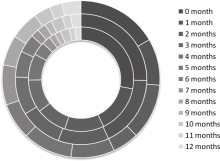
Figure 2 presents the percentages of each lagged month corresponding to the maximum correlation coefficient for indices I, II, and III, which was generally shorter than three months. Because using the observed SST as a predictor in forecasting the WPSH indices is impractical with such a short lag time, the product of the combined prediction model is more appropriate.
Some differences exist in the relationships between the SST in the tropical Indian Ocean and the three WPSH indices; therefore, the statistical prediction model for the WPSH indices was developed according to each index. The approach of this model is simple linear regression. Accordingly, the predictand is the respective index, and the predictor is the combined predicted SST over the tropical Indian Ocean:
WPSHIndex( t)= αIndex( t).SSTIndex( x, y, t- m),
where WPSHIndex( t) is the WPSH index at the target month t, αIndex( t) is the regression coefficient, and SSTIndex( x, y, t- m) is the predicted SST over the Indian Ocean with m months lagged at grid ( x, y); neither m nor ( x, y) is fixed. To validate the ability of the combined forecasted SST in predicting the WPSH indices, referred to as P_C, we contrasted the P_C with the WPSH indices prediction driven by the persisted SST ( Wang et al, 2013); this WPSH prediction is referred to as P_P.
Therefore, αIndex( t) is calculated from the historical data by using the universal operation of least square linear regression:
αIndex( t)=[WPSHIndex]'n×1.([WPSHIndex]n×1.[WPSHIndex]'n×1)-1.[SSTIndex]n×1
Here, n is the statistical sample length. For adapting to the climatic variation in the recent decades, n is taken as 30. Thus, the observed WPSH indices for the most recent 30 years are composed as the predictand vector [WPSHIndex] n×1, and SST at grid ( x, y) with m months lagged during the most recent 30 years is composed as the predictor vector [SSTIndex] n×1.
Selections of m and ( x, y) play crucial roles in the prediction skill. Because the value of m and ( x, y) are changed along with t and the index of WPSH, they must be specified first. Tests show that the maximum correlation coefficients provide the higher forecast accuracy; thus, we designed a procedure for selecting m and ( x, y) with the maximum correlation coefficients by contrasting the correlation coefficients at each grid with the m varying from 0 to 12. To avoid the disturbance of the illusive relationship at a particular grid, the correlation coefficients for the eight grids near that containing the maxi- mum correlation coefficient within a 3 × 3 square were calculated at the same time. The coefficient decreases of the eight grids are required to be less than or equal to 0.1. Because Index III has a negative relationship with Index I, the maximum correlation coefficient in the prediction model for the Index III indicates the absolute value.
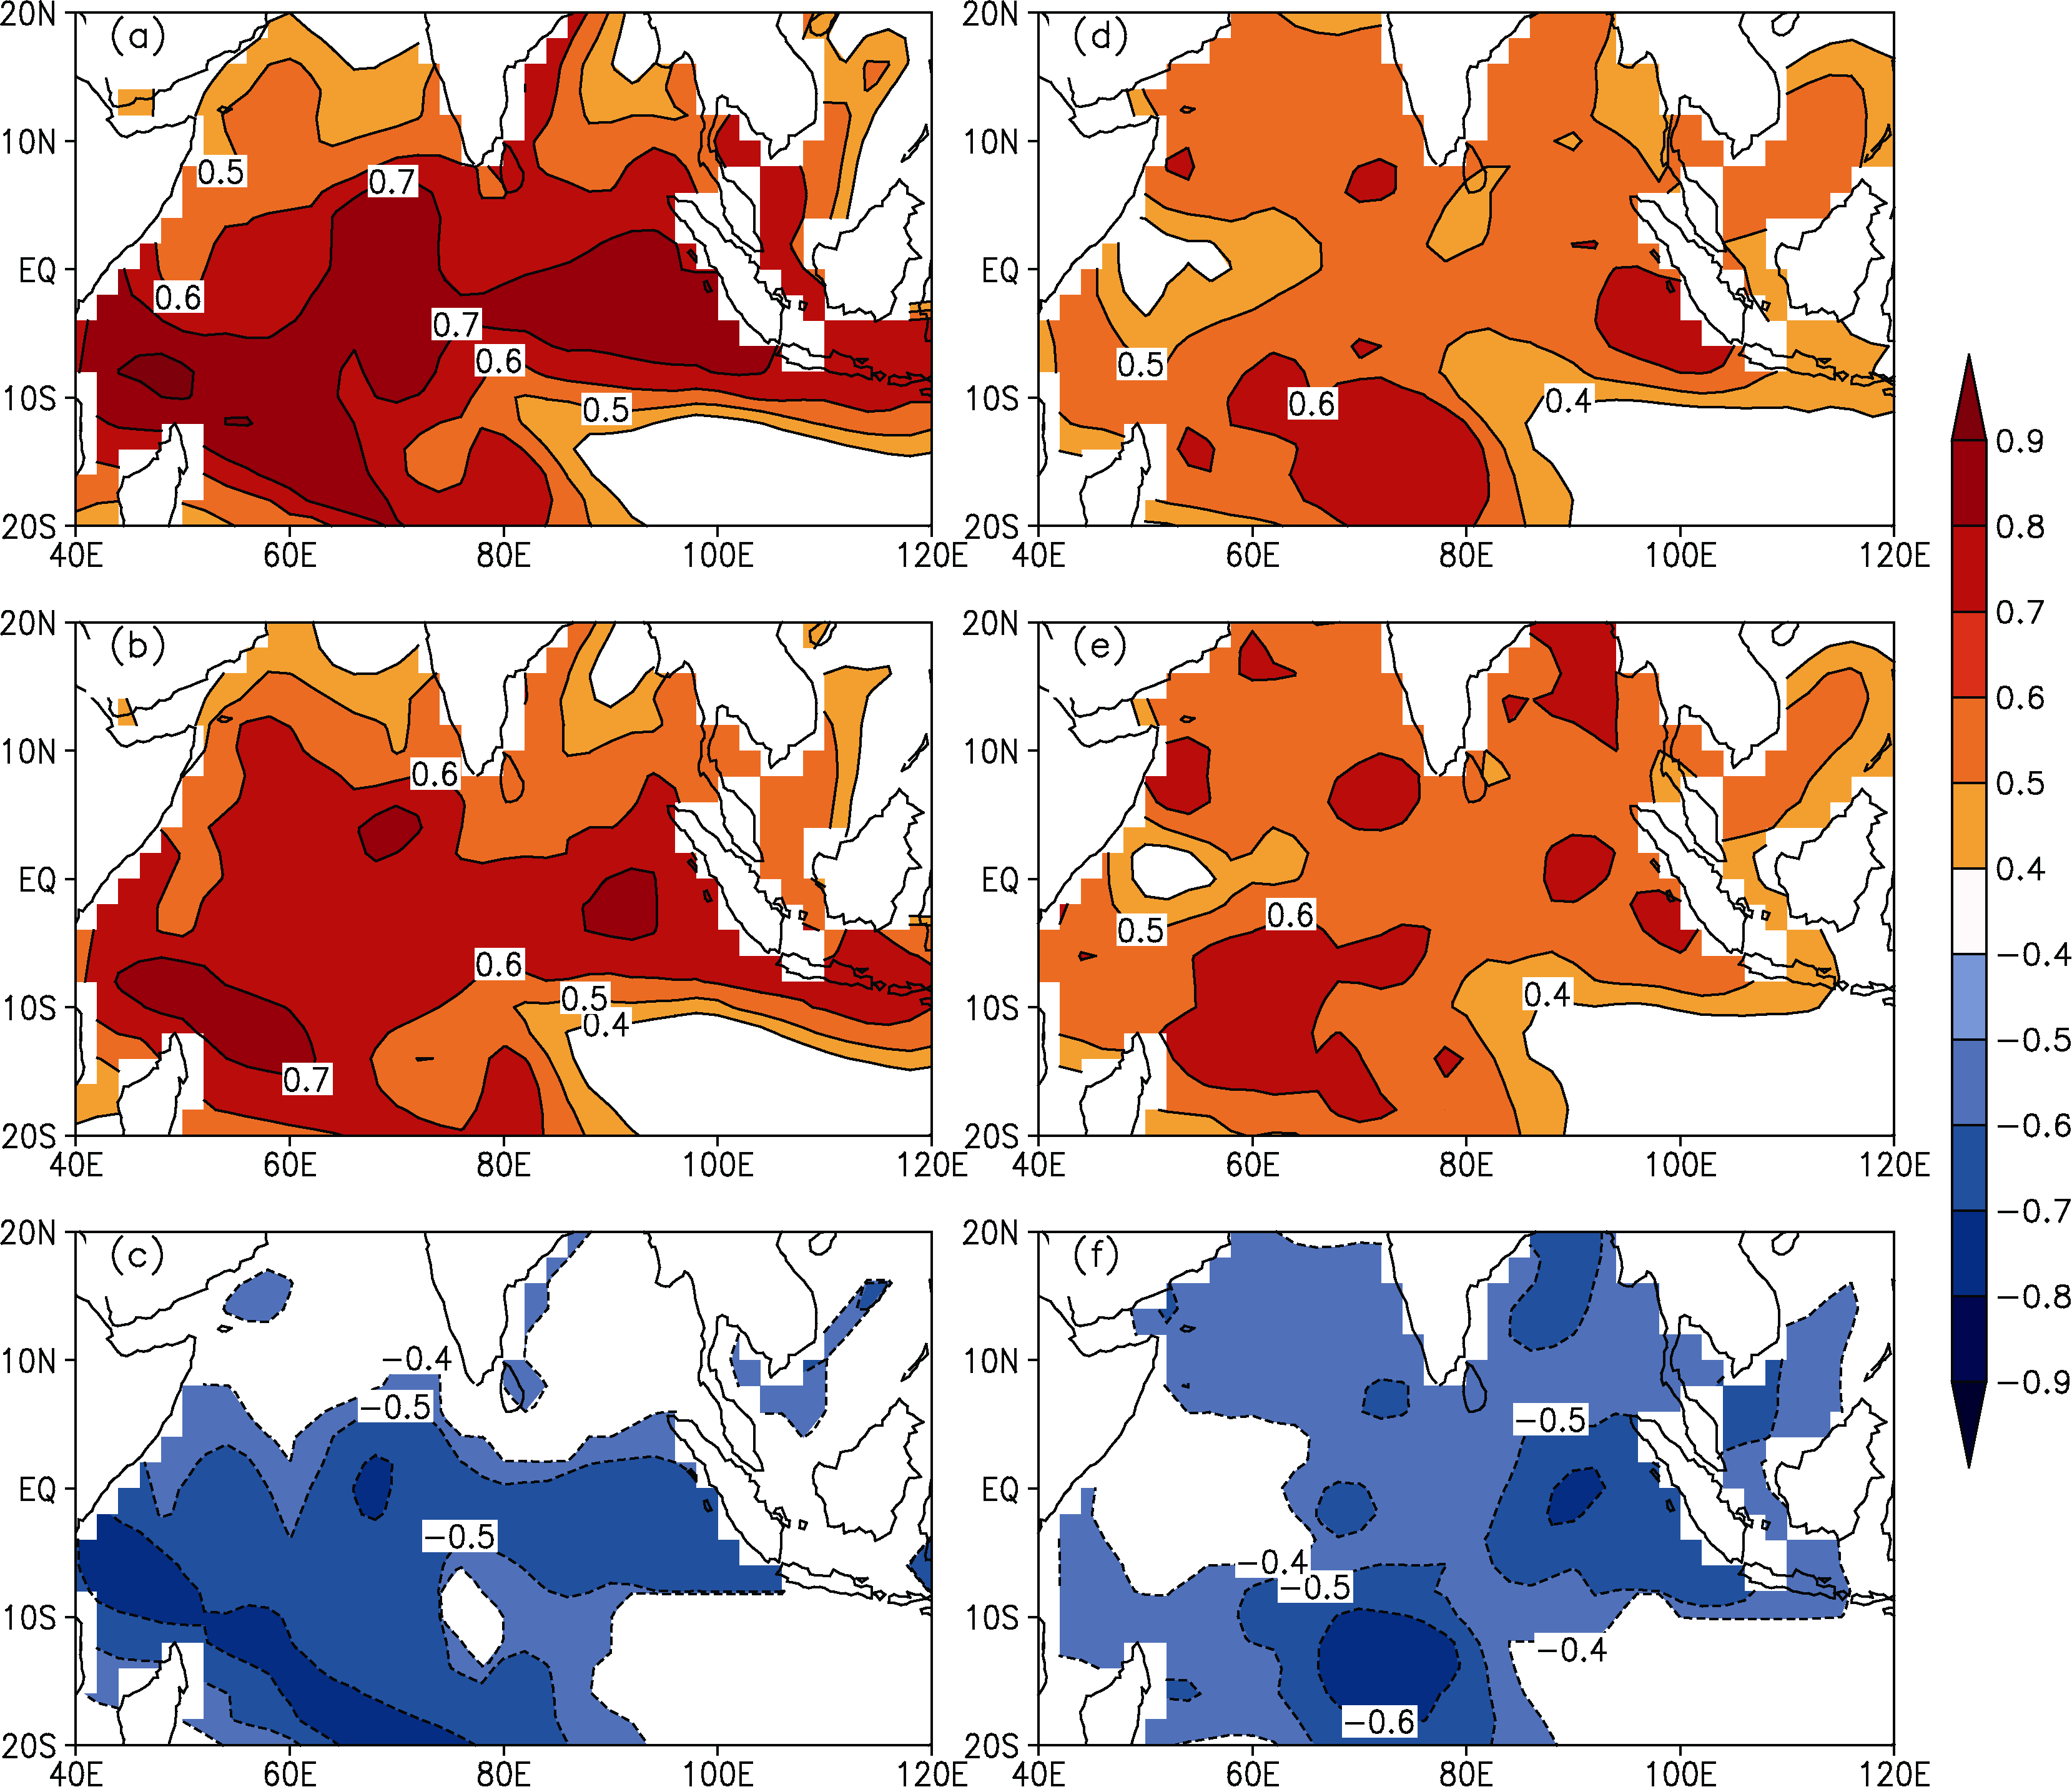 | Figure 1 (a)-(c) Maximum correlation coefficients between the lagged sea surface temperature (SST) over the tropical Indian Ocean and Index I, Index II, and Index III, respectively, in April during 1971-2000. Areas with a coefficient above the 95% confidence level (0.4) are shaded. The contour interval is 0.1. The positive values are contoured with solid lines, while the negative values are contoured with dashed lines. (d)-(f) are the same as (a)-(c) but for July. |
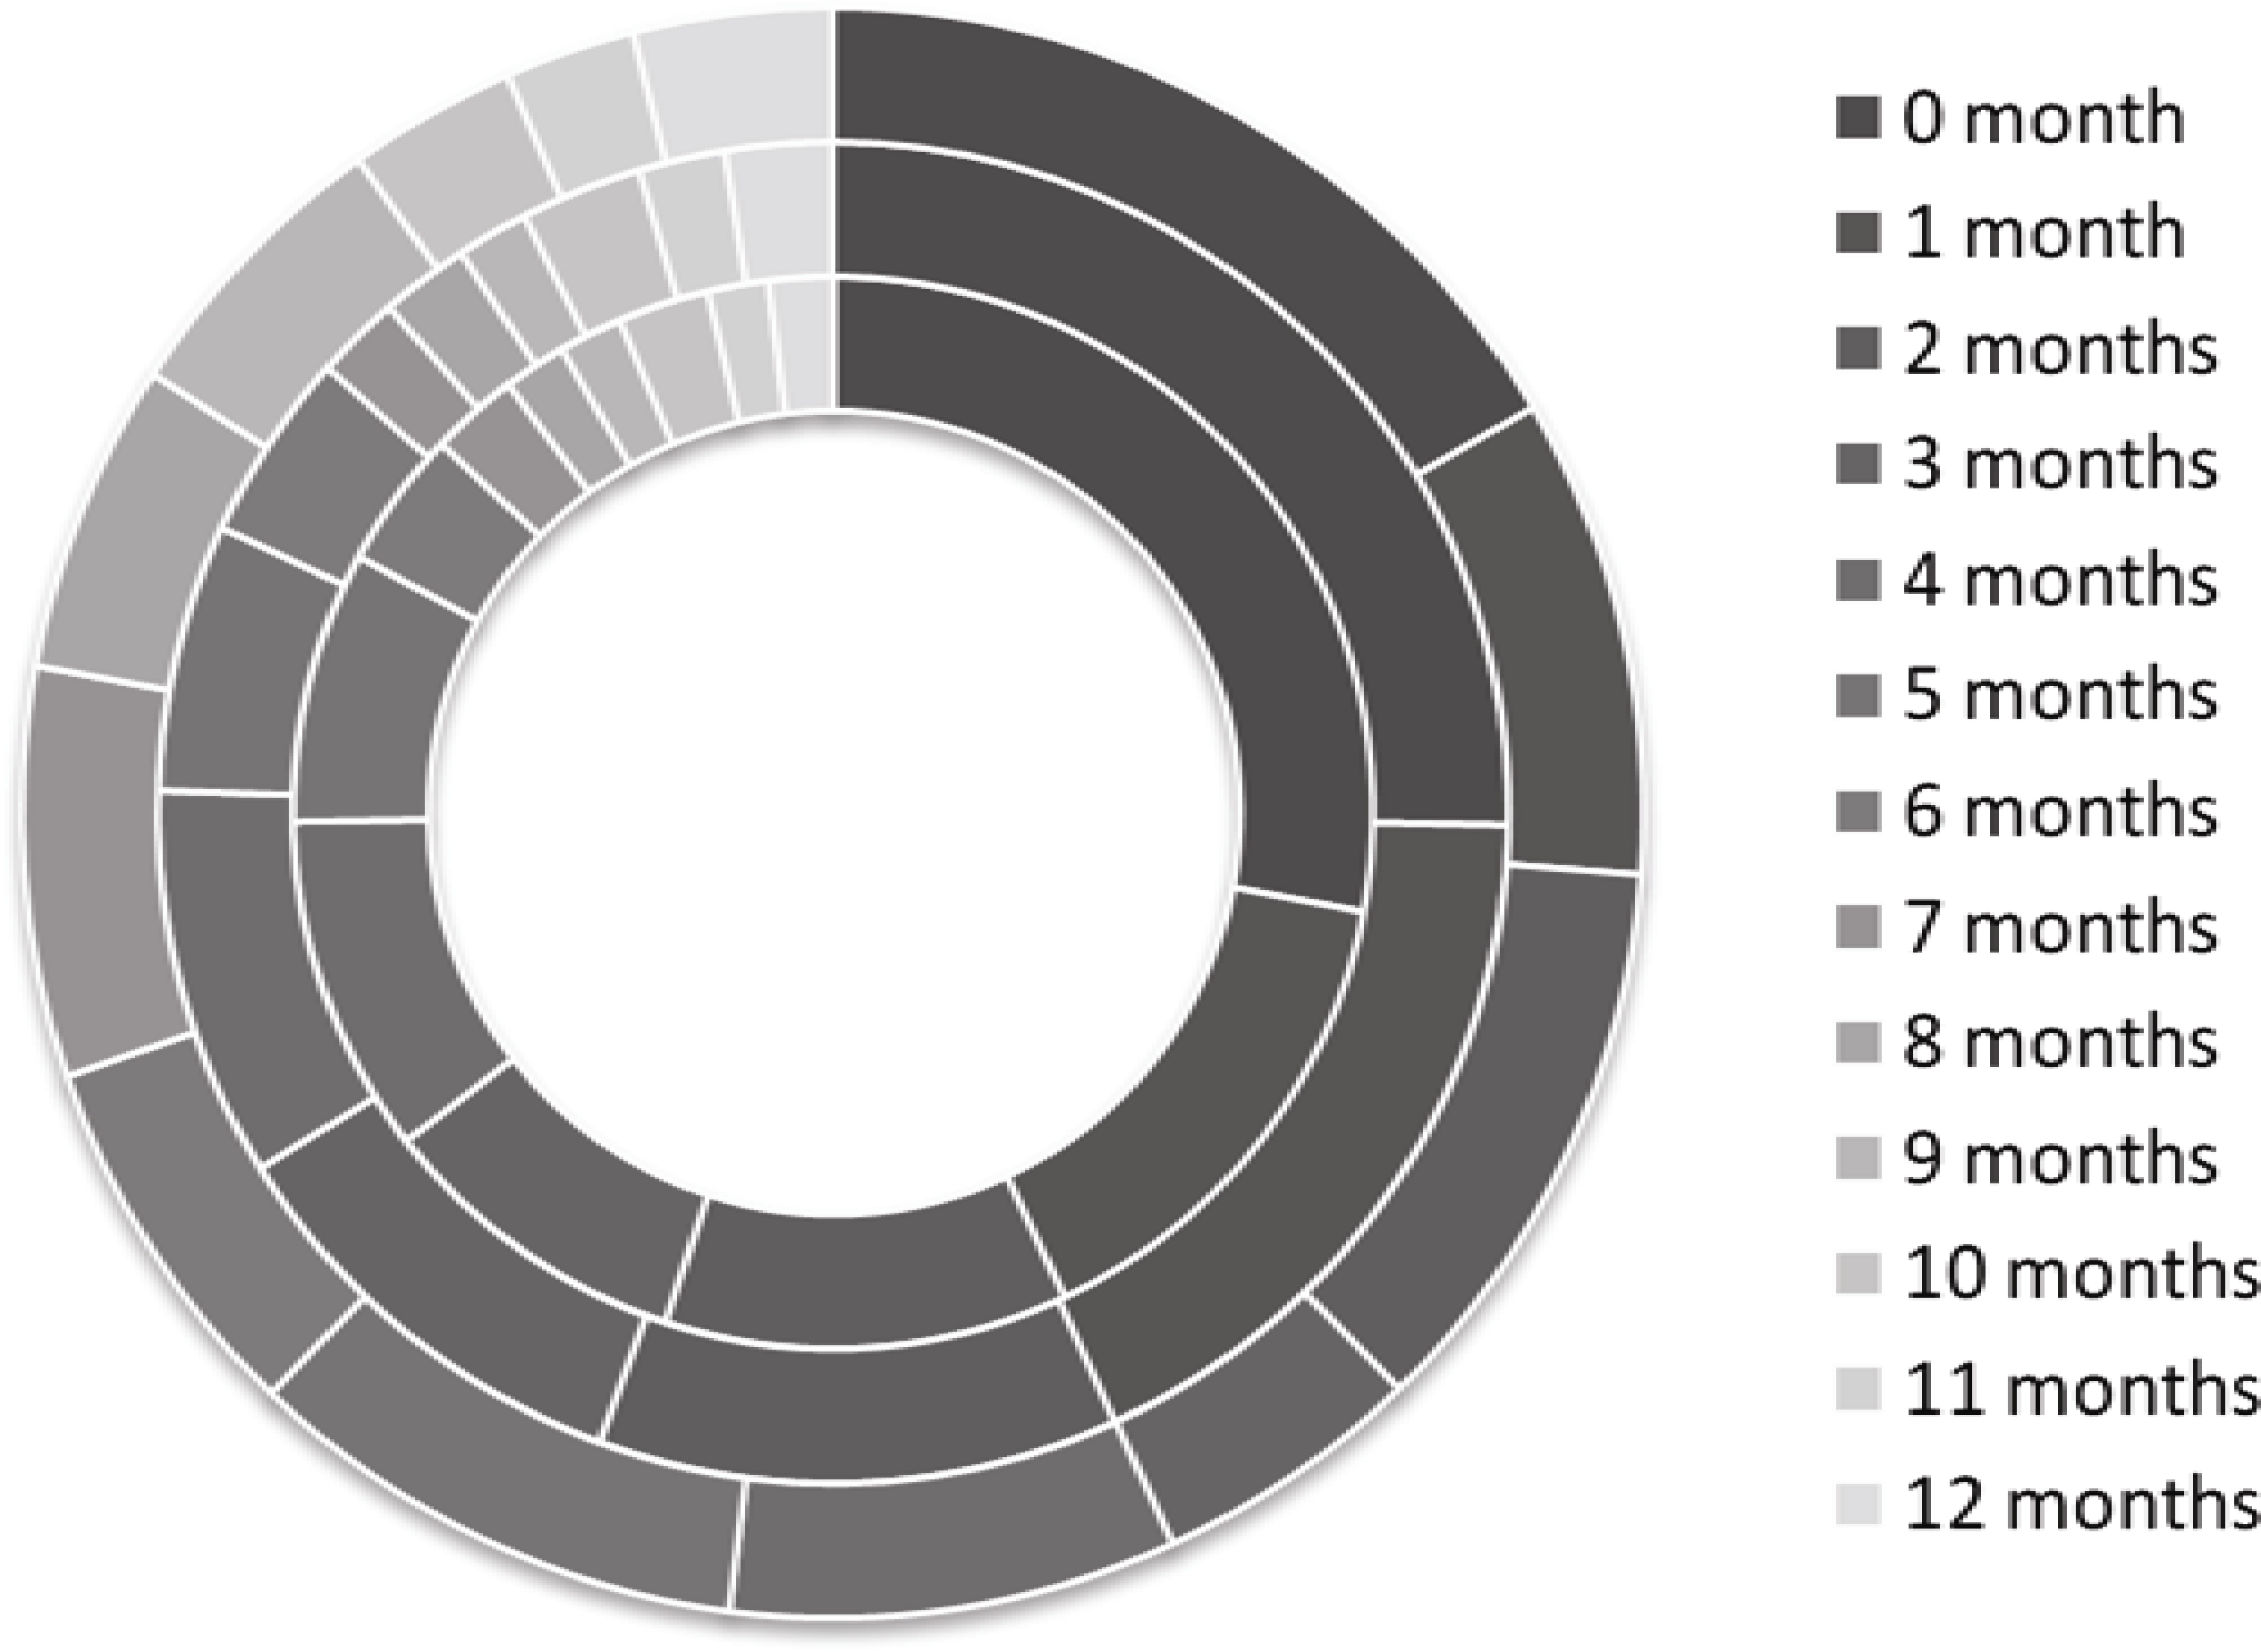 | Figure 2 Percentage distribution of each lagged month corresponding to the maximum correlation coefficient for Index I (inner circle), Index II (middle circle), and Index III (exterior circle). The northern parts of the circles are the starting points at 0%; the percentage is increased equally in a clockwise direction. An integrated circumference implies 100%. |
To validate the ability of the combined predicted SST over the tropical Indian Ocean in the WPSH prediction, the model was applied to each month of MAMJJA with six-month hindcasts from 1983 to 2008.
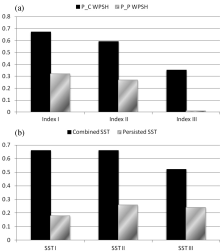
Zeng et al. (2010) simulated the impact of the SST anomaly in the tropical Indian Ocean upon the interdecadal variations of the three WPSH indices by using the NCAR CAM3 global atmospheric circulation model. The correlation coefficients between the observed and simulated WPSH indices were 0.65, 0.61, and 0.27 for the Index I, Index II, and Index III, respectively. In this paper, the prediction skills for each WPSH index were calculated by using the total 156 retrospective predicted samples. For comparison, the correlation coefficients of indices I, II, and III predicted by P_C and P_P are shown in Fig. 3a. The temporal correlations of the observed and P_C predicted WPSH indices were 0.67, 0.59, and 0.35, which is close to the simulation skills. The scores of P_P predicted WPSH indices were 0.32, 0.27, and 0.01, which differed significantly from those of P_C. Moreover, in the P_C and P_P predictions, as well as the simulation, the skills of Index I and Index II overmatched that of Index III. The WPSH prediction skills presented in this paper and the simulation skills of Zeng (2010) are consistent with the correlation relationships described in the section 3 such that the better lagged relationships enable higher prediction and simulation scores. For the comparison, of the RMS errors (RMSEs) of P_C and P_P are listed in Table 1. Obviously, those of the former were smaller than those of the latter for each WPSH index.
To investigate the effect of SST forecast skill on WPSH prediction, we selected the values of the forecasted SSTs employed by each WPSH index prediction and calculated the correlation coefficients between those forecasted SSTs and the observations. The SST correlating to the P_C was considered as the combined forecasted SST, and that correlating to the P_P was considered as the persisted SST. The SSTs relevant to Index I, Index II, and Index III were dissimilar and correspondingly are referred to as SST I, SST II, and SST III. The correlation coefficients for the values employed in P_C and P_P are shown in Fig. 3b. Interestingly, the scores of the SST I, SST II, and SST III correlating to the P_C were 0.66, 0.66, and 0.52 and were all are higher than those correlating to the P_P, which were 0.18, 0.30, and 0.24. These results indicate that the monthly prediction skills of the WPSH indices have a strong dependence on the SST skill.
 | Figure 3 (a) Prediction skills from 1983-2008 for the time serials of the predicted western Pacific subtropical high (WPSH) indices with prediction driven by the persisted SSTs; (P_P models, dark colors) and combined forecasted SST (P_C models, light colors). (b) is same as (a) but for the correlative forecasted SSTs. |
| Table 1 Prediction RMSEs of persisted SST predictions (P_P) and combined forecasted SST predictions (P_C) for Index I, Index II, and Index III. |
The seasonal characteristics of temporal correlations between the observed and predicted WPSH indices are shown in Fig. 4a. The correlation skills and the RMSE skills (figure is not shown) of the P_C predicted WPSH indices for each calendar month of the spring and summer seasons were higher than those of the P_P predicted WPSH indices. Similarly, the skills of the SST correlating to the P_C were higher than those correlating to the P_P (Fig. 4b). It appears that the dependence of the WPSH prediction skills on the SST forecast skill did not change along with the seasonal evolution.
Although few differences were detected between the prediction skills of Index I and Index II in each month of MAMJJA, the prediction of Index III was less effective than that of Index I and Index II in most calendar months of MAMJJA. In addition, the forecast skills of SST I and SST II outscored that of SST III. This disparity is consistent with the difference described in 5.1 and implies that the effective indication to the WPSH indices predictions provided by the lagged relationships remained constant during MAMJJA.
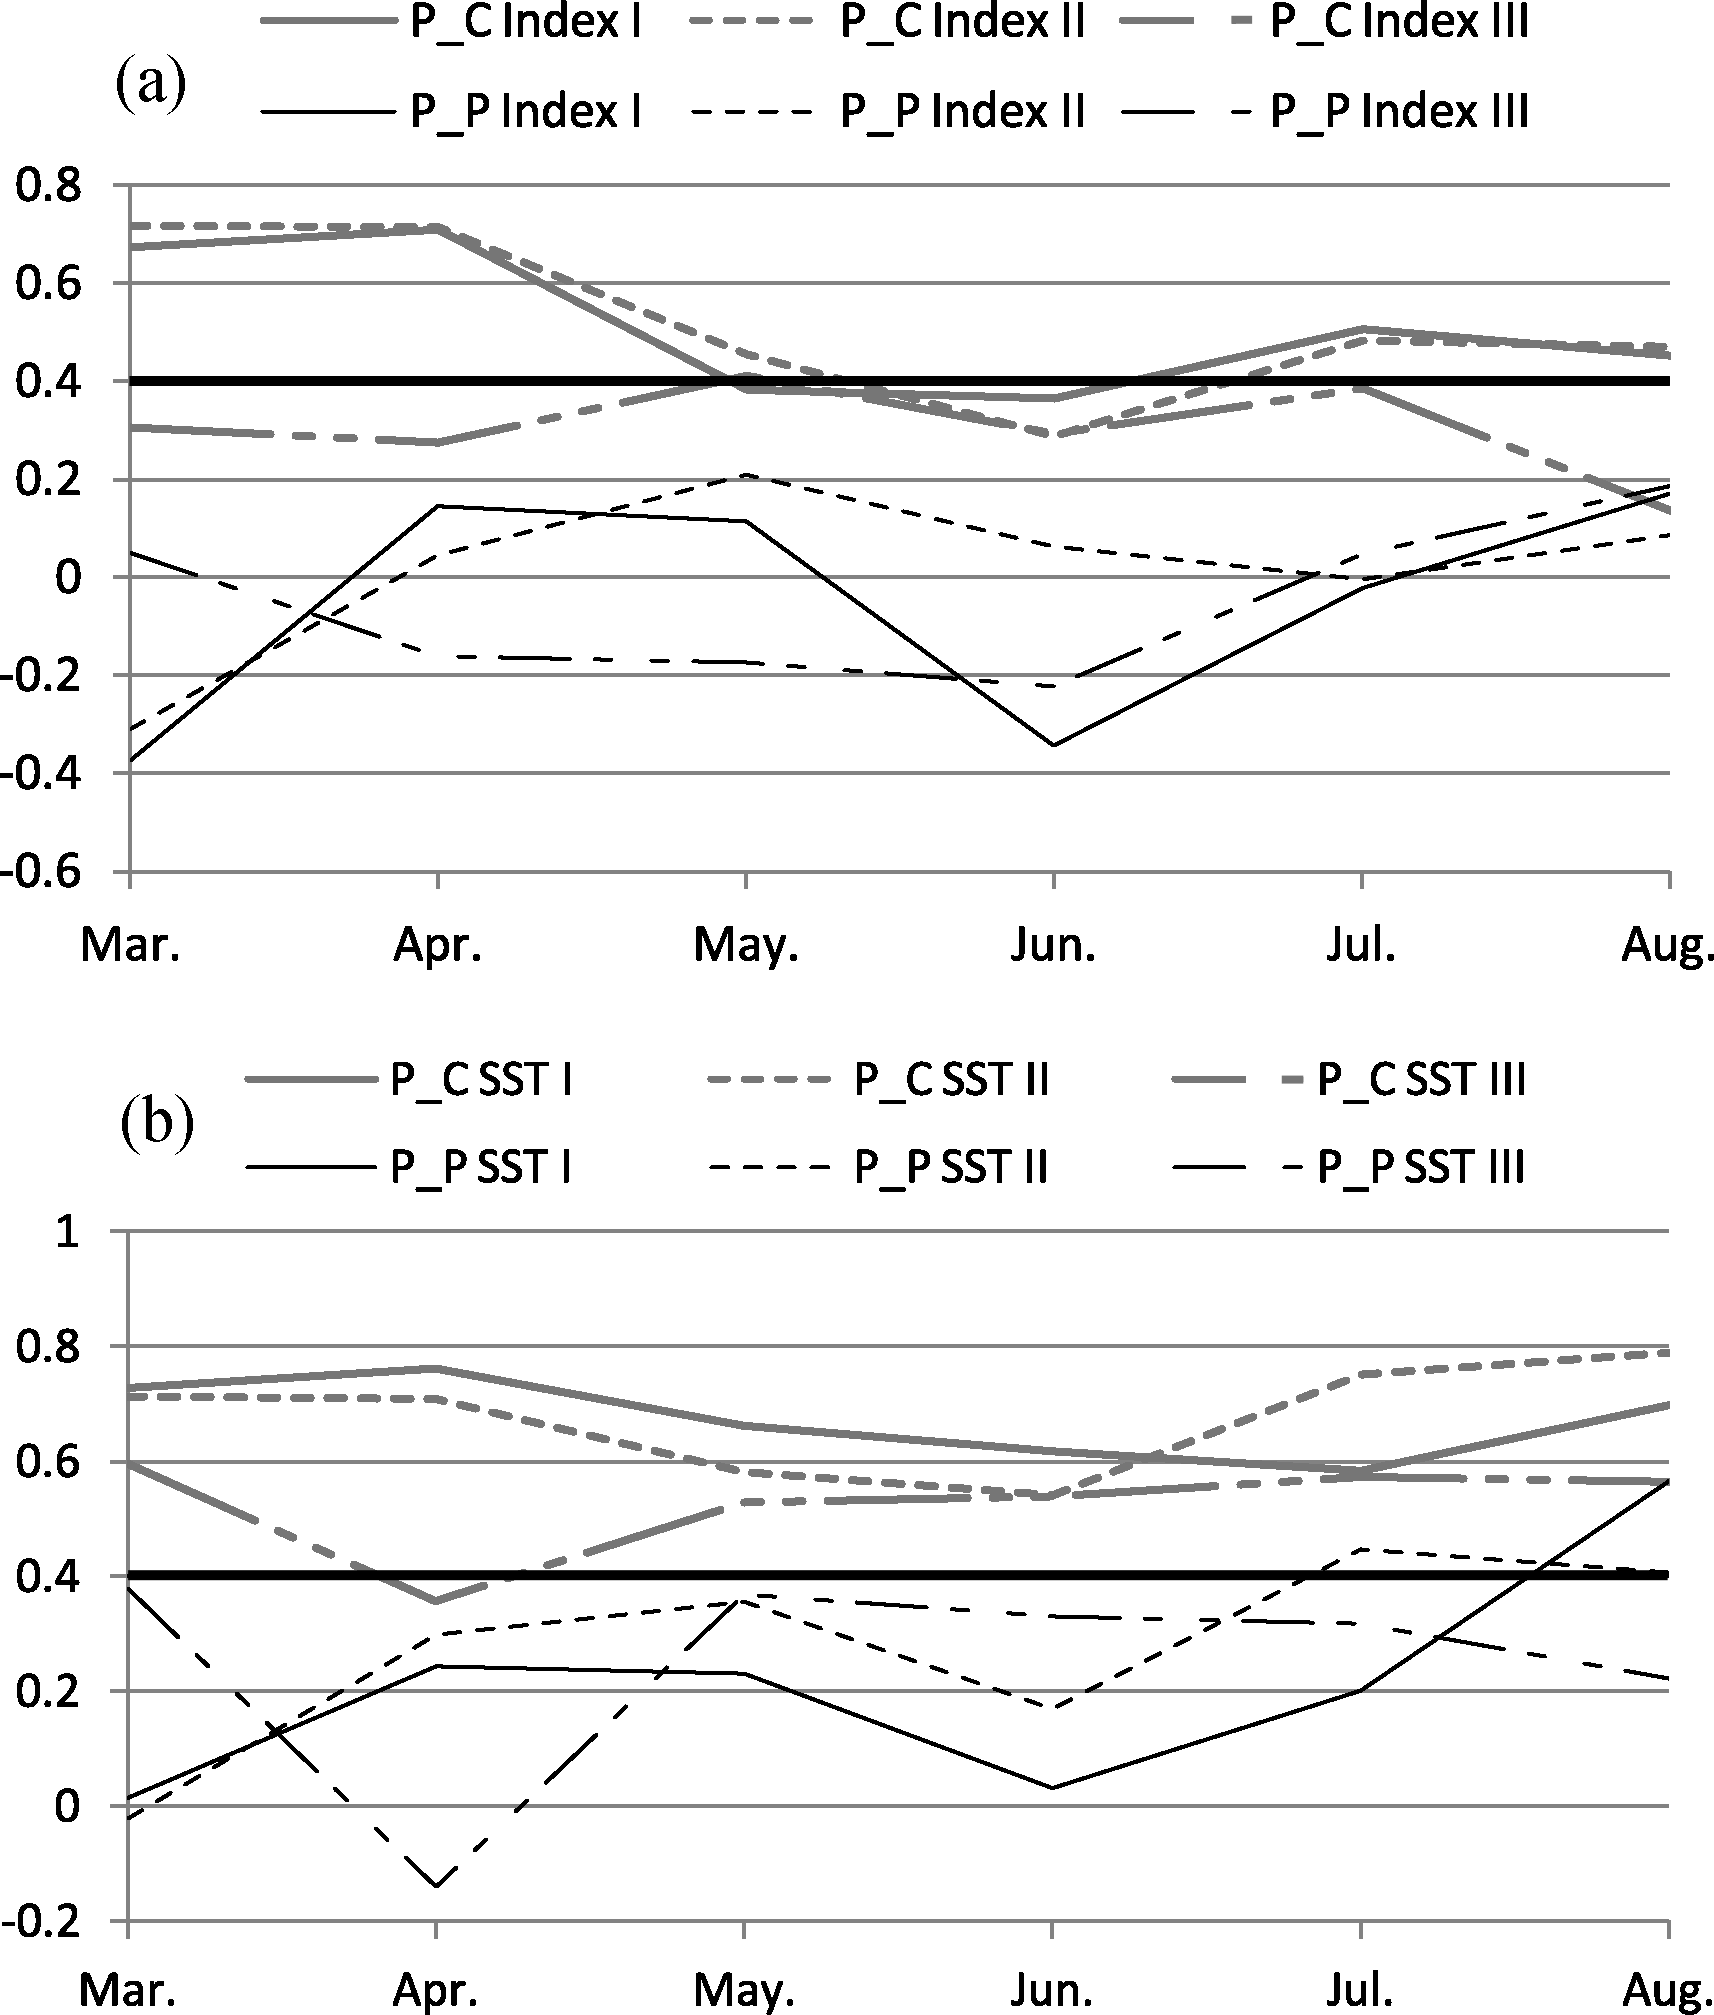 | Figure 4 (a) Correlation coefficients between the forecasted and observed Index I (solid lines), Index II (dashed lines), and Index III (dot dashed lines) from 1983-2008 as a function of calendar month. The combined forecasted SST predictions (P_C) are connected with gray bold lines, and the persisted SST predictions (P_P) are connected with black thin lines. The black bold line represents the 95% confidence levels (0.4). (b) is the same as (a) but for the skills of predicted SST corresponding to the WPSH prediction models. |
Skills of the P_C for indices I, II, and III showed nearly the same degree of seasonal variation. Prediction scores of the three indices in spring were appreciably higher than those in summer, and the lowest occurred during months of seasonal flux such as May and June. This characteristic is consistent with the traditional concept such that the synoptic conditions that occur during months of seasonal flux are less understood than those that occur during the middle of the season.
It is widely accepted that the WPSH plays an important role in global atmospheric circulation, particularly in the Asian monsoon system. Although it is also widely accepted that the SST variation in the tropical Indian Ocean has a significant impact on WPSH variation, little research has been devoted to WPSH prediction by using the forecasted SST over the tropical Indian Ocean.
Because the SST forecast over the tropical Indian Ocean has been conducted by the combined dynamic-statistical method, an attempt can be made to predict the WPSH variation on the basis of forecasted SST. We used the WPSH indices developed by NCC/CMA to analyze the linear relationships between lagged SST and WPSH. We determined that the WPSH indices are closely related to the SST over the tropical Indian Ocean and that the relationships maintained effective stability as the seasons or decades changed. Therefore, linear regression prediction models for the WPSH indices were established with the combined predicted SSTs as the predictor. The prediction skill of the WPSH prediction was examined independently for MAMJJA during 1983-2008 in which the P_C was shown to outperform the P_P. This disparity between the P_C and P_P is due differences in the combined predicted SST and the persisted SST.
This prediction model is limited by the linear regression approach; therefore, there is a need for further extensions for the application of the forecasted SST in WPSH prediction. Forecasting could be more accurate if an atmospheric general circulation model (AGCM) is introduced with the forecasted SST as its boundary condition. Therefore, analysis of the outputs of AGCM to obtain the WPSH forecast should be developed in future work.
| 1 |
|
| 2 |
|
| 3 |
|
| 4 |
|
| 5 |
|
| 6 |
|
| 7 |
|
| 8 |
|
| 9 |
|
| 10 |
|
| 11 |
|
| 12 |
|
| 13 |
|
| 14 |
|