

Using Satellite Data to Analyze the Initiation and Evolution of Deep Convective Clouds
[CAO Zhi-Qiang1, 2, 3  , HUANG Qing-Ni
3 , ZHAO Su-Rong4 ]
, HUANG Qing-Ni|
|


In this study, two deep convective cloud cases were analyzed in detail to study their initiation and evolution. In both cases, all deep convective clouds were positioned at the rear of the cold front cloud bands and propagated backward. Satellite data showed that prior to initiation of the deep convective clouds, thermodynamic and moist conditions were favorable for their formation. In the morning, a deep convective cloud at the rear of cold front cloud band propagated backward, the outflow boundary of which created favorable conditions for initiation. An additional deep convective cloud cluster moved in from the west and interacted with the outflow boundary to develop a mesoscale convective system (MCS) with large, ellipse-shaped deep convective clouds that brought strong rainfall. The initiation and evolution of these clouds are shown clearly in satellite data and provide significant information for nowcasting and short-term forecasting.
Because deep convective clouds often bring thunderstorms, strong rainfall, hail, and tornadoes, monitoring their initiation and evolution is of utmost importance. However, forecasting the short-time duration and intense nonlinear dynamic processes of mesoscale convective systems (MCSs) by using numerical methods has certain limitations. Moreover, the radiosonde observation approach contains inaccuracies due to sparse distribution in time and space ( Yu et al., 2005). Since the 1950s, radar has been applied to identify strong convective weather ( Zhang et al., 2001), and an array of methods developed to trace its evolution has been widely applied to short- term forecasting and nowcasting. However, this method, which is based on echoes of distinguished deep convective clouds, is not suitable for analysis of environmental characteristics because it identifies only cloud intensity and does not effectively represent water vapor and thermal characteristics of the environmental field. Geostational meteorological satellites have large observation views and high temporal and spatial resolutions; therefore, these satellites have been widely applied to weather analysis. Such applications focus mainly on detection and analysis of mesoscale convective clouds (MCCs); however, satellite data are rarely applied to analysis of thermal and dynamic conditions prior to deep convective clouds initiation and thus have little forecasting significance. In this study, several deep convection cases were selected, two of which were analyzed in detail to study the initiation and evolution of deep convective clouds.
The deep convection cases selected in this study generally occurred north of the Changjiang River in East China (Table 1). The main weather system includes westerly wind trough and cold vortex cloud systems, which produce thunderstorms, hail, and gales. Heavy rainfall occurs when the water vapor content is excessive. Deep convective clouds are initiated at the rear of the cloud band corresponding to the weather system, and their wind fields are relatively weak. Thus, accurate forecasting of deep convection systems is difficult.
| Table 1 Deep convection cases. |
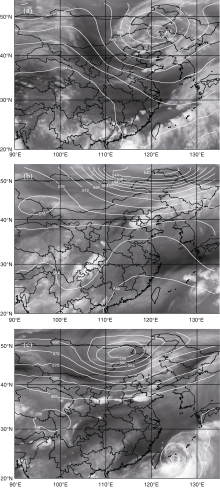
Two cases were selected from those listed in Table 1 for detailed analysis. The first case occurred in Jiangsu and Anhui provinces on 5 June 2009; the second occurred in Hebei and Shandong provinces on 26 July 2012. In the case studies, we used FY-2C and FY-2E geostational meteorological satellite data together with National Centers for Environmental Prediction (NCEP) Final Operational Global Analysis data to examine the initiation and evolution characteristics of deep convective clouds. In addition, we explored the application of satellite data of deep convection nowcasting. To obtain an overview of the characteristics of these cases, water vapor channel images were overlaid with 500 hPa geopotential height for the remaining three cases listed in Table 1 (Fig. 1).
The use of brightness temperature threshold is an easy and reliable method for identifying deep convective clouds. Maddox (1980) used 241 K and 221 K and Velasco and Fritsch (1987) used 233 K for brightness temperature thresholds in MCC identification. Although different brightness temperature thresholds indicate specific areas of deep convective clouds, the area of strong convective clouds is in linear proportion to the brightness temperature when it is between 225 K and 245 K ( Machado et al., 1993; Mapes and Houze, 1992). Therefore, 233K was used to identify deep convective clouds in our case studies.
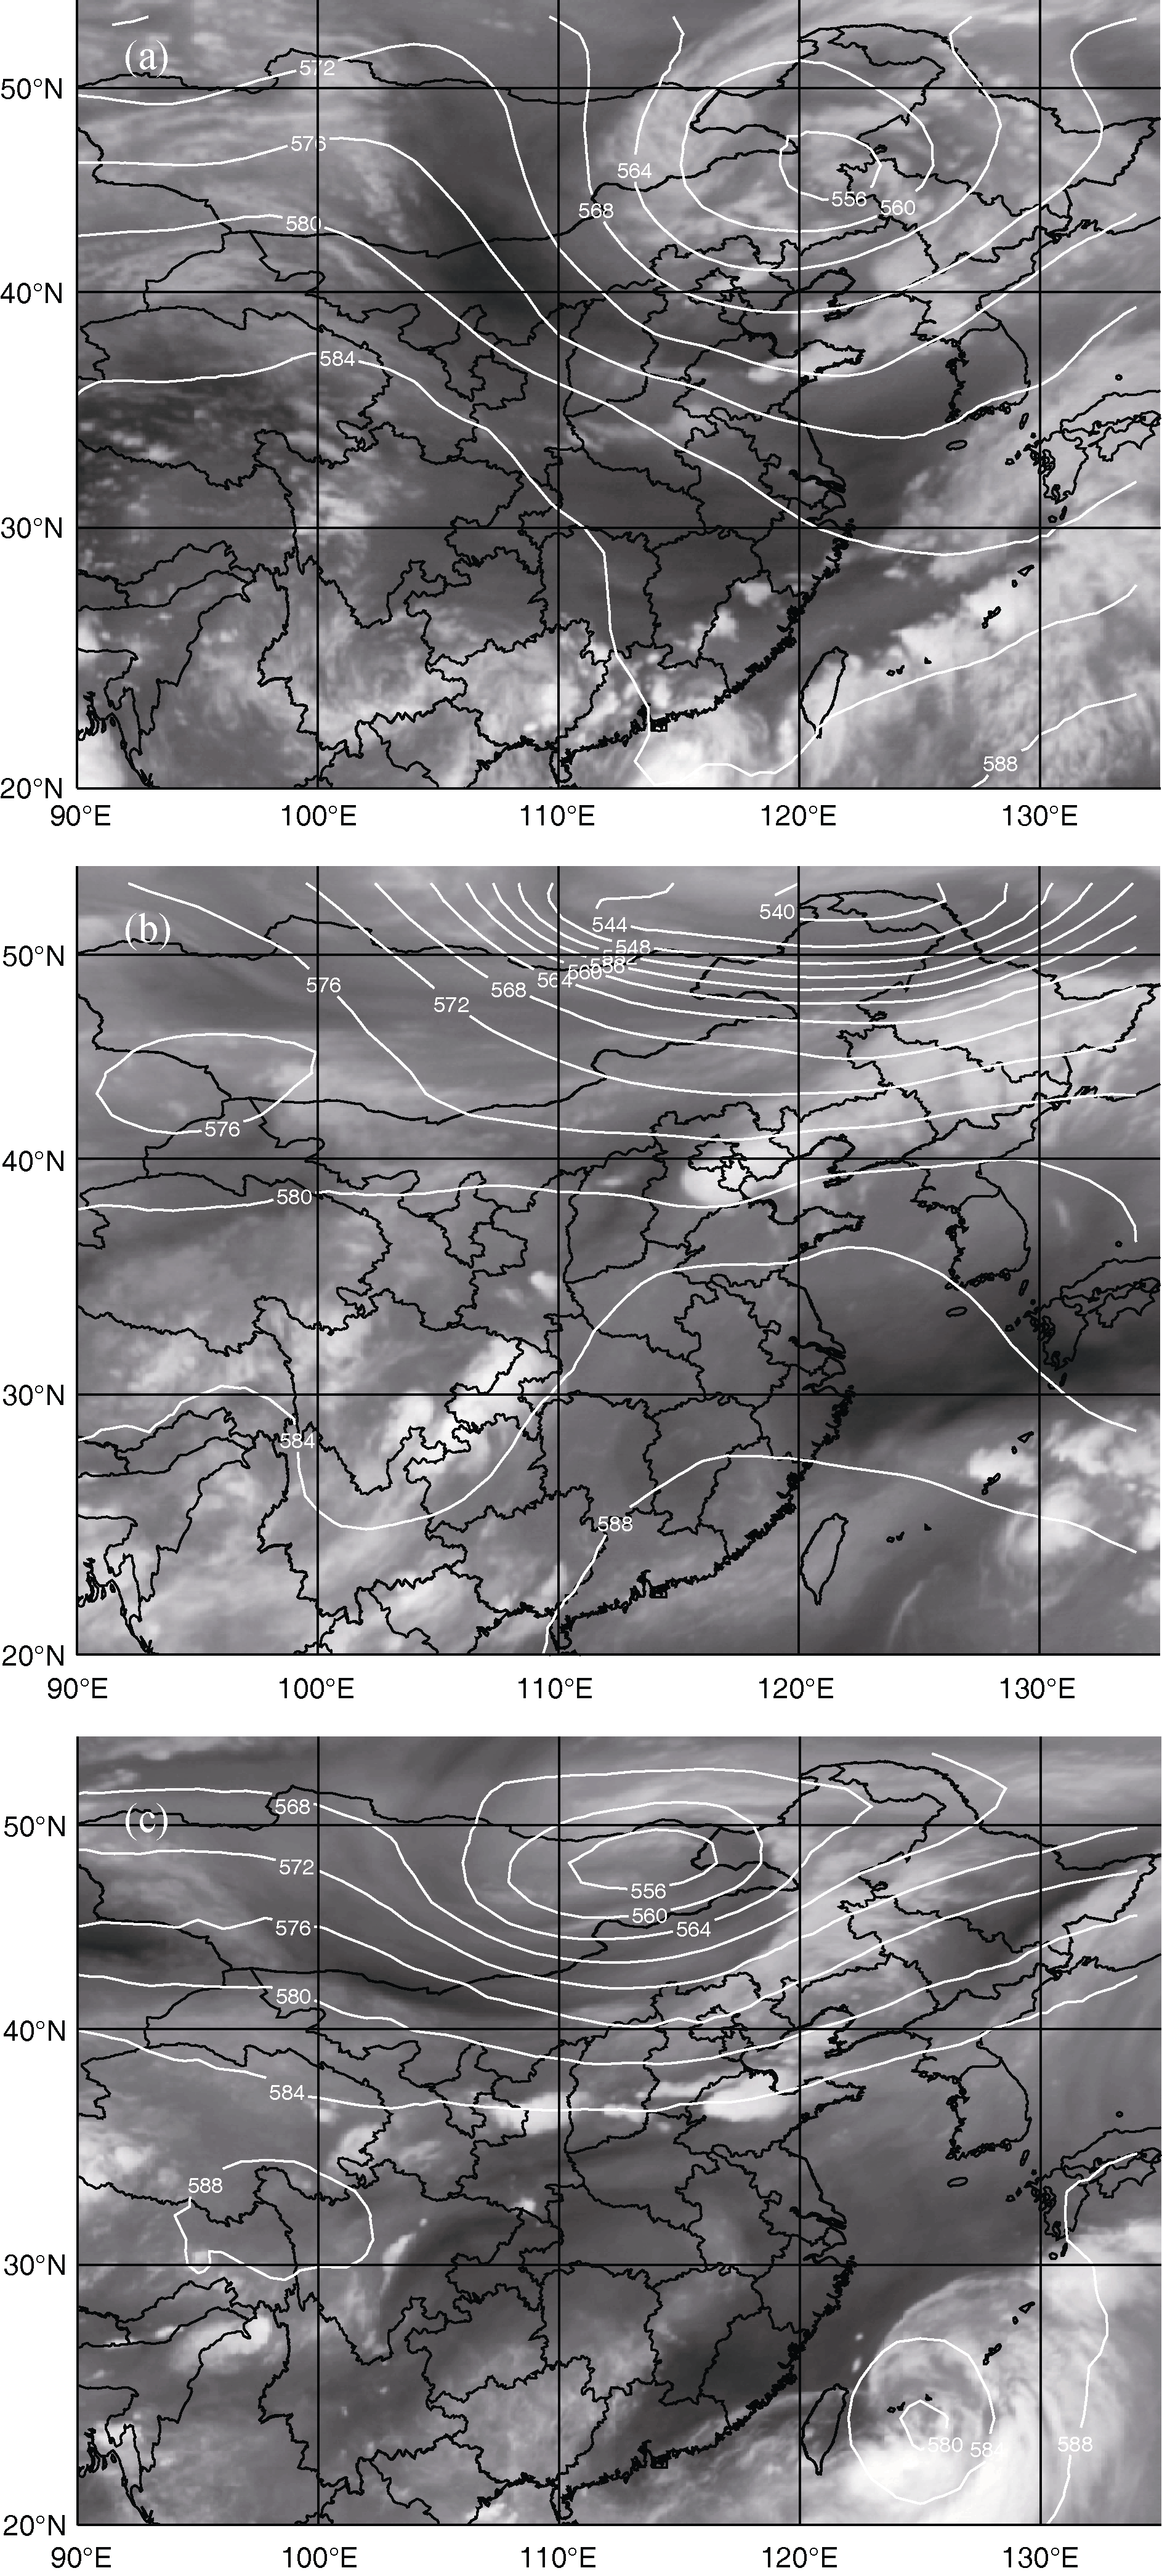 | Figure 1 Overlaid imagery of FY geostationary satellite water vapor channel data (a) 14:00 BT 14 June 2005, (b) 8:00 BT 18 July 2007, (c) 2:00 BT 9 August 2010, and NCEP 500 HPa geopotential height data. |
On 5 June 2009, a deep convective weather event occurred in the Jiangsu and Anhui areas in which many surface observation stations reported hail, and a town in Peixian County of Jiangsu Province was hit by a tornado.
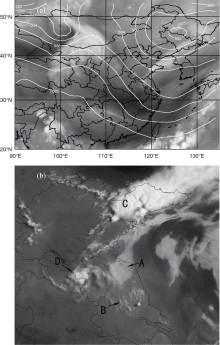
Prior to deep convective cloud initiation, two troughs and one ridge feature of middle-high latitude circulation appeared (Fig. 2a). In the northeast area, a closed circulation system corresponded to a northeastern cold vortex, and a cold front cloud band existed with a tail located in Shandong Peninsula. A dark boundary appeared behind the cold front, which implies a weak downdraft of cold air mass at high altitudes. Figure 2b shows a visible channel image including four conditions marked “A”-“D”. “A” represents advection fog, which indicates low wind speed; “B” represents convective clouds, which indicates atmospheric instability and an abundance of water vapor at the low level of the troposphere, in addition to uneven heating by solar radiation in the surrounding atmosphere; “C” represents deep convective clouds; and “D” represents an isolated convective cloud cluster. These conditions are favorable for deep convective cloud initiation because in summer, wind speed is low, which enables the thermal characteristics necessary for the initiation and evolution of such clouds ( Chen, 2005). The contour of brightness temperature at 10:00 Beijing time (BT) was in greater disorder than at 8:00 BT, which implies uneven heating by the sun (Fig. 3). The deep convective cloud represented by “C” is the tail of the cold front, which propagated southwest in a direction nearly opposite that of the cloud band movement. Such movement is referred to as backward propagation in this paper. When the tail propagated near the aforementioned unstable area, deep convective clouds were initiated.
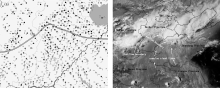
 | Figure 2 (a) Overlaid imagery of FY-2C water vapor channel data and NCEP 500 hPa geopotential height data captured at 8:00 BT 5 June 2009; (b) Visible channel imagery of FY-2C at 8:00 BT 5 June 2009. |
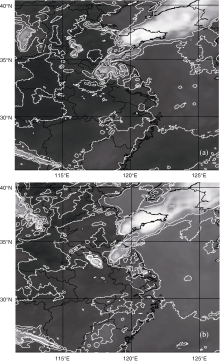
The brightness temperature threshold was used to identify deep convective clouds, which are marked in Fig. 4 by dark shading; the black curved lines indicate their movement paths. As shown in Fig. 4a, a deep convective cloud was located over Shandong Peninsula. The cloud moved southwest in the general direction of Jiangsu province (Fig. 4b) and experienced evolution processes of mergence, splitting, and extinction, which caused severe weather in a large area north of Jiangsu and Anhui. At 18:00 BT, nearly all of the clouds merged together, as shown in Fig. 4d. However, the irregular shape of the merged cloud indicates that it did not form a complete circumfluence. After 30 min, the deep convective cloud split into five clouds, the largest of which was located in Anhui and Jiangsu (Fig. 4e), to subsequently form an MCS of alpha scale (MaCS). At approximately 20:00 BT, the system evolved into its most intensive form, as indi cated in Fig. 4f by light shading. The area of brightness temperature less than 241 K was approximately 100000 km2 whereas that for bright temperature less than 221 K was approximately 35000 km2. Such conditions nearly satisfy the definition of MCC reported by Maddox (1980); however, the duration time is obviously shorter than that included in the definition. After 22:30 BT, the cloud began to weaken before disappearing north of Zhejiang Province; Figure 4f shows the cloud movement path.
 | Figure 3 Infrared imagery of FY-2C satellite with brightness temperature contours at (a) 8:00 BT and (b) 10:00 BT 5 June 2009. |
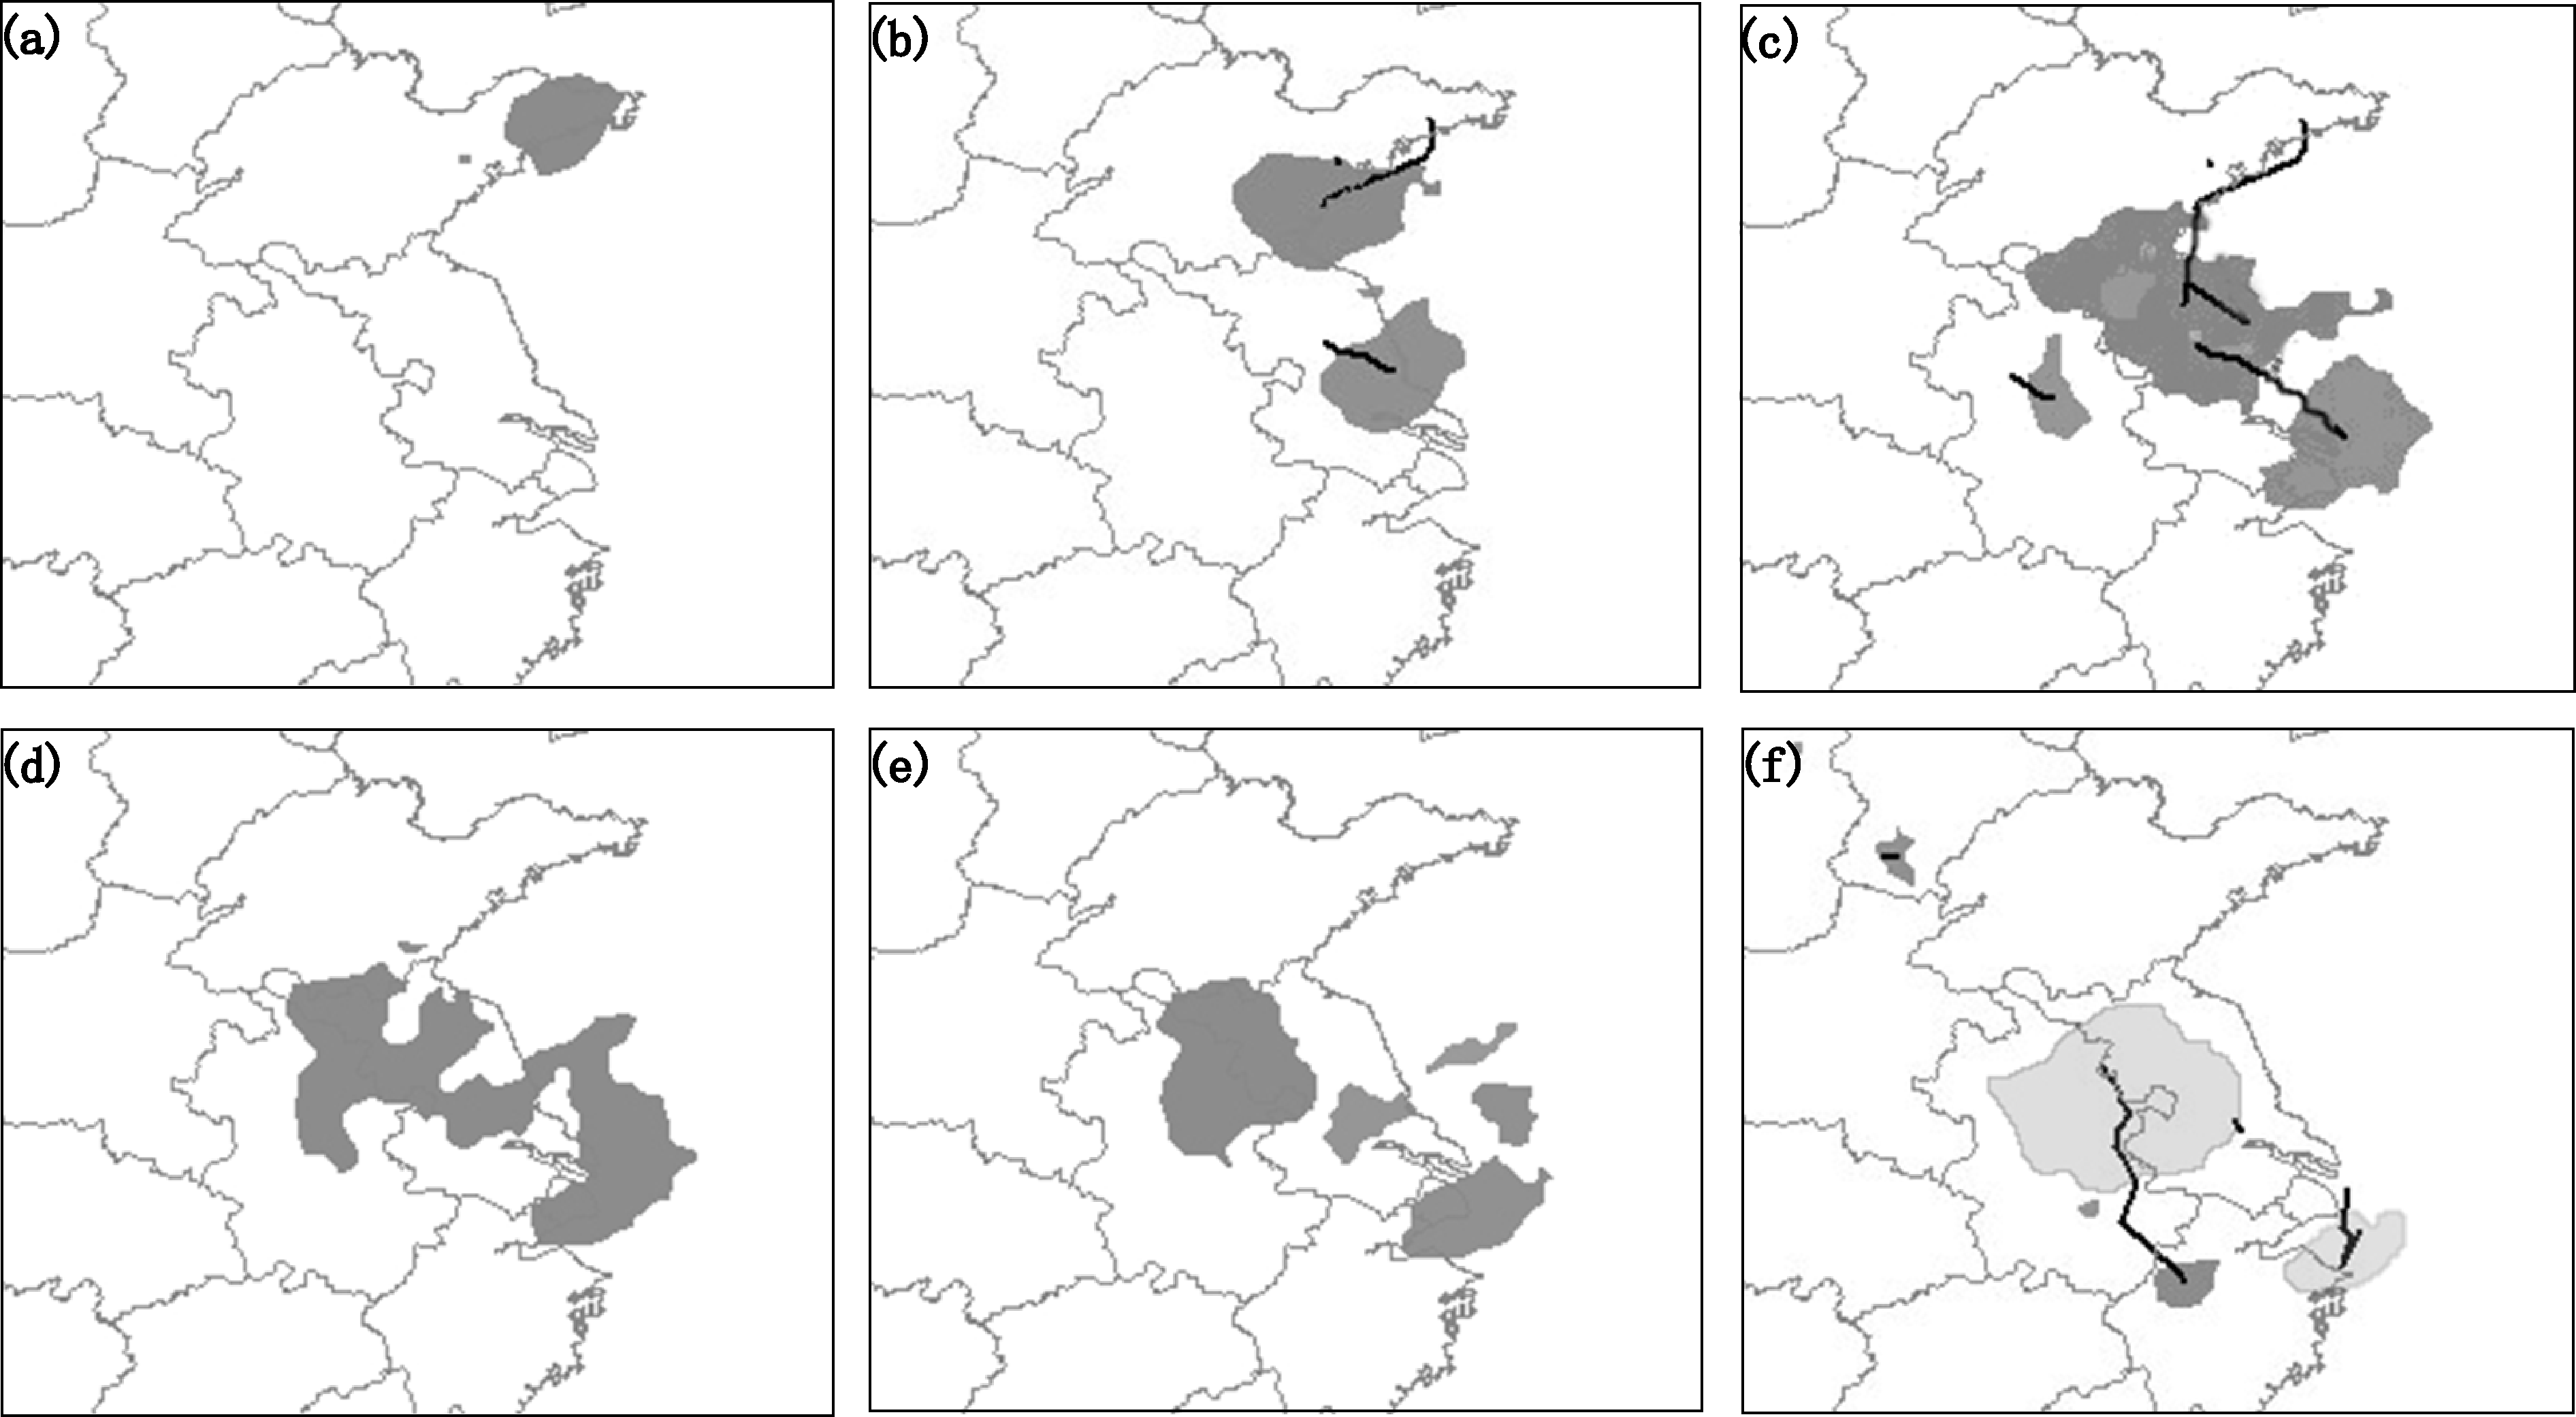 | Figure 4 The identification and moving path of the deep convective cloud on 26 July 2012: (a) Identification graph at 10:00 BT; (b) identification graph at 14:30 BT and movement path at 10:00-14:30 BT; (c) identification graph at 17:30 BT and movement path at 10:00-17:30 BT; (d) identification graph at 18:00 BT; (e) identification graph at 18:30 BT; (f) identification graph at 24:00 and movement path at 19:00-24:00 BT. Light shading represents deep convective cloud of occurring at 20:00 BT. |
From the afternoon until midnight on 26 July 2012, heavy rainfall of a lengthy duration occurred in a widespread area that included southern and northern regions of Hebei and Shandong provinces, respectively. This rainfall event was caused by an MaCS composed by deep convective clouds that was initiated at the rear of a cloud band.
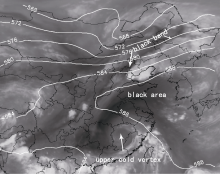
Figure 5 shows the FY-2E water vapor channel image overlaid with NCEP 500 hPa geopotential height data captured at 8:00 BT on 26 July 2009. A trough of low pressure was present over the eastern regions of Mongolia and Inner Mongolia. Corresponding to this trough was a cold-front cyclone cloud system with an occluded head. A dark band present behind the cold front cloud band indicates a dry air mass at the upper level of the troposphere. At the southern part of the cold front cloud band, an enclosed contour line of 588 dam appeared, which is characteristic of subtropical anticyclonic high pressure. In addition, the appearance of a dark area west of the 588 dam contour area, which moved northwest to accompany the upper cold vortex in Jiangxi Province, is indicative of a dry air mass in the middle-high troposphere. The area of convective clouds initiation and evolution was located between these two dark areas in the figure.
Figure 6a shows the surface observation of wind, temperature, and weather phenomena captured at 14:00 BT 26 July 2012. The double line in the figure represents the boundary layer convergence line. The atmospheric temperature at a 1.5 m height at most stations south of the line in the southern and northern regions of Hebei and Shandong provinces, respectively, was equal to or greater than 35°C, which is a relatively high temperature. The temperature north of the line was relative low. The wind north of the line in Hebei province was from the east. The wind north of the line in Shanxi Province was not uniform; that south of the line was a quite uniform southerly. The south and east winds brought a substantial amount of moist air to the south of Hebei province and north of Shandong Province, which created favorable conditions for deep convective clouds initiation and significant rainfall. As shown in Fig. 6b, the visible channel image obtained at 15:30 BT indicates the presence of many cumulus cloud lines at Shandong Province and in eastern Henan Province. The direction of these cloud lines was consistent with wind direction.
 | Figure 5 Overlay imagery of FY-2E water vapor channel data and NCEP 500 hPa geopotential height data at 8:00 BT 26 July 2012. |
 | Figure 6 (a) Surface observations of wind, temperature, and weather phenomena at 14:00 BT 26 July 2012; (b) Visible channel imagery of FY-2E at 15:30 BT 26 July 2012. |
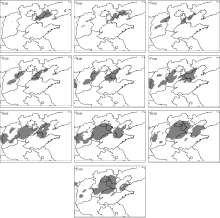
The deep convective clouds affecting south of Hebei province and north of Shandong province were initiated at 12:00 BT (Fig. 7). At the same time, a deep convective cloud appeared over eastern Hebei Province that propagated backward at the next hour. In the middle region of Shanxi Province, two deep convective clouds were initi- ated and matured rapidly from 13:00 to 16:00 BT before moving southeast to form a squall line (Fig. 8).
At 17:00 BT, the squall line was in close proximity to the deep convective cloud over eastern Hebei Province and had already interacted with the outflow boundary of the cloud. The squall line then widened and evolved from 18:00 to 22:00 BT into an ellipse-shaped MaCS; heavy rainfall also occurred during the same period.
At 20:00 BT, when the MaCS was largest, the area of brightness temperature less than 241 K of the deep convective cloud was approximately 170000 km2 whereas that for bright temperature less than 221 K was approximately 90000 km2. Such conditions nearly satisfied the definition of MCC; however, the duration time was slightly short. After 21:00 BT, the area of the MCS began to decrease.
To examine the initiation and evolution of deep con- vective clouds, several deep convection cases were se- lected. In all cases, the deep convective clouds initiated at the rear of a cloud band corresponding to a cold front or a trough and usually propagated backward. Two cases were selected for detailed analysis.
 | Figure 7 Identification of deep convective cloud from from 12:00 BT to 21:00 BT 26 July 2012. |
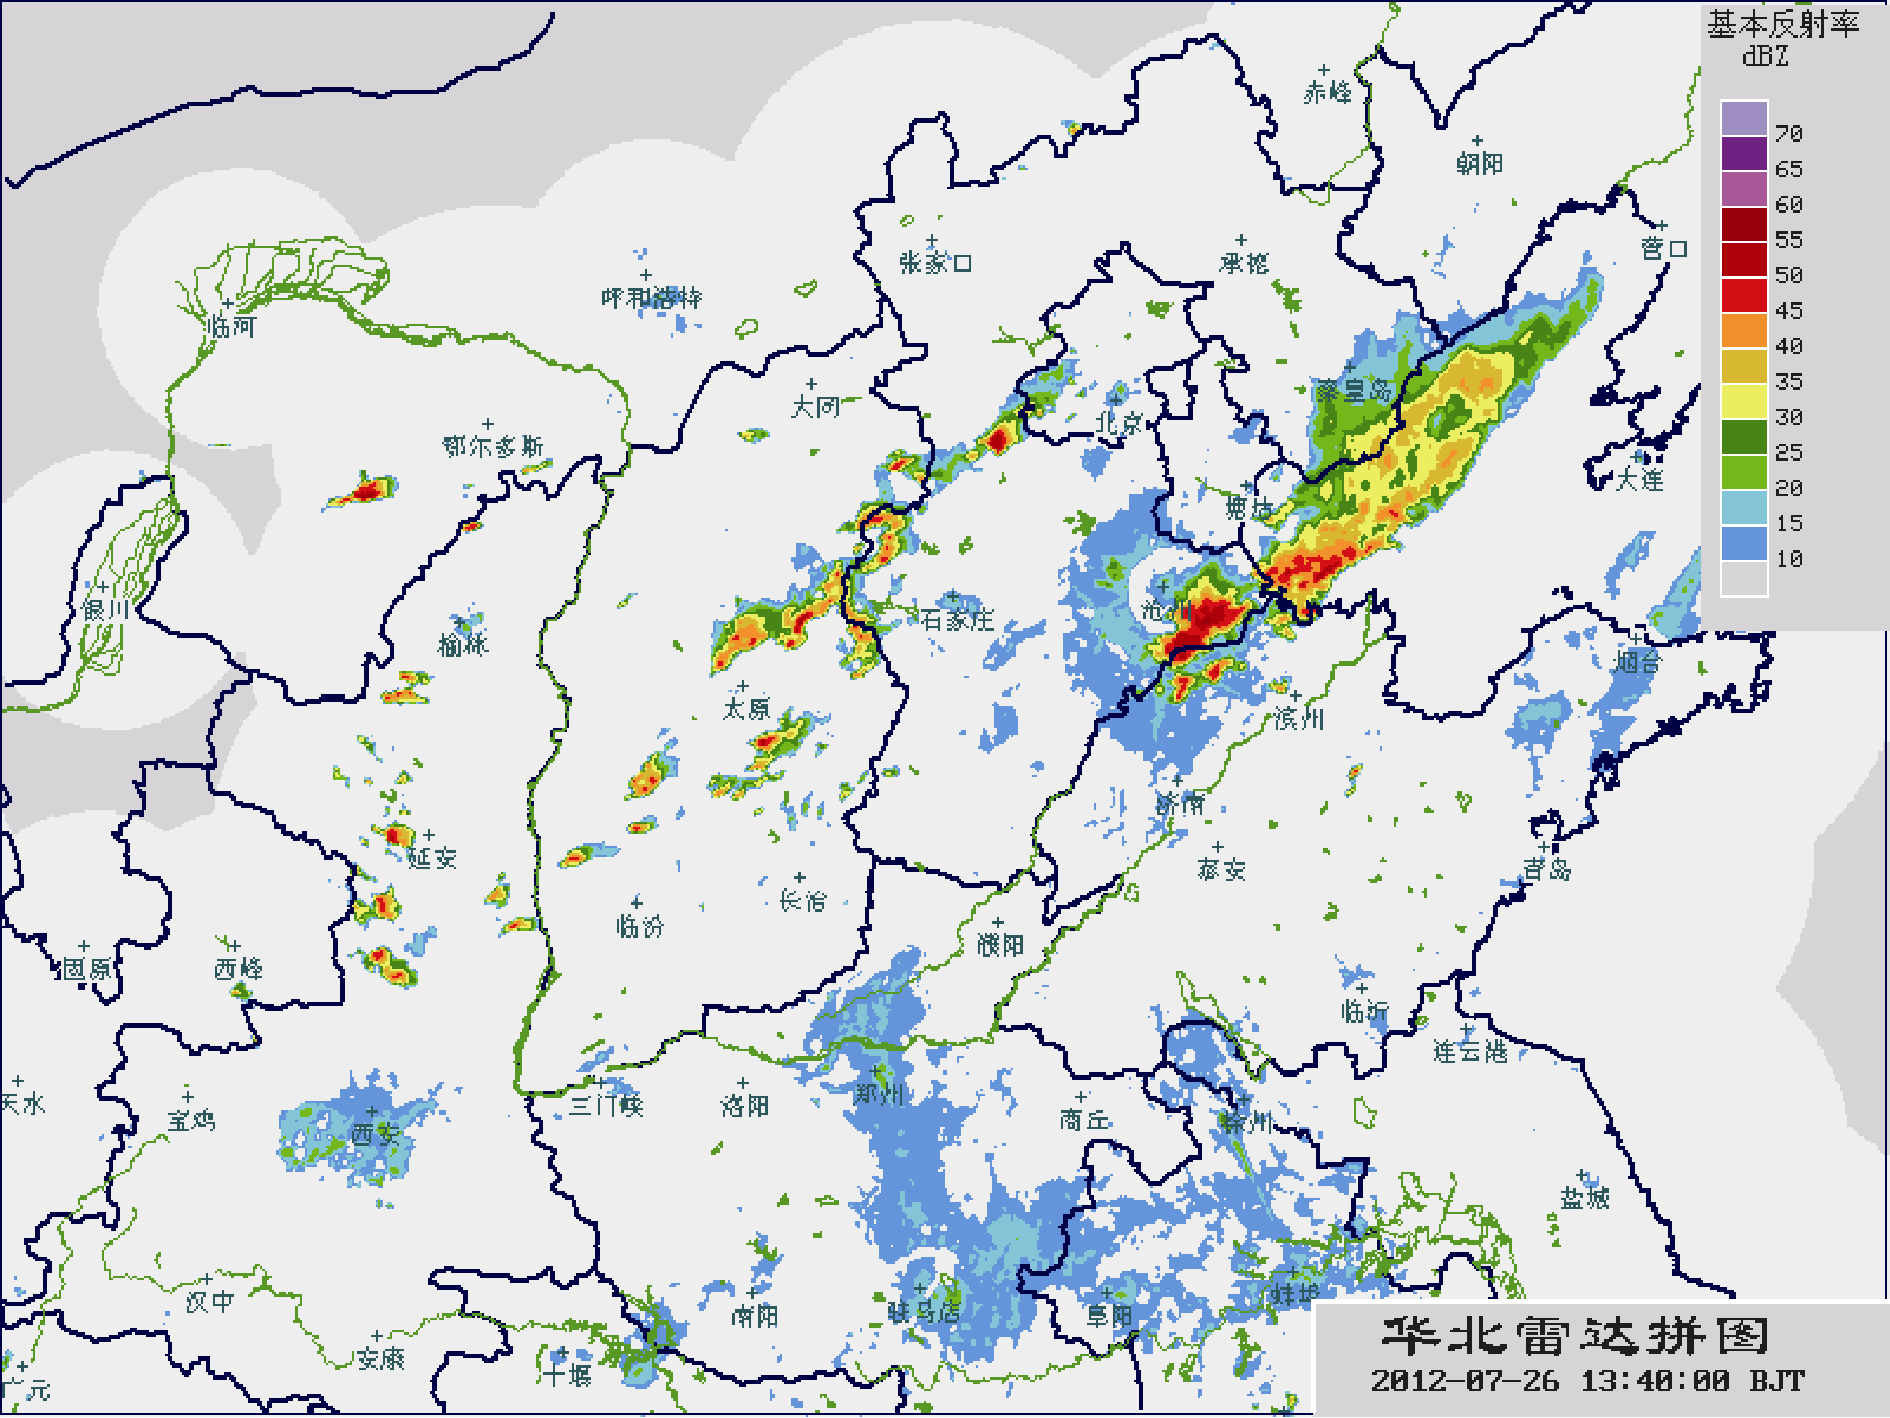 | Figure 8 Base reflectivity of radars (units: dBz) at North China at 13:40 BT 26 July 2012. |
For the first case, the following conclusions were drawn: (1) In the morning, cumuliform clouds over the middle region of Jiangsu Province were sparse, which indicates that the atmospheric stratification was unstable. Fog in the northern area resulted in uneven heating and caused horizontal atmosphere instability. (2) The deep convective cloud over Shandong Peninsula propagated southwest toward this unstable area, the outflow boundary of which created favorable conditions for initiation. (3) After 16:00 BT, an arc cloud line formed by the outflow boundary interacted with other clouds to form an MaCS.
For the second case, the following conclusions were drawn: (1) In the daytime, the heating of the low-level troposphere caused unstable stratification. Several inflow cloud lines present in Shandong Province and in eastern Henan Province indicate that a significant amount of low-level moist warm air was transported northward. (2) A squall line moved in from the west and interacted with the outflow boundary to form an MaCS.
A comparison of these two cases revealed similarities and differences. In both cases, a deep convective cloud had already formed at the rear of a cold front cloud band, and the deep convective cloud propagated backward in the morning. The deep convective clouds had arc lines formed by their outflow boundaries, which interacted with other deep convective clouds moving in from the west to form MaCSs. Both cases showed similarity to MCCs; however, duration times were short. In contrast, movement in the deep convective clouds from west formed a squall line that was stronger than the first case in the second case. In addition, the MaCS of the second case was larger than that in the first case and produced a larger amount of rainfall.
| 1 |
|
| 2 |
|
| 3 |
|
| 4 |
|
| 5 |
|
| 6 |
|
| 7 |
|