Detecting Changes in Precipitation and Temperature Extremes over China Using a Regional Climate Model with Water Table Dynamics Considered
[QIN Pei-Hua1 , XIE Zheng-Hui1  , WANG Ai-Wen
1, 2 ]
, WANG Ai-Wen|
|


Simulations were conducted with the regional climate model RegCM incorporating water table dynamics from 1 September 1982 to 28 August 2002 to detect precipitation and temperature extremes. Compared with observed r10 (number of days with precipitation ≥10 mm d-1), RegCM3_Hydro (the regional climate model with water table dynamics considered) simulated rain belts, including those in southern China and the middle and lower reaches of the Yangtze River, and provided data for arid to semi-arid areas such as the Heihe River Basin in northwestern China. RegCM3_Hydro indicated a significant increasing trend of r95p (days with daily precipitation greater than the 95th percentile of daily amounts) for the Yangtze, Yellow, and Pearl River basins, consistent with r95p observations. The Haihe River Basin was also chosen as a specific case to detect the effect of groundwater on extreme precipitation using peaks over threshold (POT)-based generalized Pareto distribution (GPD) with parameters estimated by the L-moment method. Quantile plots showed that all but a few of the plotted points were distributed near diagonal lines and the modeled data fitted well with the samples. Finally, the effects of water table dynamics on temperature extremes were also evaluated. In the Yellow River Basin and Songhuajiang River Basin, the trends of the number of warm days (TX95n) from RegCM3_Hydro matched observed values more closely when water table dynamics were considered, and clearly increasing numbers of warm days from 1983 to 2001 were detected.
Extreme climate events have received increasing attention in recent years due to an increased frequency and intensity of temperature and precipitation extremes and their potential effects on society, human health, the economy, and natural ecology ( Zhai et al., 2005; Fowler and Wilby, 2010; Liu et al., 2012).
Many studies have focused on analyzing the present climate (such as rainfall patterns) over China under global warming using regional climate models ( Zhang et al., 2008; Shi et al., 2009). However, in addition, climate models have also been used to simulate changes in extreme events over China. For example, Gao et al. (2002) detected changes of extremes due to greenhouse effects and analyzed significant changes in those extremes. Zhai et al. (2005) analyzed the trends in total precipitation and the frequency of precipitation extremes and showed there to be little trend in total precipitation. Liu et al. (2012) reasonably simulated extreme precipitation over east China using the LASG/IAP (National Key Laboratory of Numerical Modeling for Atmospheric Sciences and Geophysical Fluid Dynamics/Institute of Atmospheric Physics) regional climate model. Meanwhile, Xu et al. (2012) and Gu et al. (2012) showed possible changes in future extreme events over China, also based on a regional climate model.
An important part of the hydrological cycle is the groundwater that controls the lower boundary of soil water and influences extreme climate, mainly through its effect on soil moisture and evapotranspiration ( Miguez- Macho and Fan, 2012a, b). Several recent hydrological studies have focused on groundwater and surface water systems ( Sophocleous and Perkins, 2000; Niu et al., 2007; Xie and Yuan, 2010), static and dynamic water table representation in land surface models ( Liang and Xie, 2001; Liang et al., 2003), and climate models ( Yuan et al., 2008; Qin et al., 2013). A groundwater model with water table dynamics and surface/subsurface runoff mechanisms was incorporated into a regional climate model and the effect of groundwater on regional climate was then investigated for river basins in China ( Qin et al., 2013). The results showed that this combined regional climate model reduced the positive biases of annual and summer (June- July-August; JJA) precipitation over most river basins in China.
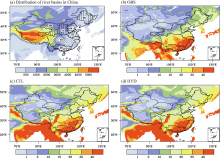
In the present study, the effects of combining groundwater with water table dynamics and surface/subsurface runoff on precipitation extremes were investigated by examining the spatial distribution and interannual variation of precipitation indices for seven river basins (Fig. 1a) in China: the Haihe River (HA) Basin, Heihe River (HE) Basin, Huaihe River (HU) Basin, Pearl River (PE) Basin, Songhuajiang River (SH) Basin, Yellow River (YL) Basin, and Yangtze River (YZ) Basin. The HA Basin is a special case: it is the largest water system in northern China, and the rainy season is concentrated within a very short period. We used the generalized Pareto distribution (GPD), which was introduced into hydrometeorological studies by Pickands (1975) and then further developed by Hosking and Wallis (1987). The GPD statistic estimates the probability that a random variable will exceed a high value, given that it already exceeds a threshold level instead of simply the maximum (or minimum) value of the data. The extreme precipitation events were simulated by the peaks over threshold (POT)-based GPD with parameters estimated by the L-moment method.
 | Figure 1 (a) Distribution of seven river basins in China and (b-d) annual mean number of days with daily precipitation ≥ 10 mm d-1 (r10) from 1 September 1982 to 28 August 2002. |
The remainder of the paper is structured as follows. The following section (section 2) describes the datasets and methodology used to detect the climatic extremes. Section 3 presents the key results for precipitation and temperature extremes. Finally, a summary of the key findings is provided in section 4.
Yuan et al. (2008) and Qin et al. (2013) developed the regional climate model RegCM3_Hydro (hereafter referred to as HYD) by incorporating a groundwater component with water table dynamics ( Liang et al., 2003) and new surface/subsurface runoff schemes ( Liang and Xie, 2001; Niu et al., 2005) into the third-generation regional climate model RegCM3 (the control model, hereafter re- ferred to as CTL). Qin et al. (2013) detected the effects of these components on regional climate through a 45-yr integration ( from 1 September 1957 to 31 August 2002) over East Asia with a horizontal resolution of 60 km and time steps of 200 s for atmospheric processes, and 1800 s for land surface integration. The European Centre for Medium-Range Weather Forecasts (ECMWF) 40-year Reanalysis datasets (ERA-40) were used as the initial and boundary conditions and Global Sea Ice and Sea Surface Temperature (GISST) gridded data were chosen as oceanic surface forcing. Comparing the results with those of a control run, HYD reduced the positive systematic biases of simulated precipitation in most river basins in China (Table 1). In the present study, the daily precipitation amounts simulated by HYD were chosen for the period from 1 September 1982 to 28 August 2002, while the simulation results of the first 25 years ( from 1 September 1957 to 31 August 1982) were used as spin-up for groundwater.
| Table 1 Daily mean precipitation (OBS, CTL, HYD) in seven river basins in China. |
Several indicators for monitoring extremes ( Frich et al., 2002) were adopted in this study to detect the precipitation and temperature extremes: (1) The number of days when precipitation was greater than or equal to 10 mm (r10).
(2) The number of days when precipitation was greater than the 95th percentile of daily amounts (“very wet days”, r95p).
(3) The annual maximum of consecutive five-day precipitation (r5d).
(4) The number of days when the temperature exceeded the 95th percentile (“warm days,” TX95n).
Extreme precipitation events were also simulated by GPD. The choice of threshold is critical when performing a POT-based GPD analysis. Too high a threshold leads to a large variance of the estimate because only some of the data are used; too low a threshold results in bias because of the high threshold needed for an asymptotic result. The L-moment estimation method ( Hosking, 1990) was used to estimate the distribution parameters because of its ease of computation, low sensitivity to the choice of threshold, and good performance in return level estimation for a small sample size ( Mackay et al., 2011).
Figures 1b-d show the spatial distribution of the annual mean number of days from 1 January 1983 to 31 December 2001 with daily precipitation ≥ 10 mm (r10), which matches the spatial pattern of the annual mean precipitation. Because of the positive biases of precipitation simulated by CTL and HYD in the SH Basin where there are large areas of frozen soil in winter, HYD simulated the occurrence of r10 on five days more than were observed. Compared to the observed r10, HYD also correctly simulated the rain belts in southern China, over the middle and lower reaches of the Yangtze River, and in the arid to semi-arid areas in northwestern China (particularly the HE Basin).
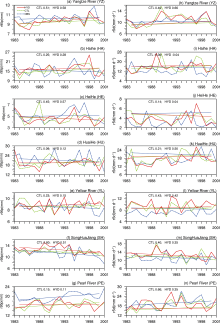
Figures 2a-g show the time series for daily precipitation amounts greater than the 95th percentile for all wet days (daily precipitation ≥ 0.1 mm), and r95p (mm) for seven river basins in China, together with their trends, including the significantly increasing trends for the YZ, YL, and PE basins (with correlation coefficients of 0.58, 0.15, and 0.11, respectively for the HYD run), and a decreasing trend for the SH Basin (with a correlation coefficient of 0.51 for the HYD run), all of which were consistent with the observed r95p values.
 | Figure 2 Time series for (a-g) daily precipitation amounts greater than the 95th percentile of all wet days (mm, r95p) and (h-n) maximum consecutive five-day precipitation total (mm d-1, r5d) of seven river basins of China and the trends. Red solid line: precipitation from HYD run; green dashed line: precipitation from CTL run; blue dashed line: observed precipitation. The correlation coefficients for the CTL run and HYD run compared with the observed values are also shown. |
Flooding usually results from continuous heavy rain alling in a short time. Figures 2h-n show the time series of annual maximum consecutive five-day precipitation (r5d). It shows a negative trend in the observed precipitation in the HU Basin, while no obvious trends were found in the simulations (the correlation coefficient is 0.50 for the HYD run), and a negative trend in the SH Basin with a correlation coefficient of 0.35 for the HYD run, but no obvious trend in the other basins. It should be mentioned that in the HA Basin the correlation coefficients are negative for both the CTL and HYD runs. This is probably due to the overexploitation of groundwater in the HA Basin, but there being no corresponding description in the model, which causes an increased simulated continuous precipitation over several days.
We also chose the specific case of the HA Basin—the largest water system in northern China, with a very short wet season—to detect the effect of groundwater on precipitation extremes using the technique of extreme-value distribution fitting with GPD.
The mean residual life plot was used to select the threshold. This method is based on a particular GPD property: if a sample can be fitted by GPD with threshold u0 and shape parameter k, then the excesses of any threshold u > u0 will also fit a GPD with the same shape parameter and a scale parameter linearly dependent on a threshold u ( Coles, 2001). Thus, for u > u0, E( X- u| X> u) =
The threshold of GPD was set at u0 = 10, since above this threshold u0 estimates of the shape parameter k were approximately constant, while estimates of scale parameter α were linear in u (the figure of GPD fits for a range of thresholds for daily precipitation over the HE Basin is not shown here), which suggests that a threshold u0 = 10 was appropriate; 369 values exceeded that threshold. L-moment methods were then used to estimate their parameters during GPD fits. The scale parameter and shape parameter were then calculated to be α = 5.989 and k = 0.102.
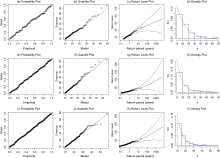
Figure 3 shows diagnostic plots (probability plot,quantile plot, return level plot, and density plot) from fitting the simulated and observed daily precipitation to the GPD for the period from 1 September 1982 to 28 August 2002 (CTL run and HYD run) over the HE Basin. The quantile plots show that all but a few of the plotted points were distributed close to the diagonal; taking into account the randomness of the samples and the reproducibility levels within the 95% confidence level, the simulated values agreed well with the observations.
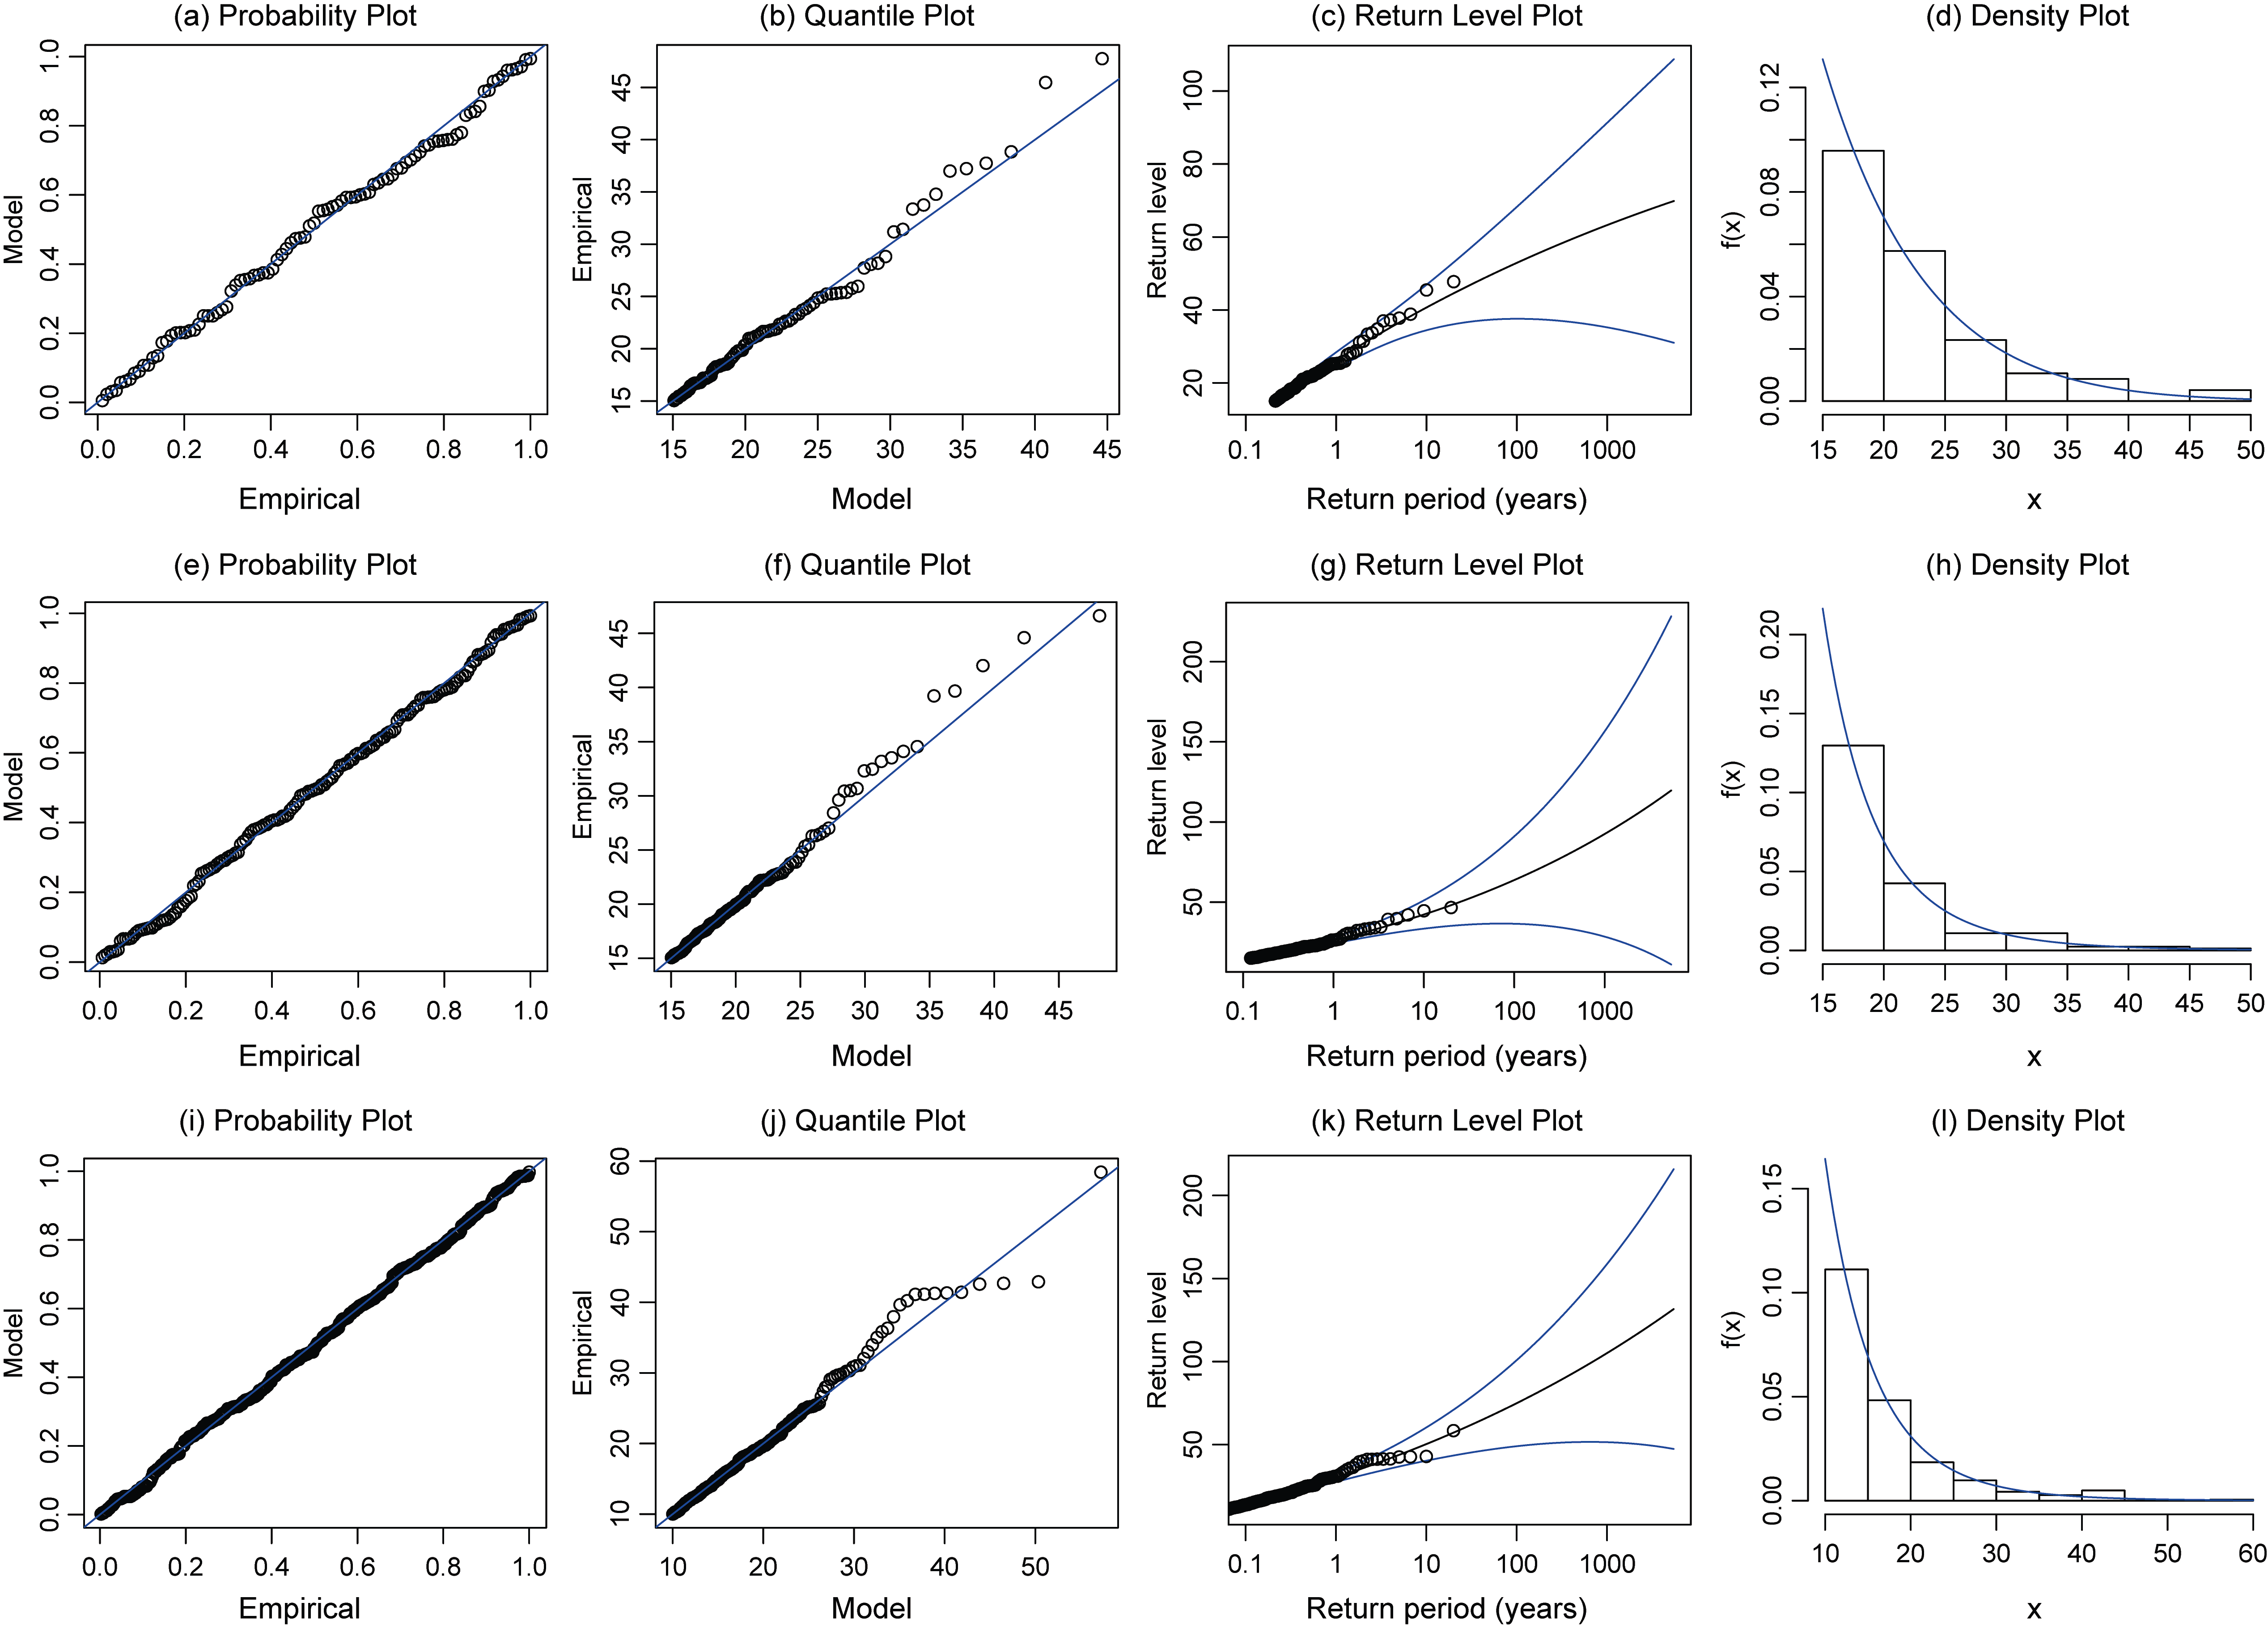 | Figure 3 (a-d) Diagnostic plots from fitting observed daily precipitation, (e-h) daily precipitation from the CTL run, and (i-l) HYD run to the GP distribution in the Haihe River Basin ( from 1 September 1982 to 28 August 2002). |
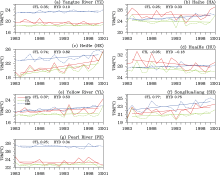
Figure 4 shows the number of days when the temperature exceeded the 95th percentile (TX95n). In the YL and SH basins, the trends of TX95n simulated by HYD were more consistent with the observations when water table dynamics were included. Obvious trends of increasing numbers of warm days were detected in those basins from 1983 to 2001. In the high-rainfall PE Basin, no significant increasing or decreasing trend in TX95n was detected, either from observations or simulations (including both the CTL run and the HYD run). Furthermore, owing to large systematic biases in temperature simulated by RegCM in the YZ and PE basins ( Qin et al., 2013), significant cold biases of TX95n by both simulations were found compared with the observations.
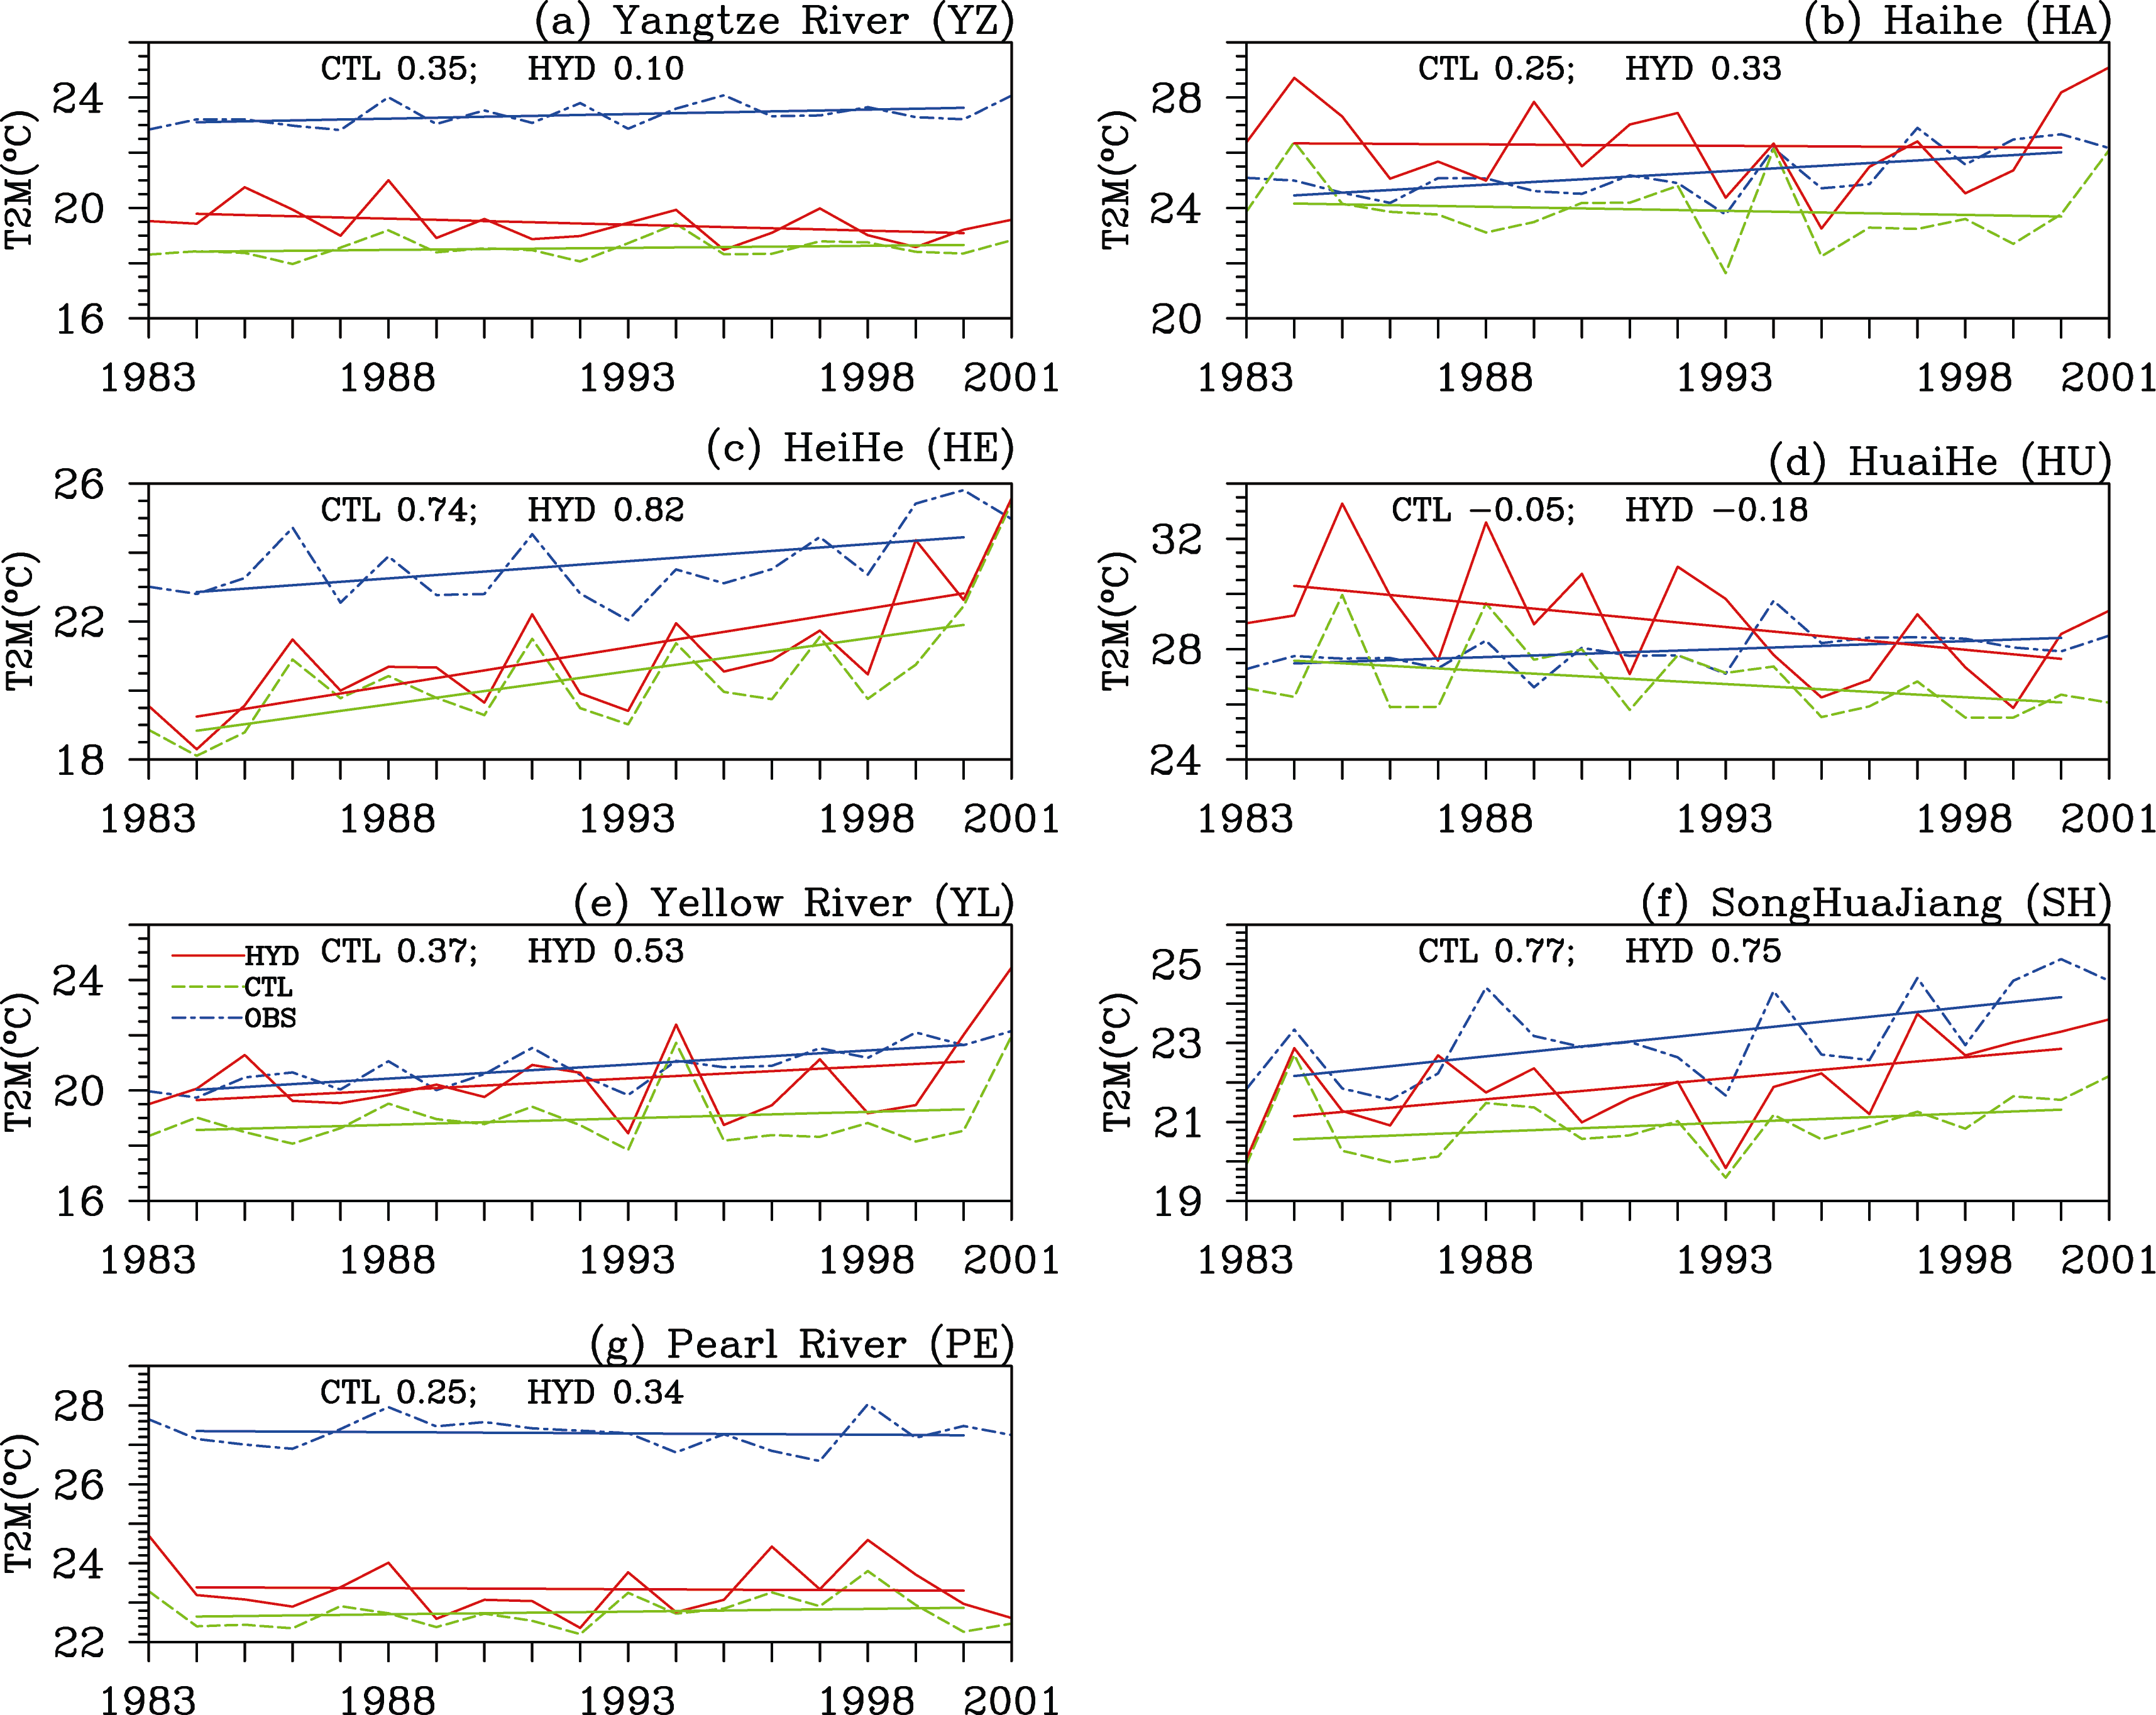 | Figure 4 Time series for daily temperatures at 2 m (T2M) above the 95th percentile (TX95n, °C) of seven river basins in China. Associated trends are shown as: red solid line—T2M from the HYD run; green dashed line—T2M from CTL run; blue dashed line—observed T2M. The correlation coefficients for the CTL run and HYD run compared with the observed values are also shown. |
Daily precipitation data simulated by the HYD model for the period from 1 September 1982 to 28 August 2002 were used to predict extremes of precipitation and temperature.
In HYD, a groundwater model and surface/subsurface runoff mechanisms were considered that improved the simulation performance for precipitation and temperature through affecting the land surface water and energy variables, such as soil moisture, runoff, sensible and latent heat fluxes, evapotranspiration, etc. ( Qin et al., 2013). All of these would also change the performance in simulated precipitation and temperature extremes. The model predicted that daily precipitation would equal or exceed r10 on five days more than were observed. Compared with observed r10, HYD also predicted the existence of the rain belts in southern China and in the middle and lower reaches of the Yangtze River. The model also indicated significant increasing trends of R95p in the YZ, YL, and PE basins, and decreasing trends of R95p in the SH Basin. All predictions were consistent with observations. The HA Basin was selected as a special case to detect the effect of groundwater on precipitation extremes. Finally, the impacts of water table dynamics on temperature extremes were also analysed. In the YL and SH Basins, when the water table dynamics were considered, the trends of the number of warm days (TX95n) from HYD matched those from observations, and obvious increasing trends of warm days were also detected from 1983 to 2001.
| 1 |
|
| 2 |
|
| 3 |
|
| 4 |
|
| 5 |
|
| 6 |
|
| 7 |
|
| 8 |
|
| 9 |
|
| 10 |
|
| 11 |
|
| 12 |
|
| 13 |
|
| 14 |
|
| 15 |
|
| 16 |
|
| 17 |
|
| 18 |
|
| 19 |
|
| 20 |
|
| 21 |
|
| 22 |
|
| 23 |
|
| 24 |
|