

Can Current AGCMs Reproduce Historical Changes in the Atmospheric Diabatic Heating over the Tibetan Plateau?
[DUAN An-Min1, 3  , XIAO Zhi-Xiang
1, 2 , HU Jun1, 2 ]
, XIAO Zhi-Xiang|
|


Recent studies have demonstrated a persistent decreasing trend in the spring sensible heat (SH) source over the Tibetan Plateau (TP) during the past three decades. By comparing simulations from nine state-of-the-art atmospheric general circulation models (AGCMs) driven by historical forcing fields with both observational data and five reanalysis datasets, the authors found that the AGCMs are unable to reproduce the change in the SH flux over the TP. This deficiency arises because the observed decreasing trend in SH flux depends primarily on the change in surface wind speed according to the bulk formula, whereas in the models it is also influenced largely by changes in the land-air temperature difference related to the systematic cold bias. In addition, an obvious discrepancy exists in other aspects of the diabatic heating simulated by the models, suggesting that a significant improvement is required in the physical schemes associated with land surface processes and diabatic heating over the complicated topography.
The mechanical and thermal forcing effects of the Tibetan Plateau (TP) are important factors in the formation and evolution of hemispheric circulation and climate ( Yeh et al., 1957; Hahn and Manabe, 1975; Luo and Yanai, 1983; Li and Yanai, 1996; Duan and Wu, 2005; Wu et al., 2012). Prior to the rainy season, a strong sensible heat (SH) flux dominates the total diabatic heating over the TP and regulates both the timing of the establishment of the tropical Asian summer monsoon ( Wu et al., 1997; Wu and Zhang, 1998) and the interannual variation of the East Asian summer monsoon (EASM) ( Duan and Wu, 2005; Zhao and Chen, 2001).
In parallel with the warming climate, the atmospheric heat source, especially the spring SH flux over the TP, has shown a clear weakening trend during the past three decades ( Zhu et al., 2007; Yang et al., 2011). This weakening trend in the spring SH flux over the TP is directly related to the persistent decelerated surface wind, which can be considered as a regional response to the relatively larger amplitude of warming over northern parts of Eurasia and smaller amplitude of warming over southern parts of Eurasia, its spatially non-uniform warming effect, and the resultant decelerated subtropical westerly jet ( Duan and Wu, 2009). Moreover, the suppressed TP atmospheric diabatic heating has been further linked to the decadal abating of the EASM, and the resultant southward retreat of the monsoon rainfall belt in China ( Liu et al., 2012; Duan et al., 2013).
It is unfortunate that in the third phase of the Coupled Model Intercomparison Project (CMIP3), only a few air- sea coupled general circulation models (AOGCMs) could reproduce the decelerated westerly jet ( Duan and Wu, 2009), suggesting a generally low ability of AOGCMs in simulating regional climate change. After some years of further development, it is now thought that the ability of these models has been improved in certain respects, and that the forcing fields in the historical experiments in the fifth phase on CMIP (CMIP5) are now more reliable ( Taylor et al., 2012). In particular, the sea surface temperature (SST) bias in AOGCMs may be partially responsible for the bias in the regional warming pattern. This raises the question: can we expect state-of-the-art atmospheric general circulation models (AGCMs) driven by historical SST and other forcing fields to reproduce the observed declining spring SH flux and the total atmospheric diabatic heating over the TP? In this study, we address this issue by comparing simulations from nine current AGCMs with station-based observational data and five reanalysis datasets.
There are few directly observed long-term and large- scale SH datasets available globally, and particularly for the TP due to the complex terrain and extreme environment there. Routine monitoring stations are distributed mainly in the central and eastern TP (CETP), whereas only a few are located in the western TP. The data used here include the regular surface meteorological observations from 71 stations over the CETP supplied by the China Meteorological Administration (CMA). Observations were made four times each day from 1980 to 2005 and included surface skin temperature ( Ts), surface air temperature ( Ta), and 10-m wind speed ( V). The daily mean Ta, Ts, V, and SH flux fields during the same period were also obtained from five reanalysis products: National Centers for Environmental Prediction and National Center for Atmospheric Research (NCEP/NCAR) ( Kalnay et al., 1996), NCEP-Department of Energy(NCEP/DOE) ( Kanamitsu et al., 2002), Japanese 25-year Reanalysis(JRA-25) ( Kazutoshi et al., 2007), Interim European Centre for Medium Range Weather Forecasts Reanalysis (ERA-Interim) ( Dee et al., 2011), and Modern Era Retrospective-Analysis for Research and Applications(MERRA) ( Rienecker et al., 2011), which have global horizontal resolutions of 2.5°×2.5°, 1.875°×1.88°, 1.125°×1.12°, 1.5°×1.5°, and 

The SH flux at the 71 stations was calculated using the bulk aerodynamic method:
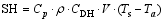 | , (1) |
where Cp= 1005 J kg-1 K-1 is the specific heat of dry air at constant pressure, ρis the air density that decreases exponentially with increasing elevation, CDH is the drag coefficient for heat, see Duan and Wu (2008) for more details.
Simulations in the nine AGCMs were based on the integrations from CMIP5 produced for the Intergovernmental Panel on Climate Change Fifth Assessment Report (IPCC AR5). The horizontal grids of the AGCMs varied from 360×576 (0.5°×0.625°) in Geophysical Fluid Dynamics Labolatory global High Resolution Atmospheric model (GFDL-HIRAM-C180) to 64×128 (2.8°×2.8125°) in Beijing Normal University-Earth System Model(BNU- ESM) and Canadian Atmospheric Global Climate Model (CanAM4). The forcing factors used were combinations of greenhouse gases, sea ice, volcanic aerosols, ozone, historical SST, black carbon, sulfate aerosols, and solar variability derived from the dataset for the period 1850- 2005. As most of the simulation results end in 2005, and the most significant trend over the TP was observed after the 1970s, including the SH and V ( Duan and Wu, 2008), the period 1980-2005 was used for comparisons among the models and also with observations.
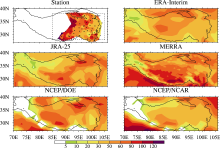
The spring mean SH flux over the CETP from 1980 to 2005 from the 71 stations, calculated using Eq. (1), and that archived in the five reanalysis datasets are shown in Fig. 1. Consistent with previous findings ( Yeh and Gao, 1979; Zhao and Chen, 2001; Duan and Wu, 2008), in spring, a strong SH flux dominates the western and central TP (about 120 W m-2) and gradually diminishes eastward (to about 50 W m-2 around the eastern corner). Over the TP, the SH varies greatly from the central plateau to the eastern TP because of the unique underlying surface characteristics and complex orography. The basic pattern of the spring SH flux over the TP is also reflected in the JRA-25, ERA-Interim, MERRA, and NCEP/DOE reanalysis data, although there is a significant discrepancy in the magnitude. However, the NCEP/NCAR data do not show an SH center at around 90°E.
 | Figure 1 Spatial distribution of spring mean (March-May) sensible heat (SH) flux over the Tibetan Plateau (TP) for 1980-2005 (W m-2). The thick lines indicate the area of the TP with an average altitude higher than 3000 m. In the top left panel, the locations of the 71 meteorological stations are shown by the dots, while the dashed rectangle denotes the domain of the central and eastern TP (CETP) (28-38°N, 85-105°E). |
The ability of the AGCMs to simulate the climate mean state is a prerequisite if past climate change is to be reproduced and future climate trends projected. Figure 2 shows the spring mean SH, V, Ts - Ta, Ts, and Ta averaged over the 71 stations, and the results from the reanalysis data and AGCMs extended to cover the locations of these stations via bilinear interpolation. The average SH flux from the 71 stations is 62 W m-2. Apart from MERRA, which gives a value of 66 W m-2, the reanalysis data systematically underestimates the average SH flux, which varies from roughly 42 W m-2 for NCEP/NCAR to 58 W m-2 for JRA-25. The SH flux is also systematically underestimated by the AGCMs, with the CanAM4 generating the most realistic average value of 60 W m-2. The differences among the various data sources might be related to the significant altitude differences between the model grid cell and the corresponding stations.
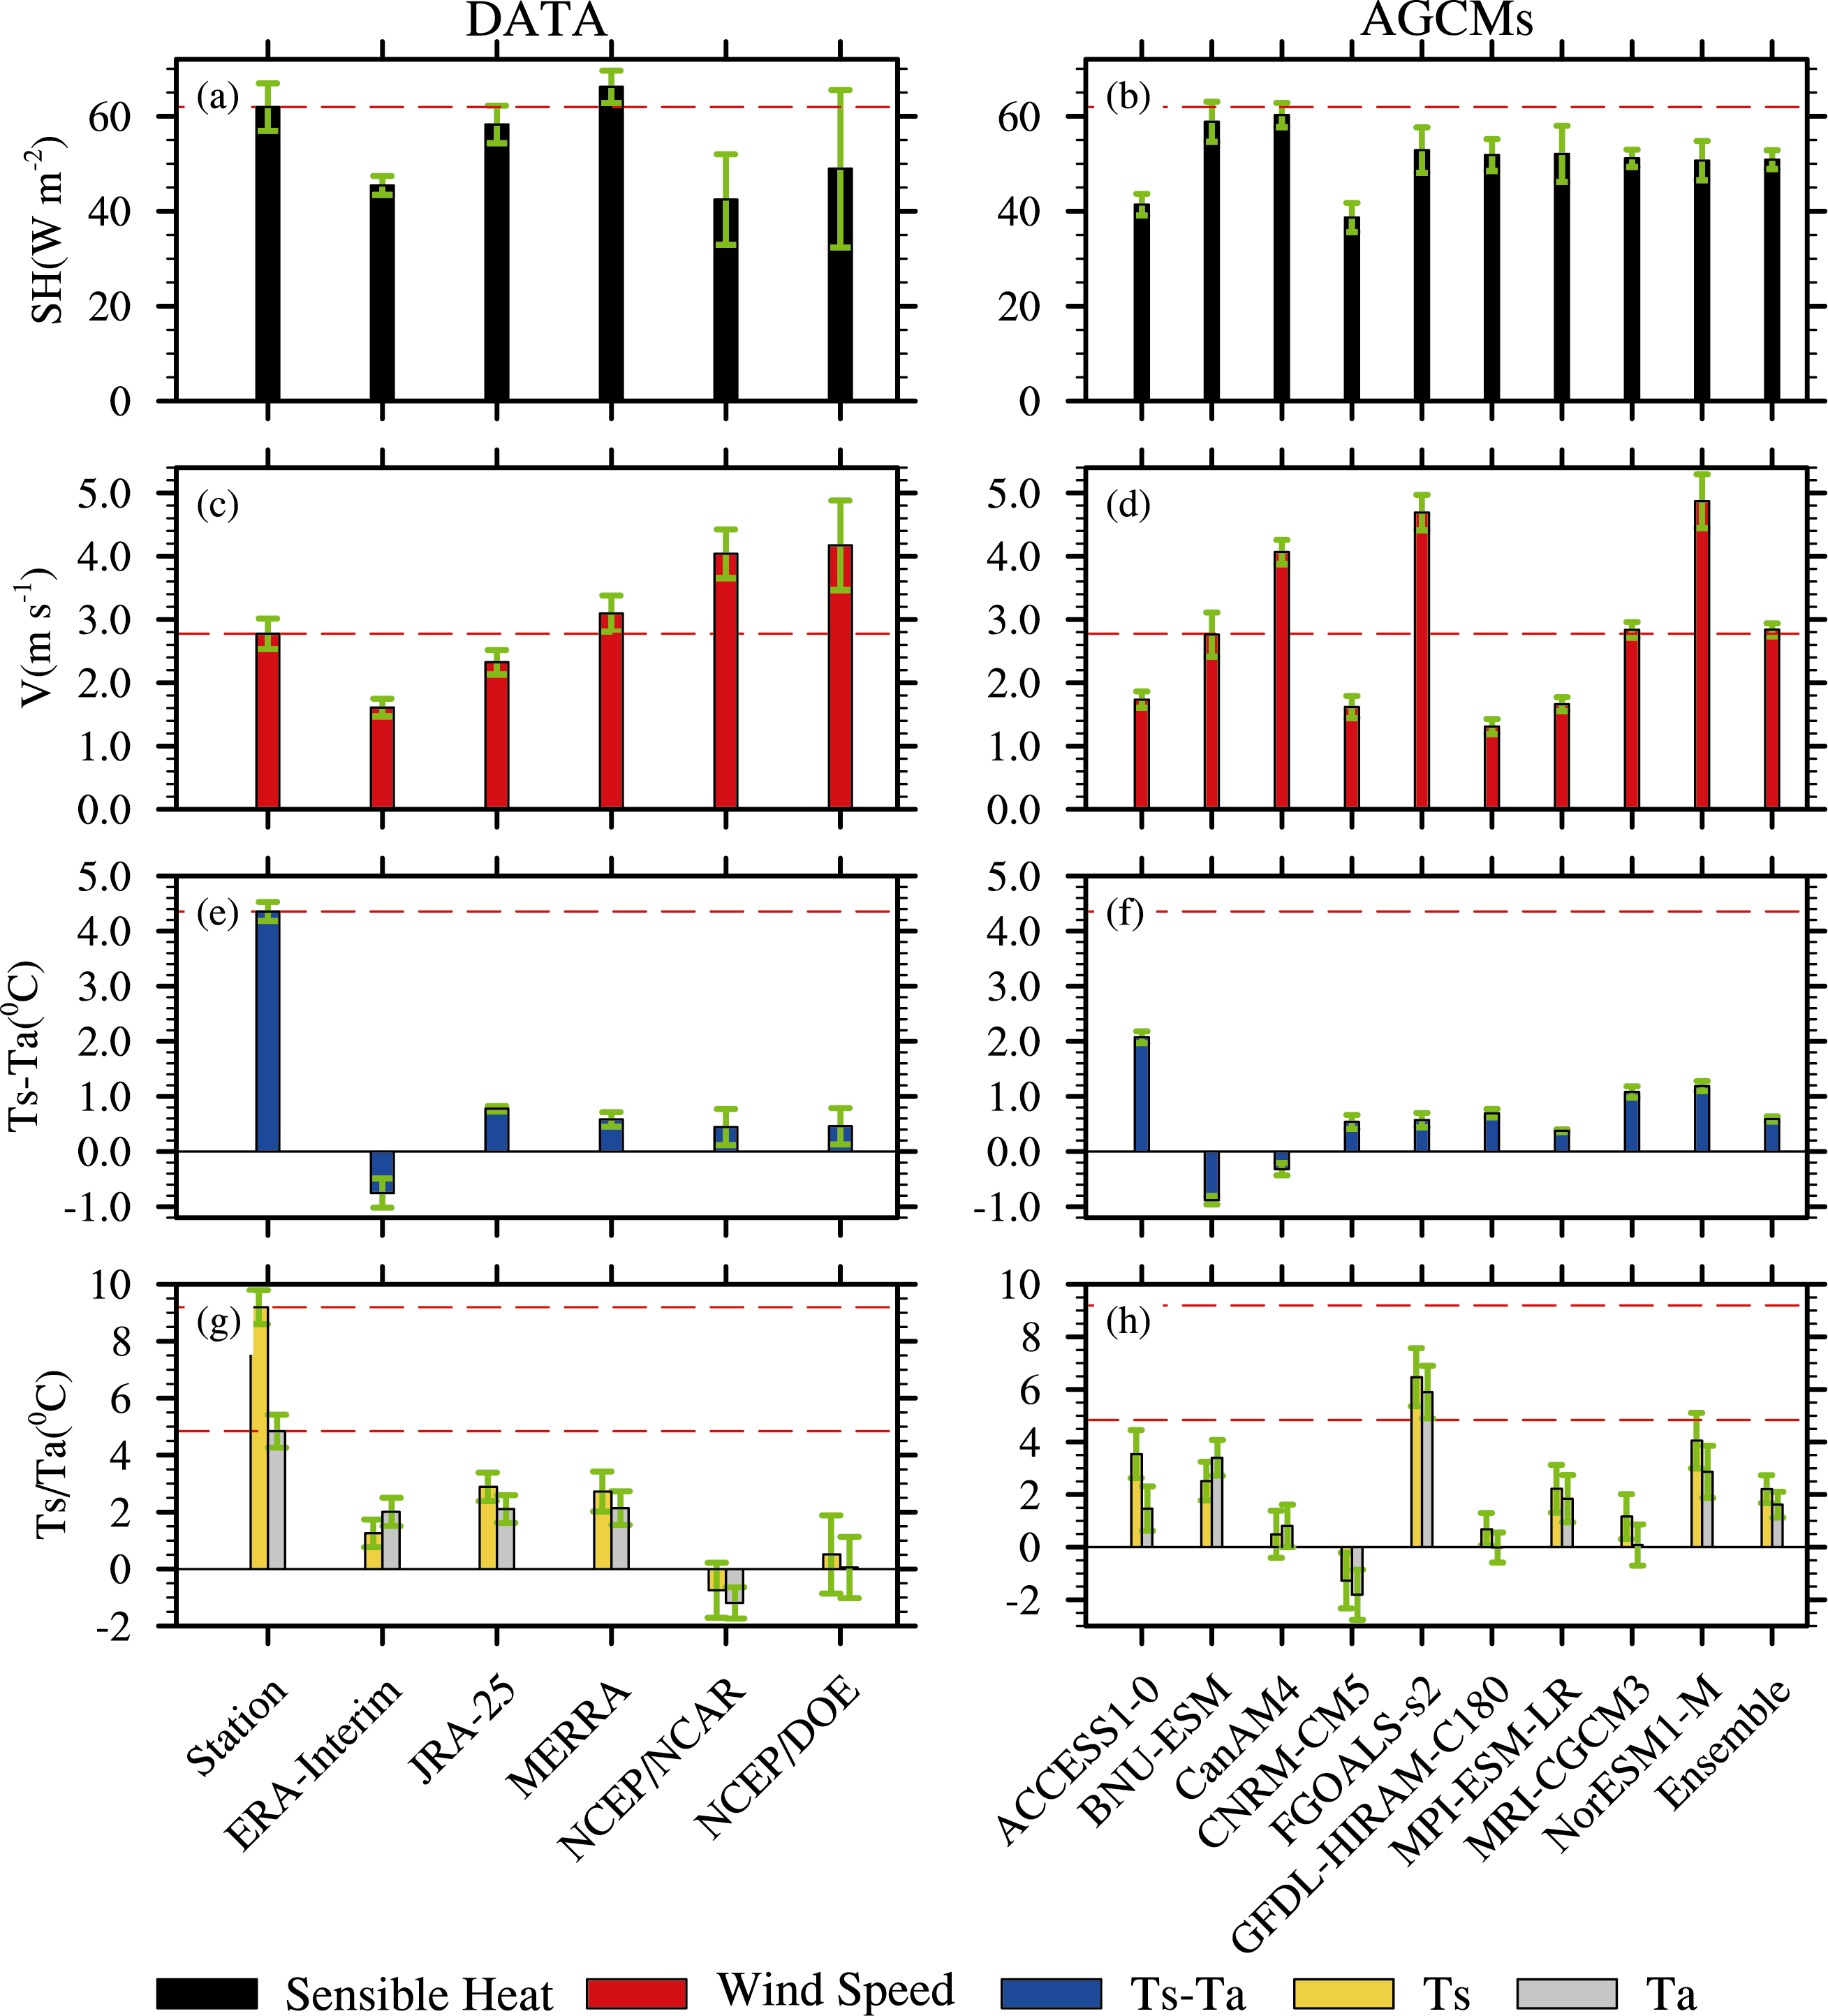 | Figure 2 Average for the 71 stations, and results from the five reanalysis datasets and nine AGCMs (interpolated onto the locations of 71 stations) for: (a) and (b) spring mean SH flux (W m-2), (c) and (d) 10-m wind speed V (m s-1), (e) and (f) Ts- Ta (°C), and (g) and (h) Ts and Ta (°C) for 1980- 2005. The red dashed lines denote the corresponding station values and the green bars denote the standard deviation. |
The details of the physical schemes governing the land surface processes vary among the different models, but the underestimated SH flux over the TP is directly related to the low value of Ts- Ta, because the magnitude of V in the five reanalysis datasets and most of the models is similar to or even larger than that in the observations. Low values of Ts- Ta might be related to the distinct surface cold bias in the reanalysis data and models. In fact, the 71-station-averaged spring mean Ts reaches 9.2°C, whereas that in the reanalysis data is less than 3.0°C and in the AGCMs is typically less than 4.0°C. This situation is also true for Ta, because the magnitude of Ta depends largely on Ts.
In the reanalysis data, the cold bias in the daily air temperature can be mainly ascribed to the higher surface altitude ( Frauenfeld et al., 2005; Wang and Zeng, 2012), while Yang et al. (2007) attributed the substantial surface cold bias over the TP in land models to the absence of diurnal variations in CDH. Zeng et al. (2012) suggested that revising the coefficients used to compute the roughness length for heat can markedly reduce the underestimation of daytime Ts, and that limiting the minimum friction velocity and soil thermal conductivity helps to make the nighttime Ts larger under light winds and dry soil situations in land models. Both identifying the cause of the surface cold bias and improving the land model in the AGCMs are beyond the scope of this paper, but the related bias in Ts- Ta does influence the trend in SH, as shown below.
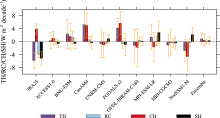
Figure 3 shows the trend and corresponding error bar for the averaged SH, V, and Ts- Ta based on the 71 observation stations, as well as the averaged results over the CETP derived from the reanalysis data and AGCMs from 1980 to 2005. A significant weakening trend in the SH flux appears in both the observations and all five reanalysis datasets. By comparing the trend in SH with that in V and Ts- Ta, we can conclude that the downward trend in SH based on station observations is induced primarily by the decline in V, because the trend in Ts- Ta shows an opposite (upward) trend. Liu et al. (2012) discussed the relative contribution of changes in V and Ts- Ta to the down- ward trend in SH over the TP, and their results indicated that the relative change in Ts- Ta is about one-tenth of the change in V over decadal timescales, because the climate mean value of Ts- Ta over the TP is much larger than the surrounding plain regions, and its relative change is small.
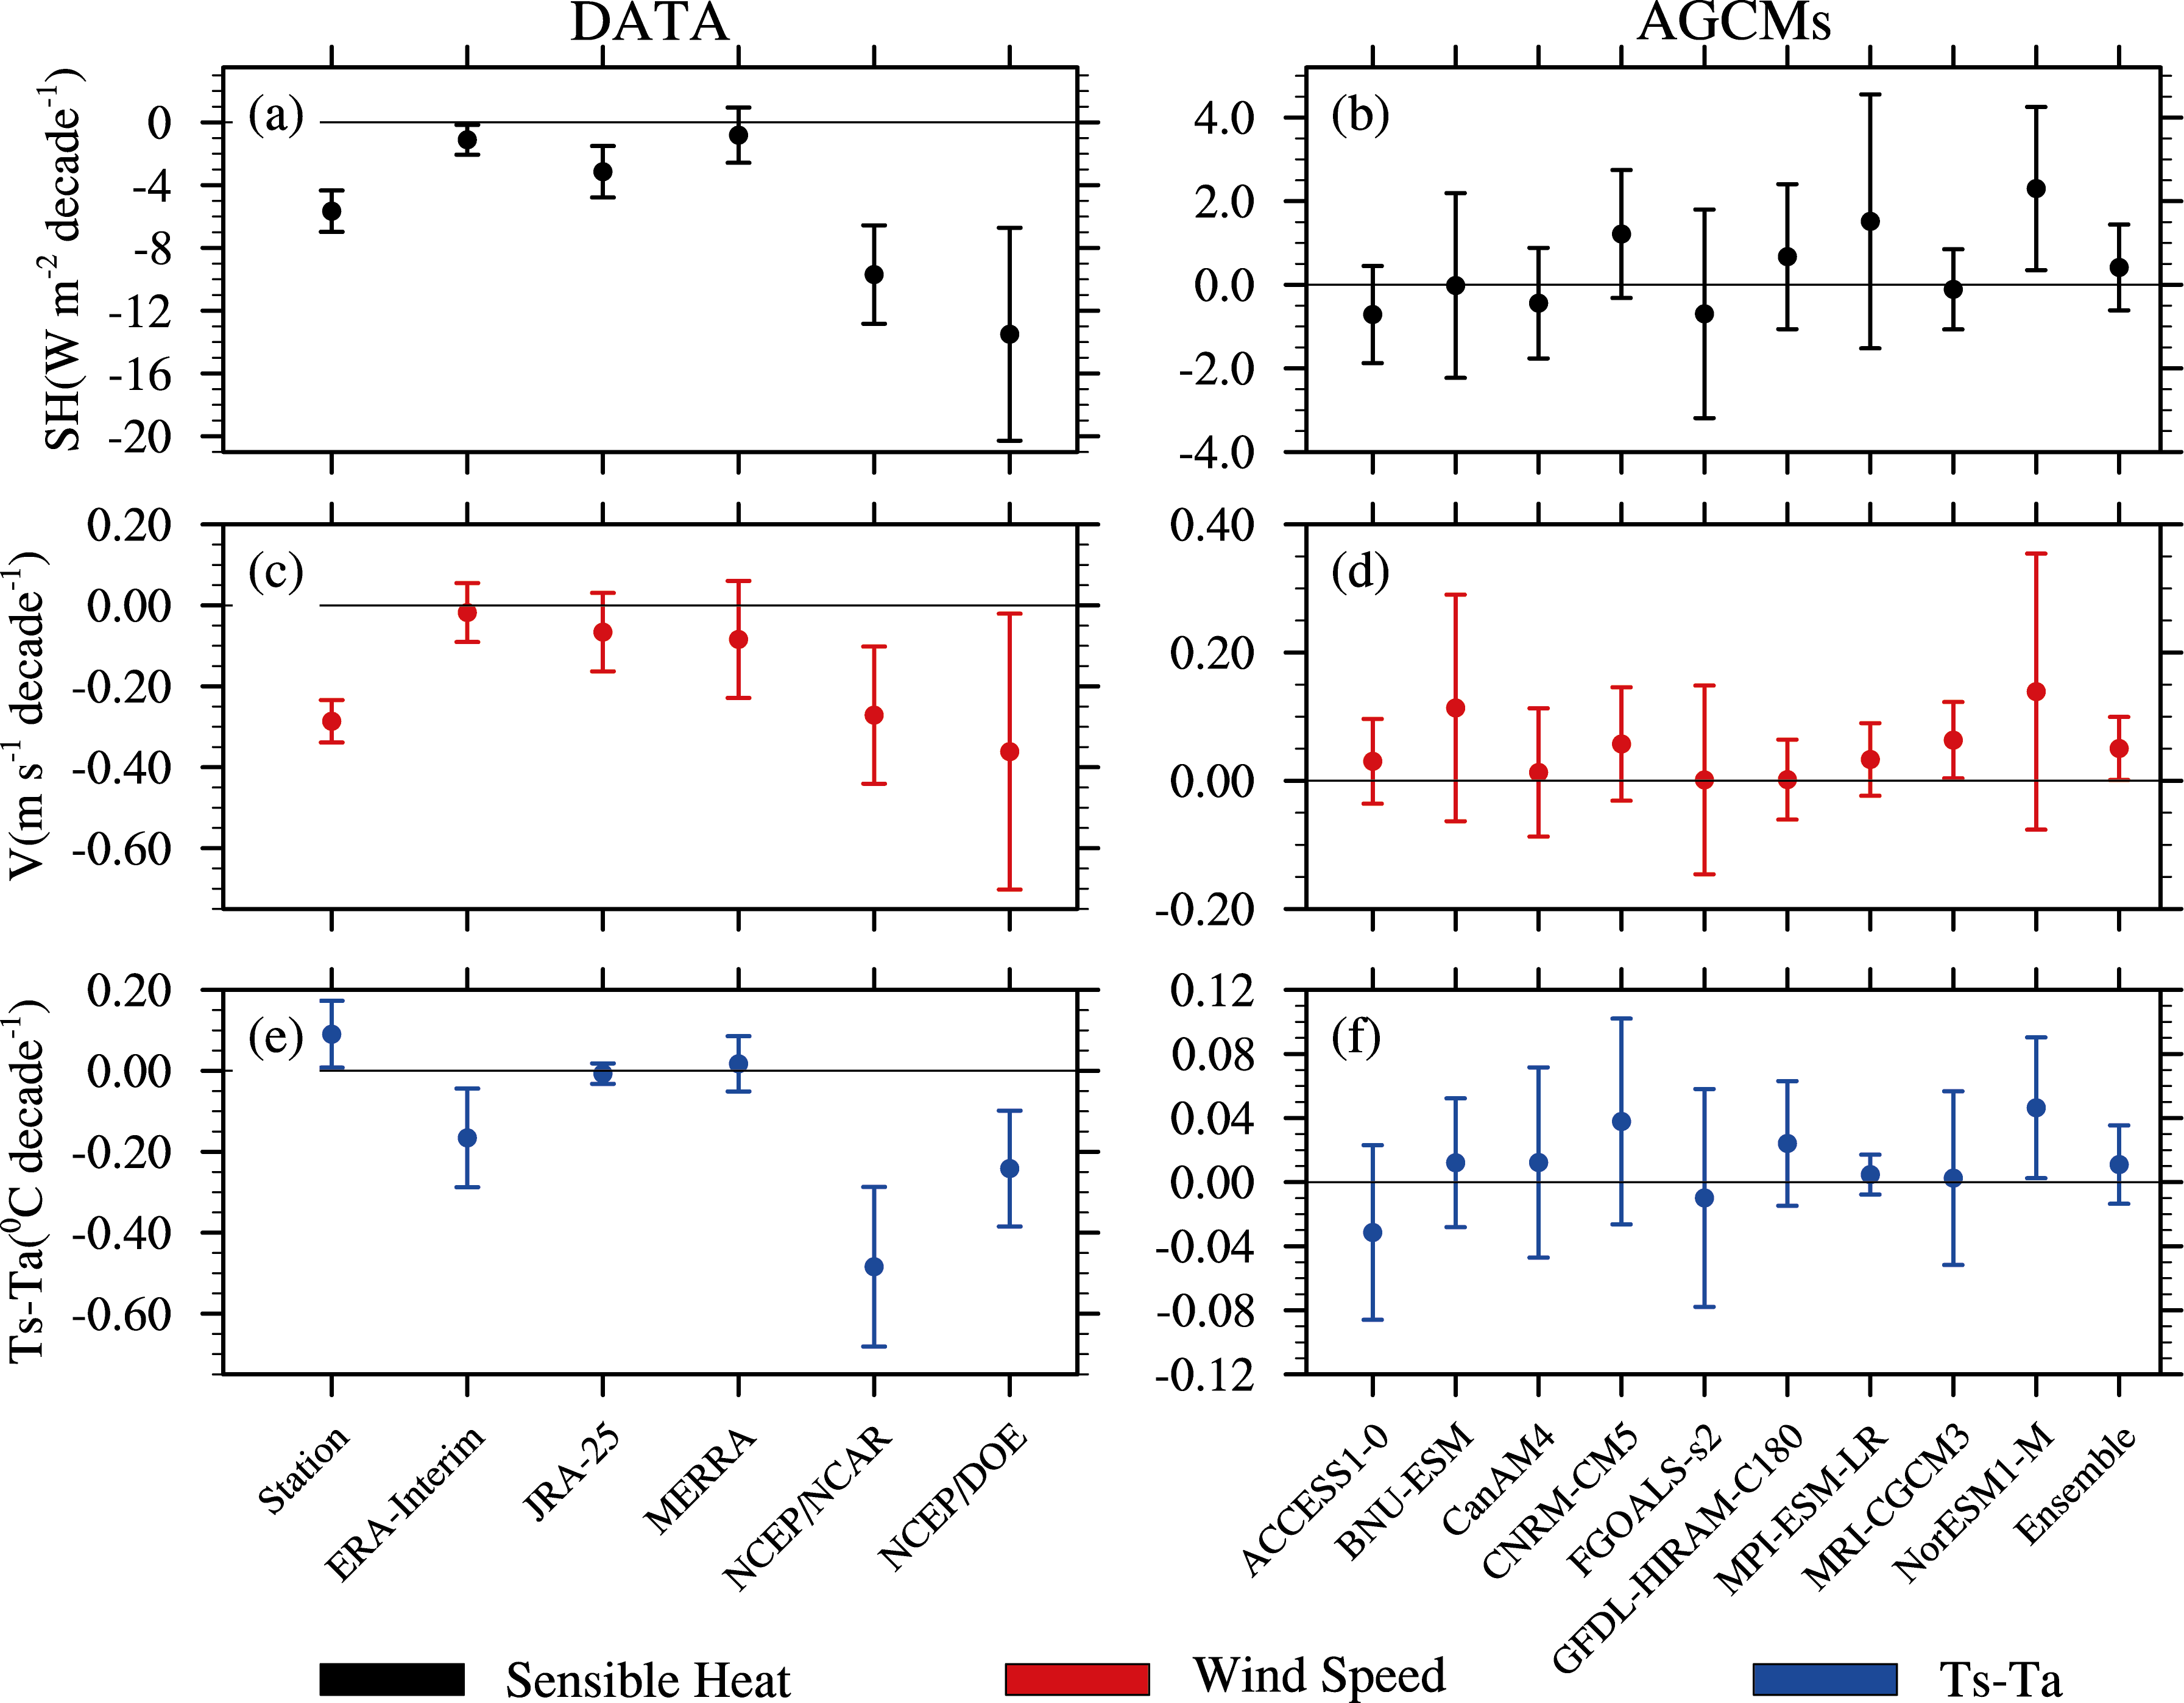 | Figure 3 Average for the 71 stations, and results from the five reanalysis datasets and nine AGCMs (interpolated onto the locations of 71 stations) for spring linear trends in: (a) and (b) SH flux (W m-2 per decade), (c) and (d) V (m s-1 per decade), and (e) and (f) Ts- Ta (°C per decade) for 1980-2005. The solid lines denote the zero values and the bars indicate the uncertainty at the 95% confidence level based on the standard error. |
In the reanalysis data, due to the assimilation procedure that takes into account the in situ observations, the declining trend in V is consistent with the observations over the TP, which helps to obtain the observed downward trend in SH. However, with regard to Ts- Ta, only MERRA shows a slightly increasing trend, and the decreasing trend in the other four other reanalysis datasets further enhances the weakening trend in the SH. Note that the trends in SH, V, and Ts- Ta averaged over the 71 stations exceed the 95% confidence level, and this is also the case for NCEP/ NCAR and NCEP/DOE.
The changes simulated in the SH, V, and Ts- Ta by the nine AGCMs show a remarkable degree of divergence and uncertainty. Among them, only one model (Norwegian Earth System Model (NorESM1-M)) exhibits a significant trend in SH, but the sign is opposite to the station data. This result is not surprising for two reasons. Firstly, unlike the reanalysis data, the in situ observations are not included in the AGCMs and the historical forcing fields. Secondly, the small value of the climate mean Ts- Ta related to the cold bias in the models might also be important in the trend of the SH compared to the observation, as shown in the right panels of Fig. 3.
Based on various reanalysis datasets, recent studies by Zhu et al. (2007) and Wang et al. (2012) suggested that, over the TP, there has been a decreasing trend in the total atmospheric heat source, which agrees with the results derived from in situ and satellite observations ( Duan and Wu, 2008). To test the models’ abilities to reproduce the trend in the total diabatic heating over the TP, in Fig. 4 we plot the trend in each individual component of diabatic heating over the CETP derived from the JRA-25 reanalysis data and the nine AGCMs. It is evident that in the JRA-25 data a significant decreasing trend in the atmospheric diabatic heating occurs from 1980 to 2005 due to the weakened SH flux and enhanced radiative cooling effect, despite it being offset somewhat by a slight increase in latent heat. In the AGCMs, the decreasing trend in the total atmospheric diabatic heating occurs in only a few models (NorESM1-M, GFDL-HIRAM-C180, Meteorological Research Institute-coupled climate model (MRI- CGCM3), and Centre National de Recherches Meteorologiques/Centre Europeen de Recherche et Formation Avancees en Calcul Scientifique (CNRM-CM5), in order of amplitude), and most are not statistically significant. Moreover, the trend is induced mainly by the reduced latent heat release rather than the SH flux. Two AGCMs (CanAM4 and The Flexible Global Ocean-Atmosphere-Land System model, Spectral Version 2 (FGOALS-s2)) even show a significant increasing trend in the total atmospheric diabatic heating, due to the remarkable increase in the release of latent heat. Therefore, the current AGCMs have almost no skill at reproducing changes in either the SH flux or the total atmospheric heat source over the CETP.
 | Figure 4 Linear trends in the total atmospheric heat source (TH) and each component, i.e., SH, heat release due to condensation of precipitation (CH), and the net radiative cooling of the air column (RC) for 1980-2005 in CETP domain-averaged results from the JRA-25 data and the nine AGCMs. All results were regridded onto 2.5°×2.5° grids to facilitate the comparison. Units: W m-2 per decade. The bars indicate the uncertainty at the 95% confidence level based on the standard error. |
In this paper, we have examined the ability of state-of-the-art AGCMs to simulate recent trends in the spring atmospheric diabatic heating over the CETP. By comparing simulations from nine AGCMs driven by historical forcing fields, with observational records, and five reanalysis datasets, we found that the AGCMs are unable to reproduce the observed weakening trend in the spring SH flux and the total atmospheric diabatic heating over the CETP. According to the bulk formula, the observed trend in the SH over the CETP depends chiefly on the change in V due to the distinct Ts- Ta. The decelerated V is thereby responsible for the downward trend in SH. However, in the models, the trend in the SH is determined by the change in both V and Ts- Ta for the systematic surface cold bias. As a result, most of the AGCMs cannot reproduce the observed trend in either V or Ts- Ta, which leads to their inability to simulate the trend in SH. In addition, the simulated trends in the other two components of the total atmospheric diabatic heating (i.e., the release of latent heat due to precipitation and the net radiative cooling of the air column) also showed a large discrepancy. Therefore, it is necessary to improve the physical schemes that simulate land surface processes and atmospheric diabatic heating, such as cumulus convective and cloud- radiation feedback mechanisms, if we wish to realistically reproduce local climate change.
As revealed by our previous study ( Duan and Wu, 2009), the trend in surface wind speed over the TP is directly related to the large-scale warming pattern and the resultant change in the westerly jet in the upper troposphere. The intrinsic link between regional and large-scale climate changes around the TP, together with the interactions among the components of the atmospheric diabatic heating, require further investigation.
| 1 |
|
| 2 |
|
| 3 |
|
| 4 |
|
| 5 |
|
| 6 |
|
| 7 |
|
| 8 |
|
| 9 |
|
| 10 |
|
| 11 |
|
| 12 |
|
| 13 |
|
| 14 |
|
| 15 |
|
| 16 |
|
| 17 |
|
| 18 |
|
| 19 |
|
| 20 |
|
| 21 |
|
| 22 |
|
| 23 |
|
| 24 |
|
| 25 |
|
| 26 |
|
| 27 |
|