An Investigation of the Formation of the Heat Wave in Southern China in Summer 2013 and the Relevant Abnormal Subtropical High Activities
Cite this Article
PENG Jing-Bei. An Investigation of the Formation of the Heat Wave in Southern China in Summer 2013 and the Relevant Abnormal Subtropical High Activities. Atmospheric and Oceanic Science Letters, 2014, 7(4): 286-290 
Permissions
Copyright?2014, Editorial office of Atmospheric and Oceanic Science Letters
This is an Open Access article under the terms of CCAL.
An Investigation of the Formation of the Heat Wave in Southern China in Summer 2013 and the Relevant Abnormal Subtropical High Activities
Abstract
In the summer of 2013, an unprecedented heat wave was experienced over a vast area of southern China. The great areal extent, duration, and strength of this high temperature are very rare. For the 2013 hot spell, the major and direct influence mostly came from the anomaly of the western Pacific subtropical high (WPSH). The abnormally strong and stable WPSH was associated with specific surrounding circulations. The eastward extension of a stronger Qinghai-Xizang high favored the westward extension of the WPSH. The weaker cold air activity from the polar region led to the northward shift of the WPSH and helped it to remain stable. In the tropics, the western segment of the ITCZ was abnormally strong in the period, and supported the maintenance of the WPSH from the south. In addition, the interdecadal variation of the WPSH provided a decadal background for the anomaly variation of the WPSH that summer.
Keyword:
heat wave; southern China; western Pacific subtropical high
1 Introduction
In 2013, the Mei-yu period ended earlier than usual, on about 28 June. After the mei-yu period, southern China experienced an unprecedented heat wave-unprecedented in terms of its great areal extent, duration, and the level of the high temperatures. The maximum temperature exceeded 42°C in most part of Zhejiang Province. The heat wave had significant influence on the local economy and even caused deaths of both people and livestock鈶犫憽.
A previous study showed that the 2013 heat wave was caused by a strong and steady western Pacific subtropical high (WPSH). The reason why the WPSH was maintained is still unclear. Zhao et al. (2012) found there are various types of WPSH, and each type of WPSH corresponds to a different atmospheric circulation pattern. To address why the WPSH was maintained in the summer of 2013, we discuss the distribution of anomalous circulation in the subtropical, mid-latitude, high-latitude, and tropical areas.
We started with the daily maximum temperature ( Tmax) recorded at 2043 stations distributed over China from 1 May to 31 August 2013 by the China Meteorological Administration, and the daily Tmax at 756 stations from 1 June to 31 August during 1951-2009, which was supplied by the National Climate Center. We also used the daily geopotential height over 500 hPa and 100 hPa (hereafter Z500 and Z100), the 200-hPa zonal wind, the zonal and meridional wind over 850 hPa, and the outgoing longwave radiation (OLR) from the National Centers for Environmental Prediction-National Center for Atmospheric Research (NCEP-NCAR) reanalysis, which are available on a global 2.5° latitude/longitude grid ( Kalnay et al., 1996); the monthly mean latitudinal position of the ridge line and the longitudinal position of the western end of the ridge of the WPSH in July from 1951 to 2013 provi-ded by the National Climate Center; and the typhoon paths in July and August, from 2008 to 2013 (http://typ-hoon.weather.com.cn/). The climate mean refers to that for 1981-2010, unless otherwise stated. According to the China Meteorological Administration, a day is defined as hot when Tmax ≥ 35°C. This criterion for a hot day has been used widely in studies of heat waves in China ( Ding and Qian, 2011; Chen et al., 2013).
2 Description of the heat wave
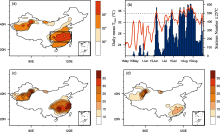
A long spell of hot and dry weather occurred in the southern part of China in the summer of 2013. It was cha-racterized by a large area of coverage, long persistency, and intense heat. According to the report of China Met-eorology Daily, the heat wave covered an area of 3.177 million km2 up to 30 July 2013. Figure 1a shows the distribution of Tmaxaveraged for 2 July to 19 August 2013. In this period, the mean Tmax exceeded 35°C for most parts of Zhejiang, Hubei, and Hunan provinces, the southern parts of Jiangsu, Anhui, and Henan provinces; and the northern parts of Fujian and Jiangxi provinces. The area (27-36°N, 105-122°E) with the highest mean temperature was selected and referred to as the "Southern Hot Region" (SHR), which largely approximates to the domain with a surface air anomaly temperature ≥ +2°C for the same period, based on NCEP data (figure omitted). Statistics on the number of stations with hot weather in that region were collected. The results show that in the period 2 July to 19 August, up to 400 stations recorded hot weather each day, which was 55% of the total 721 stations (Fig. 1b). The maximum was on 12 August when 607 stations recorded hot weather, which was 84.2% of the total.
 | Figure 1 (a) Distribution of Tmax (°C) average for 2 July to 19 August 2013. The thick black outline indicates the Southern Hot Region. (b) Time series of the daily number of stations with hot weather (blue bars) and the areal mean daily maximum temperature (red line; units: °C) in the Southern Hot Region. (c) Distribution of hot days for 2 July to 19 August 2013. (d) Distribution of the climate mean (1980-2009) hot days ( Tmax ≥ 35°C) for 2 July to 19 August. |
Regarding the duration of the heat wave, the hot weather in the southern part of China appeared as early as in June 2013. Intense heat occurred at more than 500 stations during 17-22 June. In the last ten days of June, the Mei-yu for the mid and lower reaches of the Yangtze River started and the temperature dropped back. With the ending of the Mei-yu period, the hot and clear spell arose again. On 2 July, the number of stations recording a high temperature (above 35°C) increased sharply from 82 to 356, and the Tmax averaged for the SHR exceeded 30°C. Thereafter, the areal mean daily Tmax for the SHR basically stayed at a level above 32°C. From 2 July to 19 August, there were more than 35 hot days for the northern part of Zhejiang, southern Jiangsu, and the northeastern part of Hunan provinces (Fig. 1c). Using the observed data from 756 stations, the climate mean hot days ( Tmax ≥ 35°C) was calculated for the same period (Fig. 1d), the mean being for the period 1980-2009 due to the limited data available. Comparing Fig. 1c with Fig. 1d, it can be clearly seen that the number of hot days over the southern region of China in summer 2013 exceeded the climate mean by 15 to 20 days. After 19 August, with the eastward retreat and weakening of the WPSH, the extension and the strength of the southern hot spell were reduced somewhat.
The intensity of the hot spell broke many historical records in the southern region of China. Take Zhejiang Province as an example: On 9 August, a Tmax of 39°C -41°C appeared in most parts of Zhejiang, except some islands off the coast. The Tmax even exceeded 42°C for the six cities or counties of Fenghua, Xinchang, Jiande, Shaoxing, Zhuji, and Xiaoshan; and the Tmax reached 41.6°C in Hangzhou, breaking the record there again. On 7 and 9 August, the Tmax in Fenghua reached as high as 43.5°C, creating a new Tmax record for the whole of Zhejiang Province. This persistent hot spell constituted the most intense and persistent hot weather in the southern regions of China since 1949.
3 Possible causes of the heat wave
As the heat wave mainly ranged from 2 July to 19 August, the following analysis focuses on the mean fields averaged for that period and the comparison is with the climate mean for the same period.
3.1 Anomaly of the WPSH
For the 2013 heat wave, the major and direct influence mostly came from the anomaly of the WPSH. When the WPSH is stronger and extends much farther west than normal, the east of China is under the control of a strong WPSH, and a heat wave tends to occur. It is also a direct influential system for the mid-summer drought that occurs in the southern region of China. Therefore, it is essential to specifically investigate the features of the WPSH in the summer of 2013 and the mechanisms behind it.
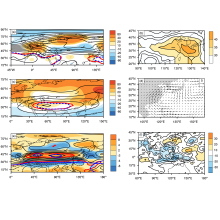
We used the contour of 5880 gpm to characterize the domain of the WPSH. During 2 July to 19 August, the western end of the WPSH was located at around 118°E over the Yangtze River valley, about 10° of longitude farther west than normal; and the ridge-line lingered at about 30°N, about 2° of latitude farther north than normal (Fig. 2a). Positive Z500 anomalies prevailed over the southern region of China. Statistics show that the days with positive Z500anomalies over that region reached more than 40 out of 49 days from 2 July to 19 August (Fig. 2b). This means that the WPSH was very stable, leading to the persistent hot weather in the region.
An abnormally strong and stable WPSH must be associated with specific surrounding circulations. In the following section, we examine this connection and investigate the role of those relevant systems in the anomalous WPSH activity.
3.2 Activity of the Qinghai-Xizang high
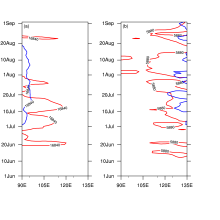
We first examine the influence of the Qinghai-Xizang high (QH) activity in the upper troposphere on the WPSH. Figure 2c shows the mean Z100 and its anomalies for 2 July to 19 August 2013. The area of positive anomaly Z100 covered most of the subtropical Eurasian continent, indicating a stronger than normal QH. Its center lay over the Plateau of Iran. Using the contour of 16840 gpm to characterize the extent of the QH, the eastward extension of the QH is apparent, with the contour of 16840 gpm, extending eastward by 10° of longitude compared with the climate mean. It is well known that there exists a very close relation between the eastern-western shift of the WPSH and the activity of the QH, i.e., the relation of "face to face" displacement, or "back to back" departure from each other. This means that an eastward displacement of the QH tends to be accompanied by a westward shift of the WPSH, and vice versa (Tao and Zhu, 1964; Tan et al., 2005). Figure 3 shows the time-longitude evolution of the 27.5-32.5°N mean Z500 and Z100, where we can see the relative movement of the two big systems. The WPSH experienced westward-extending processes at the beginning of July, for the second and last ten days of July, and the first ten days of August. All the processes corresponded well with the eastward extension of the QH, except for the process in August when the eastward extension of the QH was not that apparent. A careful look reveals that the activity of the high pressure system in the upper troposphere preceded the westward extension of themid-level WPSH. In the lower troposphere, the region of the middle and lower reaches of the Yangtze River was under the control of a strong anomalous anticyclone (Fig. 2d), which meant that this maintenance of the WPSH was only a part of the anomaly of the high pressure system of the whole troposphere. This deep anomaly system thro-ughout the troposphere led to the stability of the system.
 | Figure 2 The circulation for 2 July to 19 August 2013: (a) The mean Z500 (contours) and its anomalies (shaded; units: gpm). Red and blue lines are the 5880-gpm contour in 2013 and its long-term mean. (b) Days with positive Z500anomalies. (c) Mean Z100 (contours) and its anomalies (shaded; units: gpm). Red and blue lines are the 16840-gpm contour in 2013 and its long-term mean. (d) Mean wind anomalies over 850 hPa (units: m s-1). (e) Mean zonal wind over 200 hPa (contours) and its anomalies (shaded; units: m s-1). Red lines are for 0 m s-1 and 30 m s-1 in 2013, and blue lines are the ones for the long-term mean. (f) Mean OLR anomalies (units: W m-1). |
 | Figure 3 Time-longitude evolution of 27.5-32.5°N mean 5880-gpm and 16840-gpm contours from 1 June to 4 September 2013. Red lines represent the 16840 gpm (left) and 5880 gpm (right) contours in 2013 and the blue lines represent the long-term mean. |
3.3 Characteristics of mid- and high-latitude circulations
The abnormal activity of the WPSH is closely related to the disposition and impact of mid- and high-latitude circulations, such as the position of the polar vortex, the disposition of troughs and ridges in the westerlies, and the strength of the westerly jet ( Wu et al., 2000). It can be seen from examining the contour of 5480 gpm that in the summer of 2013 the polar vortex was biased to the Green-land area of the Western Hemisphere (Fig. 2a), which im-plies that the cold air activity over Asia from the polar region was weak. The polar frontal zone was located relatively to the north with propagating minor trough and rid-ge activities indicating no southward intrusion of strong cold air occurring in that period. This supported the nort-hward shift of the WPSH and helped it to remain stable ( Zhang and Tao, 2003). Figure 2e gives the situation of the circulation in the westerlies and the westerly jet. It can be seen that from 2 July to 19 August 2013 the central area ( u ≥ 30 m s-1) of the mid-latitude westerly jet occupied an area larger and relatively to the north compared with the climate mean, and it was clearly stronger. This implies that the westerlies shrank northward and zonal circulation prevailed. These prevented the cyclonic eddies in the westerlies from influencing the subtropical region, thus supporting the maintenance of the WPSH at about 30°N.
3.4 Anomalous circulation in the tropics
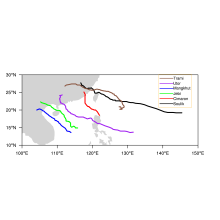
It is well known that the easterly flow at the southern flank of the WPSH in summer is an important component of the ITCZ. The activity of the WPSH can be highly influenced by the location and strength of the ITCZ. At the anomalous field of divergence (figure omitted), there was a large area of anomalous convergence to the west of 90°E in the tropics, which indicates the strengthening of the ITCZ over that area. A strong ITCZ promotes the frequent occurrence of typhoons. It is worth pointing out that during the heat wave there were six typhoons in the tropical western Pacific, and four of them moved west ward along the easterlies at the north flank of the ITCZ and finally landed in China or Vietnam (Fig. 4). In July and August 2013, more typhoons than usual landed in China ( Lin et al., 2013; Yang and He, 2013). The number of typhoons that hit South China (including Vietnam) during the 2013 heat wave was the most since 2008. Extremely strong negative anomalies of OLR appeared in the equatorial 90-135°E (see Fig. 2f) area, which indicates that the western segment of the ITCZ was abnormally strong in the period, and supported the maintenance of the WPSH from the south.
3.5 Impact of interdecadal variation
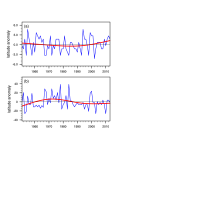
There are distinct characteristics of interdecadal variability in the WPSH ( Lü et al., 2004). Figure 5 presents the yearly evolution and the spline curves fit of the ridge-line position and the western end of the WPSH in July. It can be seen that 2013 was in the stage of decadal variation when the west end of the WPSH lay to the west and the ridge-line was situated to the north of its climate mean. In this context, the interdecadal variation of the WPSH provides the decadal background for the anomalous variation of the WPSH in that summer.
 | Figure 4 The six typhoon paths for 2 July to 19 August 2013. |
 | Figure 5 The yearly evolution (blue lines) and the spline curves fit (red lines) of the anomalies of (a) the ridge-line position and (b) the western end of the WPSH in July. The climate mean is that for 1961-2010. The vertical axis represents (a) the longitude anomalies and (b) the latitude anomalies. The positive (negative) anomalies mean that the ridge-line of the WPSH was situated to the north (south) of its climate mean, and the western end of the WPSH lay to the east (west) of its climate mean. |
4 Discussion and conclusions
In the summer of 2013, a persistent heat wave was experienced over a vast area of southern China. The stre-ngth, extension, and duration of this event are very rare. The main contributing system to the hot weather was the anomalous activity of the WPSH. In this paper, the features of the westward extension and northward shift of the WPSH and its persistency were studied, and the anomalous activity of both the mid- and high-latitude circulations and the tropical systems were pinpointed. The present investigation could provide a basis for further res-earch on the course of persistent heat waves.
In this paper, we discussed the role of the relevant systems in the anomalous WPSH activity. Sea surface temperature anomalies (SSTAs) are the important external forcing. SSTAs could cause the circulation anomalies. The wind anomalies over 850 hPa during the 2013 heat wave resembled those forced by the warm Indian Ocean and South China Sea ( Liu, 2008). In addition, SSTAs in the tropics may have direct impacts on the tropical precipitation anomalies, which would excite a Rossby wave response and affect the maintenance of the WPSH (Wang et al., 2003). As mentioned above, more typhoons hit China during the heat wave. The increased number of landing typhoons implies that the ITCZ was active and there was a northward shift. The active ITCZ may play an importantrole in the maintenance of the WPSH. Therefore, these factors should be studied in future investigations.
Acknowledgements.The authors are grateful to Prof. SUN Shuqing, Prof. CHEN Lieting, Prof. JI Liren, and the two anonymous reviewers for their constructive suggestions, which improved the manuscript substantially. This work was supported by the Special Public Welfare Research Fund of China Meteorological Administration (Grant No. GYHY201406020) and the National Natural Science Foundation of China (Grant No. 41375055).
Reference
| 1 |
|
| 2 |
|
| 3 |
|
| 4 |
|
| 5 |
|
| 6 |
|
| 7 |
|
| 8 |
|
| 9 |
|
| 10 |
|
| 11 |
|
| 12 |
|
| 13 |
|