A Theoretical Explanation of Anomalous Atmospheric Circulation Associated with ENSO Modoki during Boreal Winter
Cite this Article
XING Nan, LI Jian-Ping, LI Yao-Kun. A Theoretical Explanation of Anomalous Atmospheric Circulation Associated with ENSO Modoki during Boreal Winter. Atmospheric and Oceanic Science Letters, 2014, 7(4): 352-357 
Permissions
Copyright?2014, Editorial office of Atmospheric and Oceanic Science Letters
This is an Open Access article under the terms of CCAL.
A Theoretical Explanation of Anomalous Atmospheric Circulation Associated with ENSO Modoki during Boreal Winter
Abstract
Based on a linear model, the present study pro-vides analytical solutions for ideal triple forcing sources similar to sea surface temperature anomaly (SSTA) patterns associated with El Niño-Southern Oscillation (ENSO) Modoki in winter. The ideal triple pattern is composed of an equatorially symmetric heat source in the middle and equatorially asymmetric cold forcing in the southeast and northwest. The equatorially symmetric heat source excites low-level cyclonic circulation anomalies associated with Rossby waves in both hemispheres, while the northwestern and southeastern equatorially asymmetric cold sources induce low-level anomalous anticyclones associated with Rossby waves in the hemisphere where the forcing source is located. Low-level zonal winds converge toward the heat sources associated with Kelvin and Rossby waves. Due to unequal forcing intensity in the northwest and sou-theast, atmospheric responses around the equatorially sym-metric forcing become asymmetric, and low-level cyclonic circulation anomalies in the Southern Hemisphere become greater than those in the Northern Hemisphere. Ascending (descending) flows coincide with heat (cold) sources, res-ulting in a double-cell structure over the regions of forcing sources. Ideal triple patterns similar to SSTA patterns associated with La Niña Modoki produce opposite atmos-pheric responses. The theoretical atmospheric responses are consistent with observed circulation anomalies associated with ENSO Modoki. Therefore, the theoretical solutions can explain the dynamics responsible for atmospheric circulation anomalies associated with ENSO Modoki events.
Keyword:
external forcing sources; atmospheric respo-nses; ENSO Modoki
1 Introduction
The El Niño-Southern Oscillation (ENSO) is the dom-inant signal of coupled air-sea interactions in the tropical Pacific. Variations in sea surface temperatures (SSTs) ass-ociated with ENSO events induce atmospheric circulation anomalies, which subsequently result in weather and climate irregularities over local and remote regions (e.g., Bje-rknes, 1966, 1969; Keshavamurty, 1982; Wang et al., 1999, 2013; Wang, 2002). There is increasing evidence for the existence of two ENSO regimes: canonical ENSO and ENSO Modoki (e.g., Rasmusson and Carpenter, 1982; As-hok et al., 2007). Tropical sea surface temperature anomalies (SSTAs) display a bipolar pattern associated with can-onical ENSO ( Rasmusson and Carpenter, 1982), while a triple SSTA pattern in the tropical Pacific is associated with ENSO Modoki ( Ashok et al., 2007). Due to the significant difference between SSTA patterns associated with canonical ENSO and ENSO Modoki, the atmospheric cir-culation anomalies associated with these ENSO regimes have been extensively analyzed (e.g., Weng et al., 2009; Feng and Li, 2011, 2013; Yuan and Yan, 2012; Fu et al., 2013; Yuan and He, 2013; Xu et al., 2013). Such investigations have provided evidence that different modes of ENSO can exert significantly different climate impacts on local and remote regions.
Several numerical models have been developed to sim-ulate and interpret atmospheric responses to heating for-cing, from simple atmospheric models to complex atmos-pheric general circulation models (e.g., Matsuno, 1966; Webster, 1972; Gill, 1980; Zebiak, 1986; Jin and Hoskins, 1995; Wang, 2000). Gill (1980) used linear shallow water equations (hereafter referred to as the Gill model) to explain atmospheric responses to heating forcing. Low-level easterlies and westerlies develop to the east and west of the equatorial symmetric heating associated with Kelvin and Rossby waves, respectively, while a pair of cyclones forms to the west of the heating zone. This is known as the Gill pattern ( Gill, 1980). The complexity of atmospheric general circulation models makes it difficult to use them to gain insight into fundamental processes. Therefore, the Gill pattern is often used to provide a dynamic explanation of atmospheric circulation forced by equatorial heating simulated by numerical models (e.g., Wu and Liu, 1992; Ratnam et al., 2012; Wu and Zhou, 2013). Using the Gill model, Xing et al. (2014) calculated the general solutions for isolated equatorial asymmetric forcing sour-ces. The general solutions provide perfect analytical solutions, and they can be applied to general forms of such sources. However, the Gill model does not incorporate theoretical atmospheric responses forced by hybrid external forcing sources.
In this study, the Gill model is used to explore the atmospheric responses to triple external forcing sources (a discussion of responses to bipolar external forcing sources is beyond the scope of this paper). Firstly, triple external forcing sources are determined from SSTA patterns associated with ENSO Modoki events. Secondly, the atmospheric responses to ideal triple forcing sources are explored. Finally, the theoretical solutions are compared with atmospheric circulation anomalies associated with ENSO Modoki events in the natural atmosphere. The comparison is used to confirm the theoretical solutions. The remainder of the paper is organized as follows. Section 2 provides an overview of the methodology used in this study, including the Gill model, data, and analyses. Section 3 describes the atmospheric circulation anomalies associated with triple SSTA patterns from observational data. Section 4 determines the ideal forcing sources similar to triple SSTA patterns associated with ENSO Modoki events, and compares the corresponding analytical solutions with observed results. Finally, section 5 provides a summary and discussion of the results.
2 Model, data, and methodology
2.1 Model
To study atmospheric responses to steady-state forcing, the advection term is neglected and the dissipative process is included in the model ( Matsuno, 1966; Gill, 1980):
| , (1) |
| , (2) |
| , (3) |
In these equations, ( x, y) is non-dimensional distance, with x eastwards and y measured northwards from the equator; ( u, v) is proportional to horizontal velocity; w is proportional to vertical velocity; and p is proportional to the pressure perturbation. Q is proportional to the heating rate and
As the forcing source in the natural atmosphere commonly has a form with diminishing strength variability from the center to the surrounding atmosphere (e.g., As-hok et al., 2007; Jiang and Li, 2011), the equation of triple external forcing sources, Q, as used in this study, has a similar pattern to the practical forcing source distribution ( Gill, 1980):
| (5) |
where, A1, A2, and A3 represent the forcing intensity; d1, d2, and d3 are the meridional positions of forcing centers; d1 > 0, d2 > 0, d3 > 0 and d1 < 0, d2 < 0, d3 < 0 are the source centers located in the Southern Hemisphere and Northern Hemisphere, respectively; l1, l2, and l3 are the zonal distances of forcing centers; and 2 L1, 2 L2, and 2 L3 are the zonal width of the forcing sources.
If d1 is equal to 0, the forcing source, Q1, is equatorial symmetric. The detailed solutions for the pressure and velocity components are given by Eqs. (4.3) and (4.8) in Gill (1980). If d1 is not equal to 0, Q1 is equatorially asymmetric. Equatorially asymmetric forcing, Q1, expands in the form of parabolic cylinder functions ( Xing et al., 2014):
| , (6) |
where
Parabolic cylinder functions,
| (8) |
where,
The detailed solutions for the first two terms of the expansion forcing source, Q1, are given by Eqs. (4.3), (4.8), (5.2), and (5.6) in Gill (1980). General solutions for the remaining expansion terms (
| (10) |
| , (11) |
where
D is the height of a rigid lid ( Gill, 1980). Anomalous pressure and horizontal velocity vary with height, z, as
2.2 Data and methodology
Global monthly SST data were obtained from the Extended Reconstruction SST (ERSST) ( Smith et al., 2008) on a 2° × 2° grid, and monthly atmospheric fields were from the National Centers for Environmental Prediction/ National Center for Atmospheric Research (NCEP/NCAR) reanalysis ( Kalnay et al., 1996).
The ENSO Modoki index (EMI) is calculated following Ashok et al. (2007):
| , (12) |
where the square brackets with a subscript represent the areal mean SSTA over the equatorial central Pacific region (C: 10°S-10°N, 165°E-140°W), the eastern Pacific region (E: 15°S-5°N, 110-70°W), and the western Pacific region (W: 10°S-20°N, 125-145°E). The SST and atmospheric data used in this study cover the period 1979- 2012.
Circulation patterns associated with SSTA patterns are investigated by composite analyses. Here, the composite analyses for an index are the "strong" values (greater than plus one standard deviation of the index) and "weak" va-lues (less than minus one standard deviation of the index). Thus, the warm years for ENSO Modoki selected are 1990, 1991, 1994, 2004, and 2009, while the cold years for ENSO Modoki are 1988, 1997, 1998, 1999, 2000, 2007, 2008, 2010, and 2011.
3 Circulation anomalies associated with SSTA patterns in the tropical Pacific
Figure 1 shows the anomalous SST and horizontal circulation in the lower troposphere and tropical averaged (10°S-10°N) cells associated with ENSO Modoki during the winter. Positive SSTA in the eastern and western Pacific and negative anomalies in the central Pacific are associated with El Niño Modoki events in the winter (e.g., Ashok et al., 2007). Positive SSTA is equatorially quasi- symmetrical over the central Pacific, with the maximum SSTA located around the equator. The minimum SSTA is centered over the eastern and western Pacific at 10°S and 10°N, respectively. SSTA intensity is greatest in the central Pacific, followed by the western Pacific, and finally the eastern Pacific. Cyclonic circulation occurs in both hemispheres and is associated with positive SSTA in the central Pacific, while anticyclones are located at the wes-tern margins of negative SSTA centers in the eastern and western Pacific. Ascending motions appear to coincide with the regions of positive SSTA in the central Pacific, while descending flows are concentrated in the eastern and western Pacific (Fig. 1a). It appears that the intensity of the anticyclone and descending flows over the eastern Pacific are weaker than those over the western Pacific, while the intensity of horizontal circulation and vertical velocity over the central Pacific is highest, and anomalous cyclonic circulation in the Southern Hemisphere is greater than that in the Northern Hemisphere over the central Pacific. The structure of anomalous zonal circulation (Fig. 1b) reveals the anomalous circulation characteristics associated with El Niño Modoki events. The anomalous Walker circulation has a double-cell structure in the tro-pical Pacific, with an upward branch over the central Pacific and subsidence around 140°E and 100°W over colder regions. The cell range and intensity in the western Pacific are wider and greater than in the eastern Pacific (Fig. 1b). The SSTA pattern in the cold events is almost opposite to that of the warm events, as are the corresponding horizontal and vertical atmospheric circulation patterns (Figs. 1c and 1d).
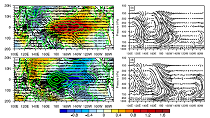 | Figure 1 Composite anomalies in the tropical Pacific during the warm and cold phases of ENSO Modoki in winter, showing (a, c) anomalous SST (shading, units: °C), horizontal wind at 850 hPa (arrows, units: m s-1), vertical velocity at 850 hPa (contours, units: Pa s-1; interval: 0.01) and (b, d) anomalous wind vector (zonal wind, units: m s-1; vertical velocity, units: -10-3 Pa s-1) in equatorial (10°S-10°N average) vertical cross sections. (a) and (b) are for El Niño Modoki events; (c) and (d) are for La Niña Modoki events. |
4 Ideal triple external forcing sources and the cor-responding atmospheric response characteristics
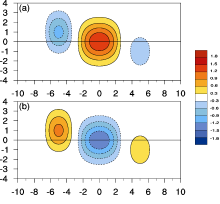
Figure 2 shows ideal triple external forcing sources given by Eq. (5). The triple forcing sources in Fig. 2a are obtained by setting A1= -1, A2 = 1.5, A3= -0.5, 2 L1 = 4, 2 L2= 6, 2 L3= 4, d1= -1, d2= 0, d3= 1, l1= 5, l2= 0, and l3= -5. The equations used in the Gill model are non-dimensio-nal, and one non-dimensional unit is approximately 10° of latitude. Figure 2a shows the triple pattern, with one equatorially asymmetric cold zone centered on 10°N in the northwest section, one equatorially symmetric heat zone in the middle section, and one equatorially asymmetric cold zone centered on 10°S in the southeast section. The intensity of the equatorially symmetric heat source is greatest, and its range is widest, followed by the cold source in the northwest part, and finally the cold source in the southeast part. This ideal triple pattern is similar to the SSTA pattern shown in Fig. 1a. When the sign of A is reversed in Fig. 2a, the opposite phase of triple forcing sources is obtained (Fig. 2b).
 | Figure 2 Distribution of ideal triple forcing sources given by Eq. (5): (a) ideal triple forcing sources with A1= -1, A2 = 1, A3= -1, 2 L1 = 4, 2 L2= 6, 2 L3= 4, d1= -1, d2= 0, d3= 1, l1= 5, l2= 0, and l3= -5; (b) the same as (a) except for reversed signs of A1, A2, and A3. |
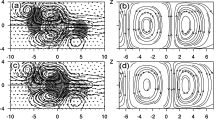
Figure 3 shows the low-level atmospheric responses to the ideal triple external forcing sources in Fig. 2. The equatorially symmetric heat source forces a pair of cyclones at the western margins of the heat zone in both hemispheres, while cold sources force the development of anticyclones at the western margins of cold zones in the hemisphere where the cold sources are located. Other atmospheric responses include the convergence of zonal winds associated with Kelvin and Rossby waves toward the heat source, ascending motions that coincide with regions of the heat source and descending flows that are concentrated in the regions of cold sources (Fig. 3a) The anomalous zonal circulation has a double-cell structure, with a relatively weak cell in the eastern part. The upward branch of this circulation is located over the heat zone region, while the downward branch is located over the bilateral regions (Fig. 3b). A pair of anticyclones is evident at the western margins of the cold zone; the equatorial asymmetric forcing source excites equatorially asy-mmetric atmospheric responses, resulting in the development of a cyclone in the Northern Hemisphere, which is driven by the northwest heat source. Similarly, a cyclone forced by the southeastern heat source develops in the Southern Hemisphere. Therefore, ascending and descending flows appear to coincide with the regions of heat and cold sources, respectively (Fig. 3c). The anomalous zonal circulation also has a double-cell structure, with downward motions over the cold zone and upward motions over heat zones (Fig. 3d). In terms of forcing intensity in an east-west direction ( Xing et al., 2014), the intensity of cyclonic (anticyclonic) circulation forced by equatorially symmetric heat (cold) sources in the Southern Hemisphere is greatest, followed by cyclonic (anticyclonic) circulation forced by an equatorially symmetric heat (cold) source in the Southern Hemisphere, then anticyclonic (cyclonic) intensity in the northwest, and finally anticyclonic (cyclonic) intensity in the southeast. Simultaneously, the range and intensity of the western cell are wider and greater than the eastern cell (Figs. 3b and 3d), while the upward center shows a small eastward shift from the heat center.
The observed circulation anomalies associated with ENSO Modoki in Fig. 1 are consistent with the atmospheric responses in Fig. 3. Therefore, our result provides a theoretical basis for atmospheric circulation anomalies during the peak phases of ENSO Modoki events.
 | Figure 3 Low-level horizontal wind (arrows), vertical velocity (shading), and pressure (thick contours) solutions (a, c) and meridionally averaged (-1 to 1) stream function contours (b, d) corresponding to the ideal triple forcing sources in Fig. 2. The thin solid lines represent ascending flows in light shading, while the thin dashed lines represent descending flows in dark shading. The thick solid and dashed lines represent positive and negative pressures, respectively. The contour interval is 0.3 in (a) and (c). The contour line of zero is omitted. |
5 Discussion and conclusion
Based on SSTA patterns associated with ENSO Modoki in the natural atmosphere, ideal triple forcing sources are used to obtain analytical solutions of the Gill model to explain the basic features of atmospheric responses to ideal triple forcing sources.
An ideal triple pattern similar to SSTA patterns associated with El Niño Modoki is composed of an equatorially sym-metric heat source in the middle and equatorial asy-mmetric cold forcing in the southeast and northwest. The equatorially symmetric heat source excites low-level cyclonic circulation anomalies associated with Rossby waves in both hemispheres, while the southeastern equatorially asymmetric cold source induces a low-level anomalous ant-icyclone associated with Rossby waves in the hemisphere where the forcing source is located, with the northwestern forcing source following a similar theoretical basis. Low- level zonal winds converge toward the heat sources associated with Kelvin and Rossby waves. As interactions occ-ur among forcing sources, atmospheric responses aro-und equatorially symmetric forcing becomes less symmetric. Low-level cyclonic circulation anomalies in the Southern Hemisphere are greater than those in the Northern Hemisphere due to unequal forcing intensity in the northwest and southeast. Ascending flows coincide with the heat source, while descending flows coincide with the regions of cold sources. This results in a double-cell stru-cture over the forcing sources. The ideal triple pattern similar to SSTA patterns associated with La Niña Modoki results in the opposite atmospheric responses.
The theoretical atmospheric responses are consistent with observed circulation anomalies associated with ENSO Modoki. Therefore, it can be concluded that the theoretical solutions can explain the dynamics responsible for atmospheric circulation anomalies associated with ENSO Modoki events in the natural atmosphere.
Reference
| 1 |
|
| 2 |
|
| 3 |
|
| 4 |
|
| 5 |
|
| 6 |
|
| 7 |
|
| 8 |
|
| 9 |
|
| 10 |
|
| 11 |
|
| 12 |
|
| 13 |
|
| 14 |
|
| 15 |
|
| 16 |
|
| 17 |
|
| 18 |
|
| 19 |
|
| 20 |
|
| 21 |
|
| 22 |
|
| 23 |
|
| 24 |
|
| 25 |
|
| 26 |
|
| 27 |
|
| 28 |
|