Role of the Radiative Effect of Black Carbon in Simulated PM2.5
Concentrations during a Haze Event in China
Concentrations during a Haze Event in China
[LIAO Li1, 2 , LIAO Hong1, *  ]
]
]
|
|


The authors quantify the radiative effect of black carbon (BC) on simulated aerosol concentrations during the heavily polluted haze event of 11-14 January 2013 in northern China using the chemistry version of the Weather Research and Forecasting Model (WRF-Chem). As a result of the stable synoptic conditions, simulated concentrations of BC and PM2.5 averaged over the study period were about 8-16 μg m-3and 80-100 μg m-3, respectively, in the control simulation (CTRL). When BC emissions were doubled (2BC), tripled (3BC), and quadrupled (4BC) relative to the CTRL run, the simulated concentrations of aerosols in different regions showed distinct changes. The radiative effect of BC was simulated to increase concentrations of aerosols over Tianjin (Dom1) and southern Henan (Dom3), but to decrease in southern Hebei (Dom2). Relative to the CTRL simulation, concentrations of PM2.5 over Dom1, Dom2, and Dom3 were simulated in 4BC to change by +18.6 μg m-3 (+32.3%), -5.7 μg m-3 (-7.3%), and +7.2 μg m-3 (+12.6%), respectively. The BC-induced increases in aerosol concentrations corresponded mainly to the reductions in planetary boundary layer height over Dom1 and Dom3. The reductions of aerosol concentrations in Dom2 were mainly caused by the weakened wind convergence at 850 hPa and reduced concentrations of sulfate and nitrate associated with the reduced surface-layer ozone levels and relative humidity.
High concentrations of aerosols during haze events lead to negative health impacts, reductions in visibility, and radiative forcings on regional and global climate ( Chameides et al., 1999; Okada et al., 2001; Schichtel et al., 2001; Chen et al., 2003; Yadav et al., 2003; Kang et al., 2004; Chen et al., 2008; Tuccella et al., 2012). Unprecedented heavily polluted haze episodes were observed recently in populated central and eastern China ( Wang et al., 2014), as a result of the increases in anthropogenic emissions from economic development and the stable synoptic conditions, especially during winter and spring ( Wang et al., 2006). Meteorological conditions such as weak surface wind, low planetary boundary layer height (PBLH), high relative humidity, and low temperature have been shown to play important roles in the formation of heavily polluted episodes ( Sachweh and Koepke, 1995; Fu et al., 2008; Niu et al., 2010).
Concentrations of atmospheric aerosols can also be influenced by their own radiative effects. Aerosols affect radiation by scattering or absorbing solar radiation (i.e., direct effect) and by acting as cloud condensation nuclei to modify cloud properties and lifetime (i.e., indirect effect), which has been reported in previous studies to influence aerosol concentrations by altering surface temperature, PBLH, and precipitation. For example, Liao et al. (2009) found by using a coupled global aerosol-cli-mate model that a positive feedback mechanism exists between aerosol direct radiative forcing and aerosol concentrations; increased aerosol concentrations lead to reductions in convection and precipitation (or wet deposition of aerosols), further increasing lower-tropospheric aerosol concentrations near emission sources. Quan et al. (2013) examined observed planetary boundary layer (PBL) and aerosol concentrations during 9-30 September 2010 in Tianjin, China, and reported that aerosols reduced solar radiation at the surface, depressed the development of the PBL, and hence weakened the diffusion of air pollutants. Black carbon (BC) aerosol is expected to influence aerosol concentrations during haze events because it is a strong absorbing species, but few studies have quantified such impacts of BC. Wendisch et al. (2008), by using the ground-based measurements and the libRadtran radiative transfer model together with a dynamic model of the PBL, found that the PBLH in southeastern China during October-November 2004 was significantly reduced due to the warming of absorbing aerosol particles at the top of the PBL, which led to increases in concentrations of pollutants by about 30%.
During the period 11-14 January 2013, a heavily polluted haze event was observed in northern China, with maximum PM2.5 concentrations of 680 μg m-3 observed in Beijing ( Wang et al., 2014). In this study, we quantify the radiative effect of BC on simulated PM2.5 concentrations during this haze event using the chemistry version of the Weather Research and Forecasting Model (WRF-Chem) model, as part of the effort to understand the mechanisms of the formation of haze events in China.
WRF-Chem version 3.3, released in April 2011, is applied in this study to examine the radiative effect of BC on simulated concentrations of PM2.5 aerosols during the haze event of 11-14 January 2013. WRF-Chem is a fully coupled meteorology-aerosol-radiation-cloud model ( Grell et al., 2005; Fast et al., 2006; Gustafson et al., 2007; Chapman et al., 2009). The major physical schemes used include the modified Purdue Lin microphysics module ( Lin et al., 1983), the Rapid Radiative Transfer Model (RRTM) longwave radiation scheme ( Mlawer et al., 1997), the Goddard shortwave radiation scheme ( Chou et al., 1998), the Yonsei University (YSU) PBL scheme ( Hong et al., 2006), the unified National Centers for Environmental Prediction (NCEP), Oregon State University, Air Force, and Hydrologic Research Lab's (NOAH) land-surface module ( Chen and Dudhia, 2001; Ek et al., 2003), and the Grell-Devenyi cumulus parameterization ( Grell and Devenyi, 2002). Photolysis uses the Fast-J scheme ( Wild et al., 2000). The gas-phase chemistry used is the Carbon-Bond Mechanism version Z (CBM-Z) ( Zaveri and Peters, 1999). The aerosol module is the Model for Simulating Aerosol Interactions and Chemistry (MOSAIC) ( Zaveri et al., 2008), with eight size bins (0.039-0.078, 0.078-0.156, 0.156-0.3125, 0.3125-0.625, 0.625-1.25, 1.25-2.5, 2.5-5.0, 5.0-10 μm). The model is set to simulate the East Asian domain, with 31 vertical layers that cover from the surface to 10 hPa altitude and a horizontal resolution of 60 km.
For the simulation of gas-phase chemistry and all aerosol species (sulfate, nitrate, ammonium, BC, and organic carbon (OC)) in the WRF-Chem model, the David Streets 2006 emissions inventory (http://mic.greenresource.cn/intex-b2006) with 0.5° × 0.5° spatial resolution is used to generate anthropogenic emissions for NO x, CO, non- methane volatile organic compounds (NMVOCs), SO2, BC, and OC. Emissions of NH3 are taken from Streets et al. (2003). Over eastern China (20-45°N, 110-120°E), anthropogenic emissions of NO x, CO, NMVOCs, SO2, NH3, BC, and OC are 3.6 Tg N yr-1, 99.8 Tg CO yr-1, 14.7 Tg C yr-1, 8.9 Tg S yr-1, 6.1 Tg N yr-1, 1.0 Tg C yr-1, and 1.7 Tg C yr-1, respectively.
To examine the radiative effect of BC on simulated concentrations of PM2.5 aerosols, we perform one control simulation (hereafter referred to as CTRL) and three sensitivity simulations with BC emissions doubled, tripled, and quadrupled. In the CTRL simulation, the WRF-Chem model simulates all meteorological and chemical processes with the feedbacks between meteorology and radiative effects of all aerosol species. In the three sensitivity simulations, all model setups remain the same as CTRL except that the BC emissions are multiplied by two, three, and four, respectively. These three sensitivity simulations are hereafter referred to as 2BC, 3BC, and 4BC. Both direct and indirect effects of aerosols are considered in all simulations. The differences in aerosol concentrations between the three sensitivity tests and CTRL are presented in the following section.
For each simulation, the model is firstly spun up for two days and then integrated and analyzed over 11-14 January 2013. All the simulations use the same initial and lateral boundary conditions for meteorological variables, trace gases and aerosols. The meteorological boundary and initial conditions are generated using NCEP Final Analysis (FNL) reanalysis data with 1° × 1° spatial resolution and temporal resolution of 6 h. The chemical initial and lateral boundary conditions for trace gases and aerosols are derived from January mean values from the global model for ozone and related chemical tracers simulation-4/Goddard earth observing system-5 (MOZART-4/GEOS-5).
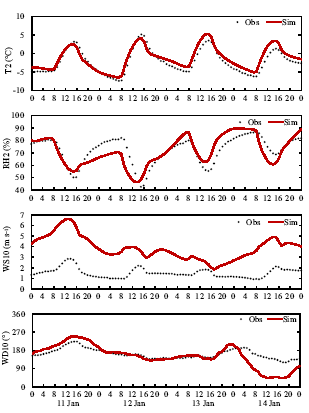
Figure 1 shows hourly variations of temperature at 2 m (T2), relative humidity at 2 m (RH2), wind speed at 10 m (WS10), and wind direction at 10 m (WD10) averaged over the heavily polluted region of (31.6-41.0°N, 112.0- 119.4°E) during the haze episode of 11-14 January 2013. WS10 varied from the highest value of 6.6 m s-1 on 11 January to the lowest value of 1.8 m s-1 on 13 January, which did not favor the diffusion of pollutants. WD10 indicated that southerlies prevailed, which transported pollutants from southern to northern China. Relative humidity during these days maintained a high level with an average value of 71.8%, facilitating heterogeneous chemical reactions. Temperature inversions were evident and the averaged PBLH was about 300 m. Wang et al. (2014) reported PBLH was approximately 200-300 m at Beijing and Xingtai on 12 January 2013. All these meteorological parameters played important roles in the formation of this haze episode.
We also present observed values of T2, RH2, WS10, and WD10 obtained from the China Meteorological Administration (CMA, http://www.cma.gov.cn/). Observed meteorological parameters are averaged over 308 sites within the region of (31.6-41.0°N, 112.0-119.4°E). The model reproduced the observations reasonably well. Simulated T2 correlated with observations with a high correlation coefficient of 0.94. Simulated RH2 captured the daily variations of relative humidity with a correlation coefficient of 0.78 and with an average low bias of -0.1%. The model overestimated WS10 with a mean bias of 2.4 m s-1. Such high biases in wind speed were reported previously for WRF-Chem ( Fast et al., 2006; Tuccella et al., 2012).
 | Figure 1 Simulated hourly variations of temperature at 2 m (T2), relative humidity at 2 m (RH2), wind speed at 10 m (WS10), and wind direction at 10 m (WD10) averaged over the heavily polluted region of (31.6-41.0°N, 112.0-119.4°E) during the haze episode of 11-14 January 2013.'>ViewDownloadNew Window | |
| ViewDownloadNew Window | ||
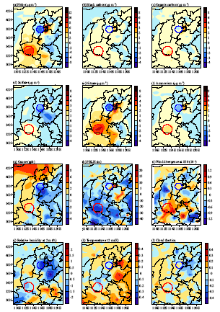
| Figure 1 Simulated hourly variations of temperature at 2 m (T2), relative humidity at 2 m (RH2), wind speed at 10 m (WS10), and wind direction at 10 m (WD10) averaged over the heavily polluted region of (31.6-41.0°N, 112.0-119.4°E) during the haze episode of 11-14 January 2013.'> | Figure 3 Simulated differences in concentrations of (a) PM2.5, (b) BC, (c) OC, (d) sulfate, (e) nitrate, (f) ammonium, (g) ozone, and also meteorological parameters of (h) PBLH, (i) wind divergence at 850 hPa, (j) RH2, (k) T2, and (l) cloud fraction between 4BC and the CTRL simulations (4BC minus CTRL). Units are indicated at the top of each panel. Simulated differences in concentrations of BC were calculated as a quarter of BC concentration in 4BC minus BC concentration in CTRL.'>ViewDownloadNew Window |
| Figure 1 Simulated hourly variations of temperature at 2 m (T2), relative humidity at 2 m (RH2), wind speed at 10 m (WS10), and wind direction at 10 m (WD10) averaged over the heavily polluted region of (31.6-41.0°N, 112.0-119.4°E) during the haze episode of 11-14 January 2013. |
Figure 2 shows the simulated surface-layer mass concentrations of BC and PM2.5 in the CTRL simulation averaged over 11-14 January 2013. High concentrations of BC and PM2.5 were distributed in northern China, including Beijing, Tianjin, Hebei Province, Henan Province, and Shandong Province. The highest concentrations of BC and PM2.5 were approximately 8-16 μg m-3 and 80-100 μg m-3, respectively. Simulated concentrations of BC in January in China in the WRF-Chem model have been evaluated previously by Zhang et al. (2009), in which it was shown that simulated BC concentrations were within the range of available measurements. Simulated PM2.5 concentrations showed low biases compared with the measurements of Wang et al. (2014), in which observed average PM2.5 concentrations in Beijing were about 250 μg m-3over 11-14 January 2013. The use of the 2006 emissions inventory for the 2013 simulation and the overestimated WS10 contributed in part to the low biases in the simulated PM2.5 concentrations ( Aksoyoglu et al., 2011; Fu et al., 2012).
| Table 1 summarizes the BC-induced changes in surface-layer concentrations of PM2.5 and each aerosol species averaged over 11-14 January for three selected domains, based on the 2BC, 3BC, and 4BC simulations. The three domains'Dom1 (Tianjin and surrounding area; black circle in Fig. 3), Dom2 (southern Hebei; blue circle in Fig. 3), and Dom3 (southern Henan; red circle in Fig. 3)'were selected because of the most significant changes in simulated aerosol concentrations. As BC concentration increased, the concentrations of all aerosol species were simulated to increase largely in Dom1, especially in the 4BC simulation. Relative to the CTRL simulation, concentrations of PM2.5, BC, OC, sulfate, nitrate, and ammonium over Dom1 were simulated in 4BC to increase by 32.3%, 33.6%, 30.0%, 19.1%, 38.7%, and 34.5%, respectively. Different from Dom1, PM2.5 and its components were simulated to decrease in Dom2 as BC concentration increased. In this domain, the 4BC simulation produced the largest reductions in concentrations of PM2.5, BC, OC, sulfate, nitrate, and ammonium aerosols, by -7.3%, -0.7%, -0.6%, -22.7%, -9.9%, and -12.4%, respectively. Over Dom3, concentrations of aerosols showed nonlinear incr-eases with increased concentrations of BC; the changes in 3BC were slightly less than 2BC, which may have been caused by the slightly different locations of maximum aerosol concentrations in these two simulations.Figure 2 Simulated surface-layer mass concentrations (μg m-3) of BC and PM2.5 in the CTRL simulation averaged over 11-14 January 2013. Table 1 Simulated black carbon (BC)-induced changes in surface-layer aerosol concentrations (μg m-3) averaged over 11-14 January 2013 for domains Dom1, Dom2, and Dom3, as defined in Fig. 3. The numbers in parentheses are percentage changes in aerosol concentrations in 2BC, 3BC, and 4BC relative to the CTRL simulation. Simulated differences in concentrations of BC were calculated as a half (third, quarter) of BC concentration in 2BC (3BC, 4BC) minus BC concentration in CTRL. |
Concentrations of all aerosol species decreased generally in Dom2, which mainly corresponded to the changes in wind, ozone, and relative humidity in 4BC relative to CTRL. Dom2 was located in the wind convergence zone in both the CTRL and 4BC simulations, and the increases in wind divergence at 850 hPa (Fig. 3i) in 4BC indicated reductions in wind convergence, leading to decreased aerosol concentrations in Dom2. Additionally, ozone decreased by about 3 ppb in Dom2, which can be explained mainly by the increased wind divergence. Such decreases in ozone reduced the oxidation of sulfur dioxide and further decreased the concentrations of sulfate aerosol ( Unger et al., 2006). The reductions in RH2 (by about 1.5%-2%) in Dom2 led to decreases in nitrate formation, which also contributed to the decreases in PM2.5 concentrations in Dom2.
Over Dom3, concentrations of all aerosol species exhibited increases in 4BC relative to CTRL, which were mainly caused by the severe reductions of 30-40 m in PBLH in this area. The warming of BC at the top of the PBL (about 300 m) increased air temperature by about 0.35 K, further enhancing temperature inversions, which caused the changes in PBLH.
In this paper, we quantify the radiative effect of BC on simulated aerosol concentrations during a severe haze event during 11-14 January 2013 in northern China using the WRF-Chem model. The simulated highest concentrations of BC and PM2.5 were about 8-16 μg m-3and 80-100 μg m-3, respectively, in the CTRL simulation as concentrations were averaged over the study period. Meteorological conditions such as weak surface wind (average value of about 3.9 m s-1 over 11-14 January), low PBLH (average value of about 300 m), high relative humidity (average value of about 71.8%) and temperature inversions played important roles in the formation of this haze episode.
We perform three sensitivity simulations, 2BC, 3BC, and 4BC, with BC emissions doubled, tripled, and quadrupled, respectively, relative to the CTRL simulation. As BC concentration increased, the concentrations of aerosols were simulated to increase largely in Dom1 and Dom3 but to decrease in Dom2, especially in 4BC. Relative to the CTRL simulation, concentrations of PM2.5 were simulated in 4BC to change by +18.6 μg m-3 (+32.3%), -5.7 μg m-3 (-7.3%), and +7.2 μg m-3 (+12.6%) in Dom1, Dom2, and Dom3, respectively. The BC-induced increases in PBLH were major factors that led to increases in aerosol concentrations over Dom1 and Dom3. The reductions in aerosol concentrations in Dom2 were complex; the reductions in wind convergence at 850 hPa had an effect of reducing concentrations of all chemical species, and the reductions in RH2 and surface-layer ozone also contributed to the reductions in sulfate and nitrate aerosol concentrations.
Simulated differences in concentrations of (a) PM2.5, (b) BC, (c) OC, (d) sulfate, (e) nitrate, (f) ammonium, (g) ozone, and also meteorological parameters of (h) PBLH, (i) wind divergence at 850 hPa, (j) RH2, (k) T2, and (l) cloud fraction between 4BC and the CTRL simulations (4BC minus CTRL). Units are indicated at the top of each panel. Simulated differences in concentrations of BC were calculated as a quarter of BC concentration in 4BC minus BC concentration in CTRL.
Acknowledgements. This work was supported by the National Basic Research Program of China (973 Program, Grant No. 2014CB441202) and the Strategic Priority Research Program of the Chinese Academy of Sciences (Grant No. XDA05100503).
| 1 |
|
| 2 |
|
| 3 |
|
| 4 |
|
| 5 |
|
| 6 |
|
| 7 |
|
| 8 |
|
| 9 |
|
| 10 |
|
| 11 |
|
| 12 |
|
| 13 |
|
| 14 |
|
| 15 |
|
| 16 |
|
| 17 |
|
| 18 |
|
| 19 |
|
| 20 |
|
| 21 |
|
| 22 |
|
| 23 |
|
| 24 |
|
| 25 |
|
| 26 |
|
| 27 |
|
| 28 |
|
| 29 |
|
| 30 |
|
| 31 |
|
| 32 |
|
| 33 |
|
| 34 |
|
| 35 |
|