

Application of a Coupled Land Surface-Hydrological Model to Flood Simulation in the Huaihe River Basin of China
[LI Min1, 2 , LIN Zhao-Hui1, 3, *  , YANG Chuan-Guo
4 , SHAO Quan-Xi5 ]
, YANG Chuan-Guo|
|


A hydrological simulation in the Huaihe River Basin (HRB) was investigated using two different models: a coupled land surface hydrological model (CLHMS), and a large-scale hydrological model (LSX-HMS). The NCEP-NCAR reanalysis dataset and observed precipitation data were used as meteorological inputs. The simulation results from both models were compared in terms of flood processes forecasting during high flow periods in the summers of 2003 and 2007, and partial high flow periods in 2000. The comparison results showed that the simulated streamflow by CLHMS model agreed well with the observations with Nash-Sutcliffe coefficients larger than 0.76, in both periods of 2000 at Lutaizi and Bengbu stations in the HRB, while the skill of the LSX-HMS model was relatively poor. The simulation results for the high flow periods in 2003 and 2007 suggested that the CLHMS model can simulate both the peak time and intensity of the hydrological processes, while the LSX-HMS model provides a delayed flood peak. These results demonstrated the importance of considering the coupling between the land surface and hydrological module in achieving better predictions for hydrological processes, and CLHMS was proven to be a promising model for future applications in flood simulation and forecasting.
Severe floods caused by heavy precipitation have resulted in huge economic losses and casualties in China. An accurate flood forecasting and warning system, established through a hydrological or regional climate-hydro-logical coupled model could minimize flood damage. Currently, most flood predictions use hydrological models with gauge and projected grid precipitation as input forcing, limiting the flood forecast lead time ( Jasper et al., 2002; Parkes et al., 2013). High-resolution regional atmospheric models offer quantitative forecasts of precipitation and provide a potential to extend forecast lead time. Thus, efforts have focused on coupling atmospheric and hydrological models ( Anderson et al., 2002; Lin et al., 2002; Yu et al., 2006; Kotlarski et al., 2012), in order for enhancing the lead time of flood forecasts.
However, the largest source of uncertainty in flash flood forecasts comes from the improper representation of the physical processes within the hydrological model system. Conflict between complicated physical processes and simple module descriptions increases the uncertainty of the model. Furthermore, human activities such as building reservoirs, water withdrawal by industries, managing flood diversion areas, and spillways during floods make flood prediction challenging ( Yin and Li, 2001; Zhu et al., 2008).
The Huaihe River Basin (HRB), located between the Yangtze and Yellow Rivers, is the most flood-prone basin in China ( Ji, 2001). It has a drainage area of around 270000 km2. Five great flood disasters have occurred in the HRB since 1949-in 1954, 1975, 1991, 2003, and 2007-leading to tremendous economic loss. Characterizing flood disasters and determining their causes is the foundation of improving flood prediction ( Hu and Ding, 2003; Jiao et al., 2008). The HRB has complicated drainage, a wide variation of topography, multiple flood districts and dams, all of which make flood prediction more difficult.
This paper addresses hydrograph simulation in the HRB, using two different model systems: a coupled land surface-hydrological model (CLHMS), and a large-scale hydrological model (LSX-HMS). Section 2 briefly describes the models and the HRB. Section 3 compares the capability of the two models in forecasting flood processes during high flow periods and partial high flow periods, as verified against observations, and analyzes the effects of human flood diversion activities. Conclusions and discussions are presented in section 4.
The large-scale hydrological model system used in this study is LSX-HMS, which connects a coarse land surface transfer scheme, LSX ( Pollard and Thompson, 1995; Thompson and Pollard, 1997), with a fine grid Hydrological Model System (HMS) based on predicted soil moisture and surface water depth ( Yu et al., 2000, 2006). The HMS includes river routing and discharge, groundwater flow, and river vadose/groundwater exchange. The volume of groundwater in an assumed one-layer aquifer is described by the two-dimensional Boussinesq equation with Darcy鈥榮 Law representing the groundwater flow between grid cells. The flows of river water are resolved as two-dimensional diffusion waves in eight probable directions, with flowing velocity described by the Manning equation. Water fluxes between rivers and groundwater or vadose zone are calculated using Darcy鈥檚 Law. The LSX- HMS model has already been successfully transferred to and calibrated for use in the HRB, and has shown its capability in long-term water resource simulations (e.g., Yang et al., 2010; Tang et al., 2014).
To fully consider the interaction between the land surface and hydrological module, a new two-way coupling method was developed, to integrate the HMS and LSX models. This fully CLHMS has previously been described by Yang et al. (2011). The CLHMS reproduces well the observed hydrological processes, including the water balance, and the seasonal and interannual variation of the observed streamflow over the HRB ( Tang et al., 2014). Interaction between the LSM and HMS is achieved through considering the water flux between groundwater and its nearest soil layer, and the water flux is used as the lower boundary to solve Richard鈥榮 equation for soil moisture. The CLHMS was further improved by considering the spatial inhomogeneity of key hydrologic parameters such as Manning roughness and hydrologic conductivity, and incorporating a sub-grid direct surface runoff scheme.
This study focused on the simulation of floods over the HRB (Fig. 1), one of the most flood-prone basins in China. This results from the basin鈥檚 transitional climate, which varies from subtropical to warm temperate, and wet to semi-arid and arid zones, in addition to its poor drainage topography. The region is of great economic importance to China, has the highest population density in the country, and 17% of the cultivated land. Floods have been and continue to be one of the most important restricting factors for social stability and economic development in the HRB.
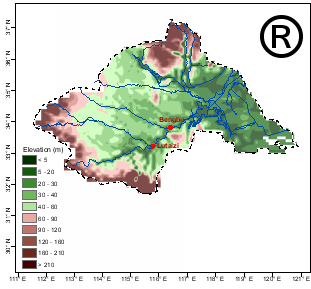 | Figure 1 Drainage boundaries and topography of the Huaihe River Basin. |
Lutaizi and Bengbu stations are located in the middle and lower reaches of the basin, with catchment areas of 88630 km2 and 132220 km2, respectively. The observed streamflows at Lutaizi and Bengbu were used to validate the LSX-HMS and CLHMS models. There are 28 flood districts in the HRB, with an area of 3903 km2 and a flood storage capacity of 149 billion m3, resulting in a potential to reduce streamflow by up to 40% during flood periods.
Parameters in the CLHMS and LSX-HMS models include soil texture, vegetation type, hydrologic parameters, hydrogeological parameters, and other model physical parameters. Soil texture and vegetation type are interpolated with the global dataset of the GENESIS (Global Environmental and Ecological Simulation of Interactive Systems) global climate model. Hydrologic parameters in the basin are developed from the USGS (U.S. Geological Survey) HYDRO1K DEM (Digital Elevation Model) with a newly developed DEM algorithm ( Yang et al., 2007). Hydrogeological parameters (aquifer thickness, hydraulic conductivity, and porosity) for each hydrologic grid are derived from the look-up table of a national 1:4000000 geological survey atlas. Other physical parameters included in the model are the Manning roughness and hydrologic conductivity, which are calibrated based on topographical and hydrogeological information for the HRB. The essential difference between the CLHMS and LSX-HMS models is the coupling strategy, as CLHMS is a fully coupled model, though other parameters related to the land surface component, including the atmospheric forcing, are kept the same during the model simulation.
Basic meteorological forcing data for the simulations come from the six-hourly NCEP-NCAR (National Centers for Environmental Prediction-National Center for Atmospheric Research) reanalysis data near the land surface, which include the surface pressure, 2-m air temperature, 2-m specific humidity, surface wind, cloud cover, infrared radiation, direct visible light, direct near infrared light, scattered visible light, and scattered near infrared light. The observed precipitation dataset is also used as a meteorological input. For the 2000 and 2003 flood simulations, data from 27 rain gauges in the HRB is used for meteorological forcing; while 167 intensive stations with rainfall observations is used for the 2007 flood simulation. The spatial resolution of both the CLHMS and LSX-HMS simulations is set to 10 km × 10 km, so all the rainfall data are interpolated to this resolution.
Because of its special geographical location, precipitation in the HRB occurs mainly in the period from mid- May to mid-October, and often causes large-scale flooding. Total annual precipitation in 2000 was 1024 mm, and floods occurred in part of the HRB during 20 May to 29 July and 17 September to 16 November. The water levels exceeded the flood warning level five times in the upper reaches of the HRB, and Bengbu Station recorded a maximum streamflow of 6120 m3 s-1 during the flood period in July 2000.
The two heavy precipitation events during the summers of 2003 and 2007 were associated with anomalies of the mei-yu front in East China. This front is strongly influenced by the western Pacific subtropical high, the South Asian monsoon, and midlatitude cold air masses, and is sustained by the large northward transport of moisture from the subtropical high region ( Ding and Chan, 2005).
The second biggest flood since 1949 occurred in 2003. It resulted in the evacuation of 152300 people and an economic loss of more than 100 million RMB. The annual total rainfall was 1282 mm, and heavy rain persisted over the HRB for 32 days from 20 June to 21 July, with a total accumulated precipitation of 200-500 mm in most of the HRB and up to 700 mm in North Anhui Province during this period. The maximum streamflow at Bengbu Station was 8370 m3 s-1, and the water level exceeded the flood warning level for about 25 days. The 2003 flood event ranked second in terms of the observed peak flow discharge since the establishment of Bengbu station. Seven flood diversion areas and two flood storage areas were used during the flood period along the mainstream of the HRB, with a storage volume of about 16 billion m3 and a flooded area of 794 km2.
Another severe event triggered by prolonged torrential rain occurred in the HRB from 18 June to 26 July 2007. This affected 20.42 million people and caused a direct economic loss of 15 billion RMB. Annual precipitation in 2007 was 1014 mm, and heavy precipitation lasted for 37 days occurring over five major periods: 18-23 June; 25-28 June; 29 June to 9 July; 12-15 July; and 18-26 July. The total accumulated precipitation was 300-600 mm in most of the HRB and up to 800 mm in upstream during 18 June to 26 July. The maximum streamflow was 7310 m3 s-1, and the water level exceeded the flood warning level for about 15 days, with a maximum of 21.33 m. A total of nine flood storage areas in the HRB were eventually used during this flood emergency period, at a cost of 30 million RMB.
To measure the performance of the CLHMS model and demonstrate its advantages over the LSX-HMS model, we focused our study on the hydrographs over the Lutaizi and Bengbu sub-basins of the HRB for the two severest flood events in 2003 (20 May to 28 August) and 2007 (17 June to 31 July), and the partial flood events in 2000 (20 May to 29 July, and 17 September to 16 November). The model skill was evaluated by the Nash-Sutcliffe coefficient of efficiency (NSI) ( Nash and Sutcliffe, 1970), defined as
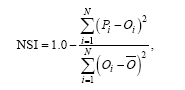 | (1) |
where, N is the total number of samples, Pi and Oi are the simulated and observed values at the ith time step, respectively, and 
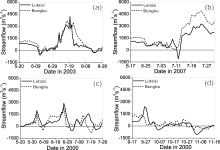
Figure 2 shows the hydrographs at the Lutaizi and Bengbu stations for the year 2000 partial floods. A very good agreement was found between the observed and CLHMS-simulated hydrographs, with higher NSI efficiency coefficients of 0.87 and 0.78 at Lutaizi station and 0.87 and 0.76 at Bengbu station in the first and second periods, respectively. However, the NSI efficiency coefficients of simulations by the LSX-HMS model were low at both Lutaizi and Bengbu stations in both periods. These results indicate the successful calibration and application of the CLHMS in the HRB. They also show the importance of considering the interaction between the land surface and hydrological module, and the variation of hydrologic parameters in sub-basins.
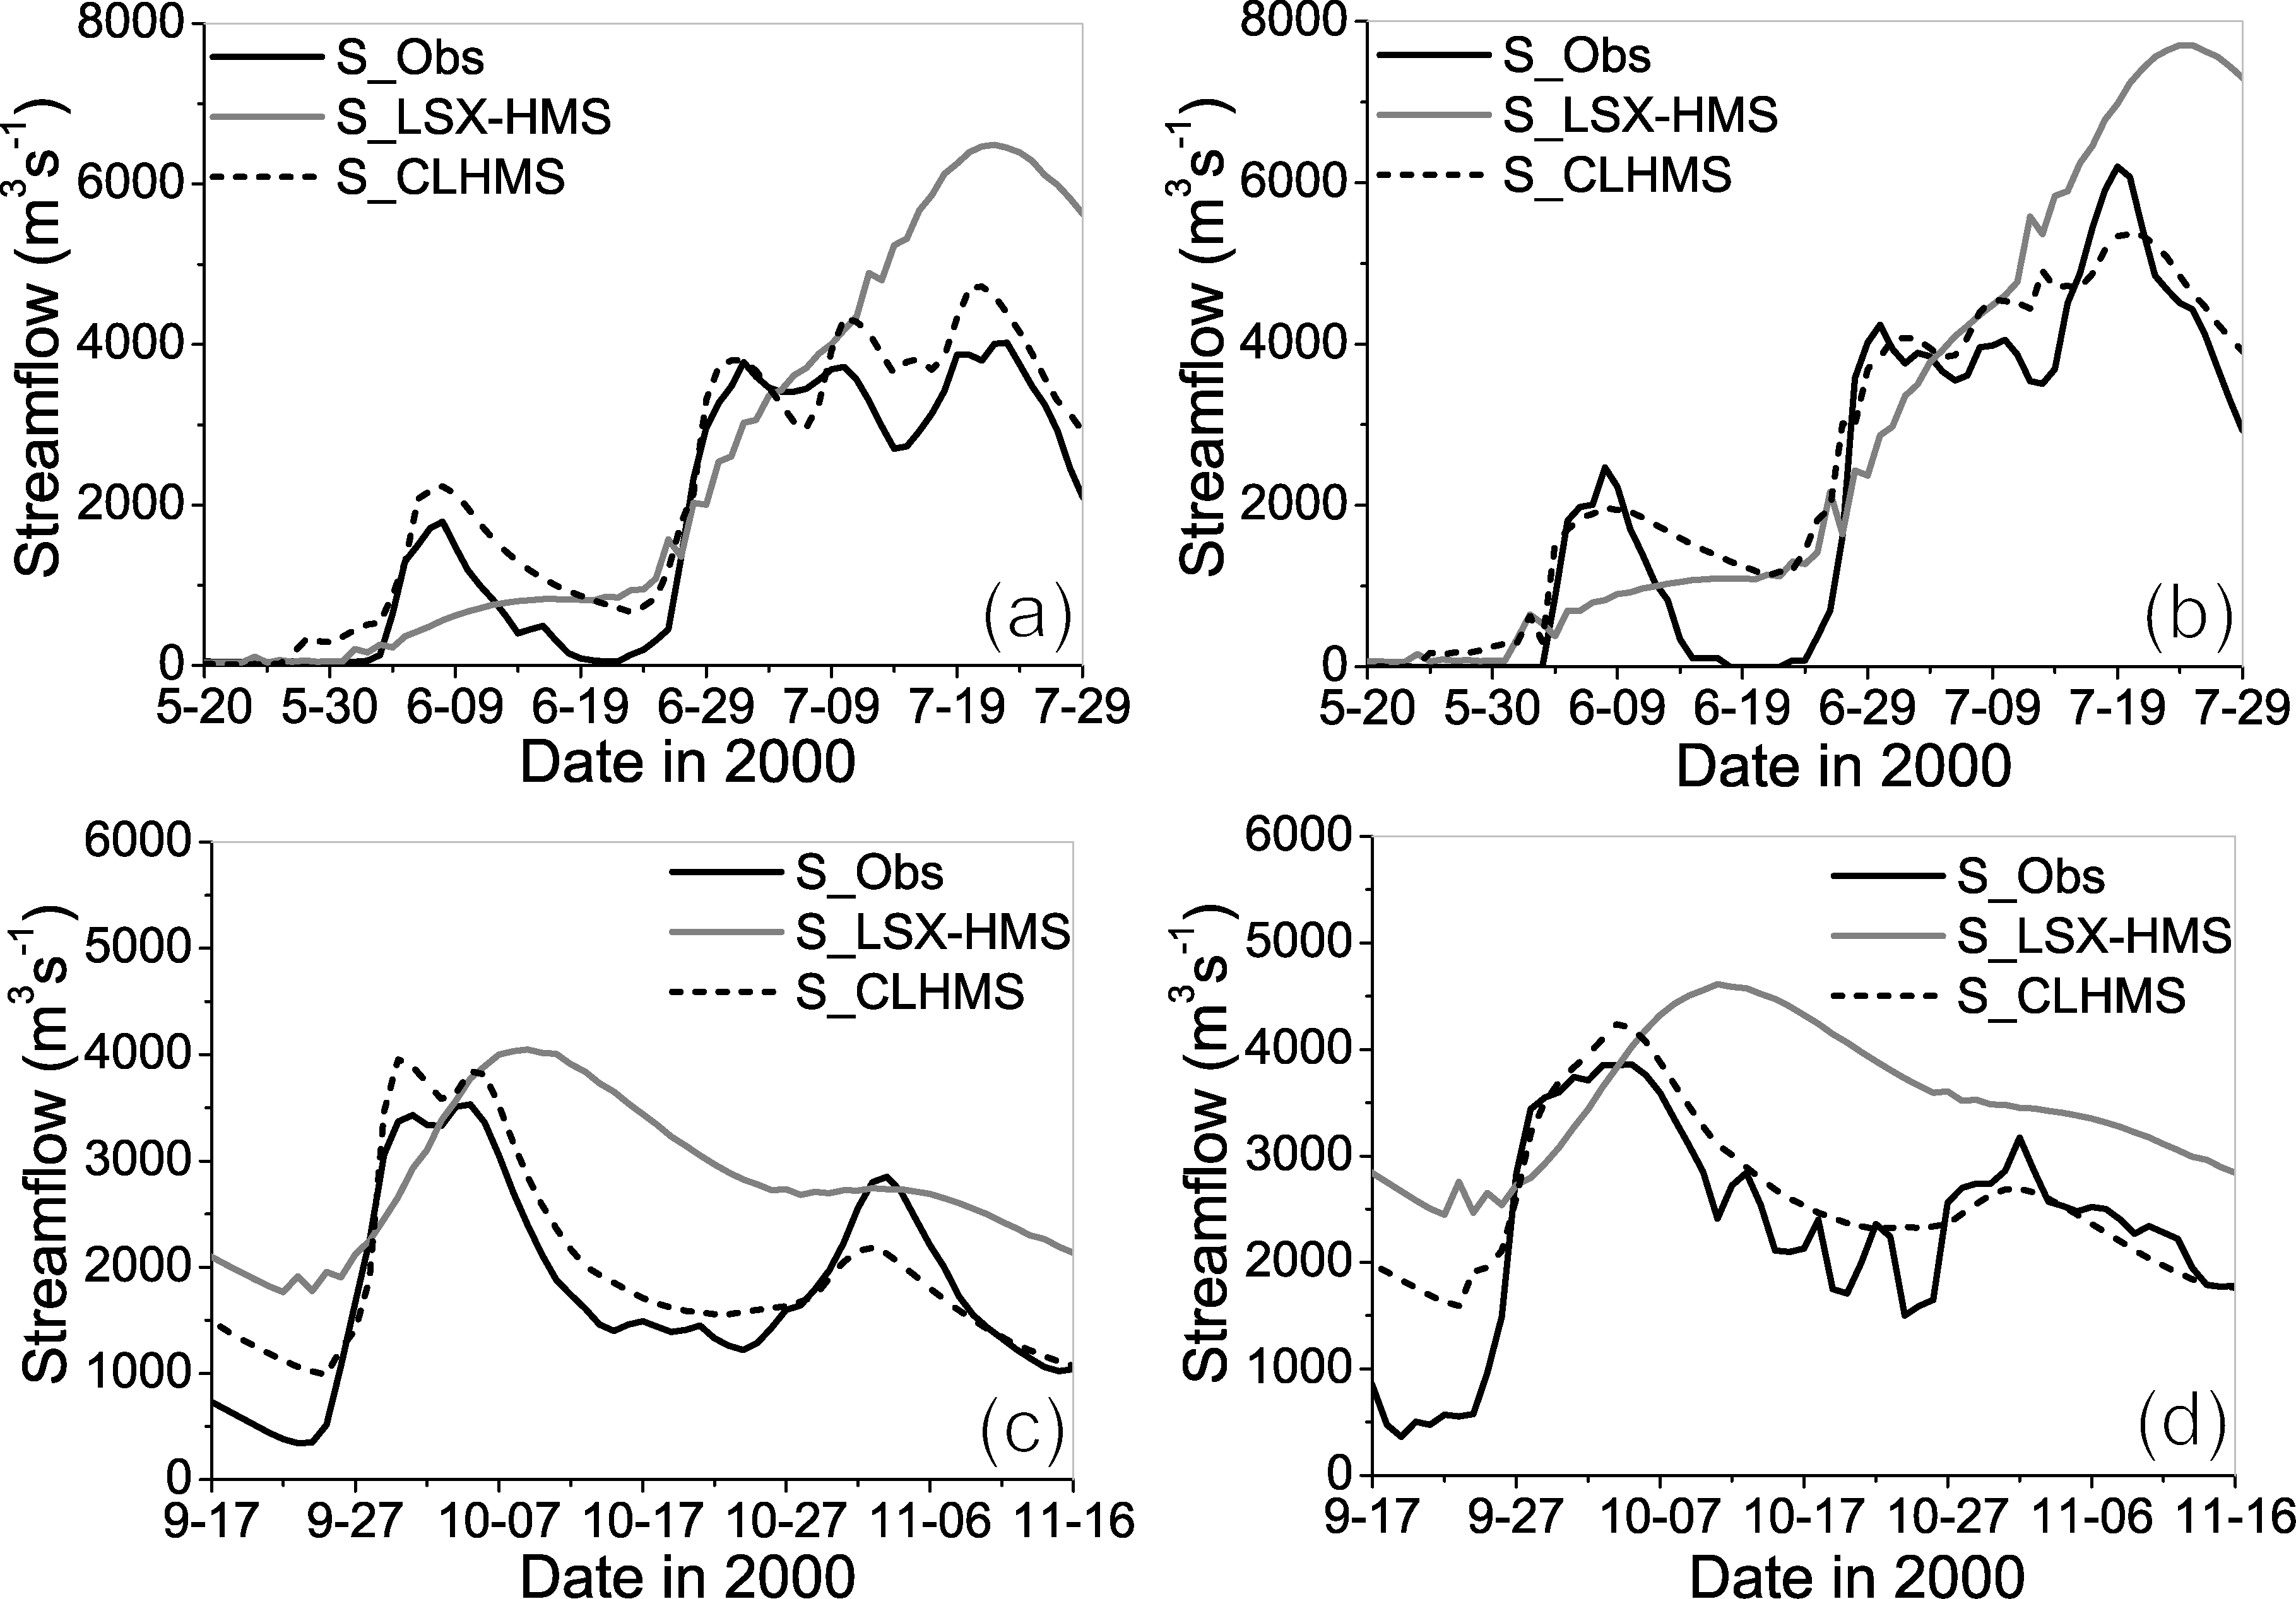 | Figure 2 Comparison of observed and simulated hydrographs in 2000: (a) Lutaizi, 20 May to 29 July; (b) Bengbu, 20 May to 29 July; (c) Lutaizi, 17 September to 16 November; (d) Bengbu, 17 September to 16 November. The black solid line represents the observation. The hydrographs simulated by LSX-HMS and CLHMS are shown as gray solid and black dashed lines, respectively. |
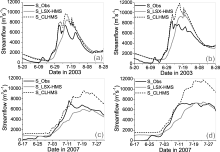
Figure 3 shows the performance of the daily hydrograph forecasts in Lutaizi and Bengbu stations over the periods of 20 May to 28 August 2003 and 17 June to 31 July 2007. It is clear that, before the first flood peaks (from 19 June to 6 July 2003 and from 3 July to 13 July 2007, respectively, at Bengbu station; and from 19 June to 5 July 2003 and 3 July to 12 July 2007 at Lutaizi station), there was good agreement between the CLHMS simulations and the observed hydrographs in terms of both peak intensity and timing, while the LSX-HMS-simulated strea-mflow underestimated the observations at both stations.
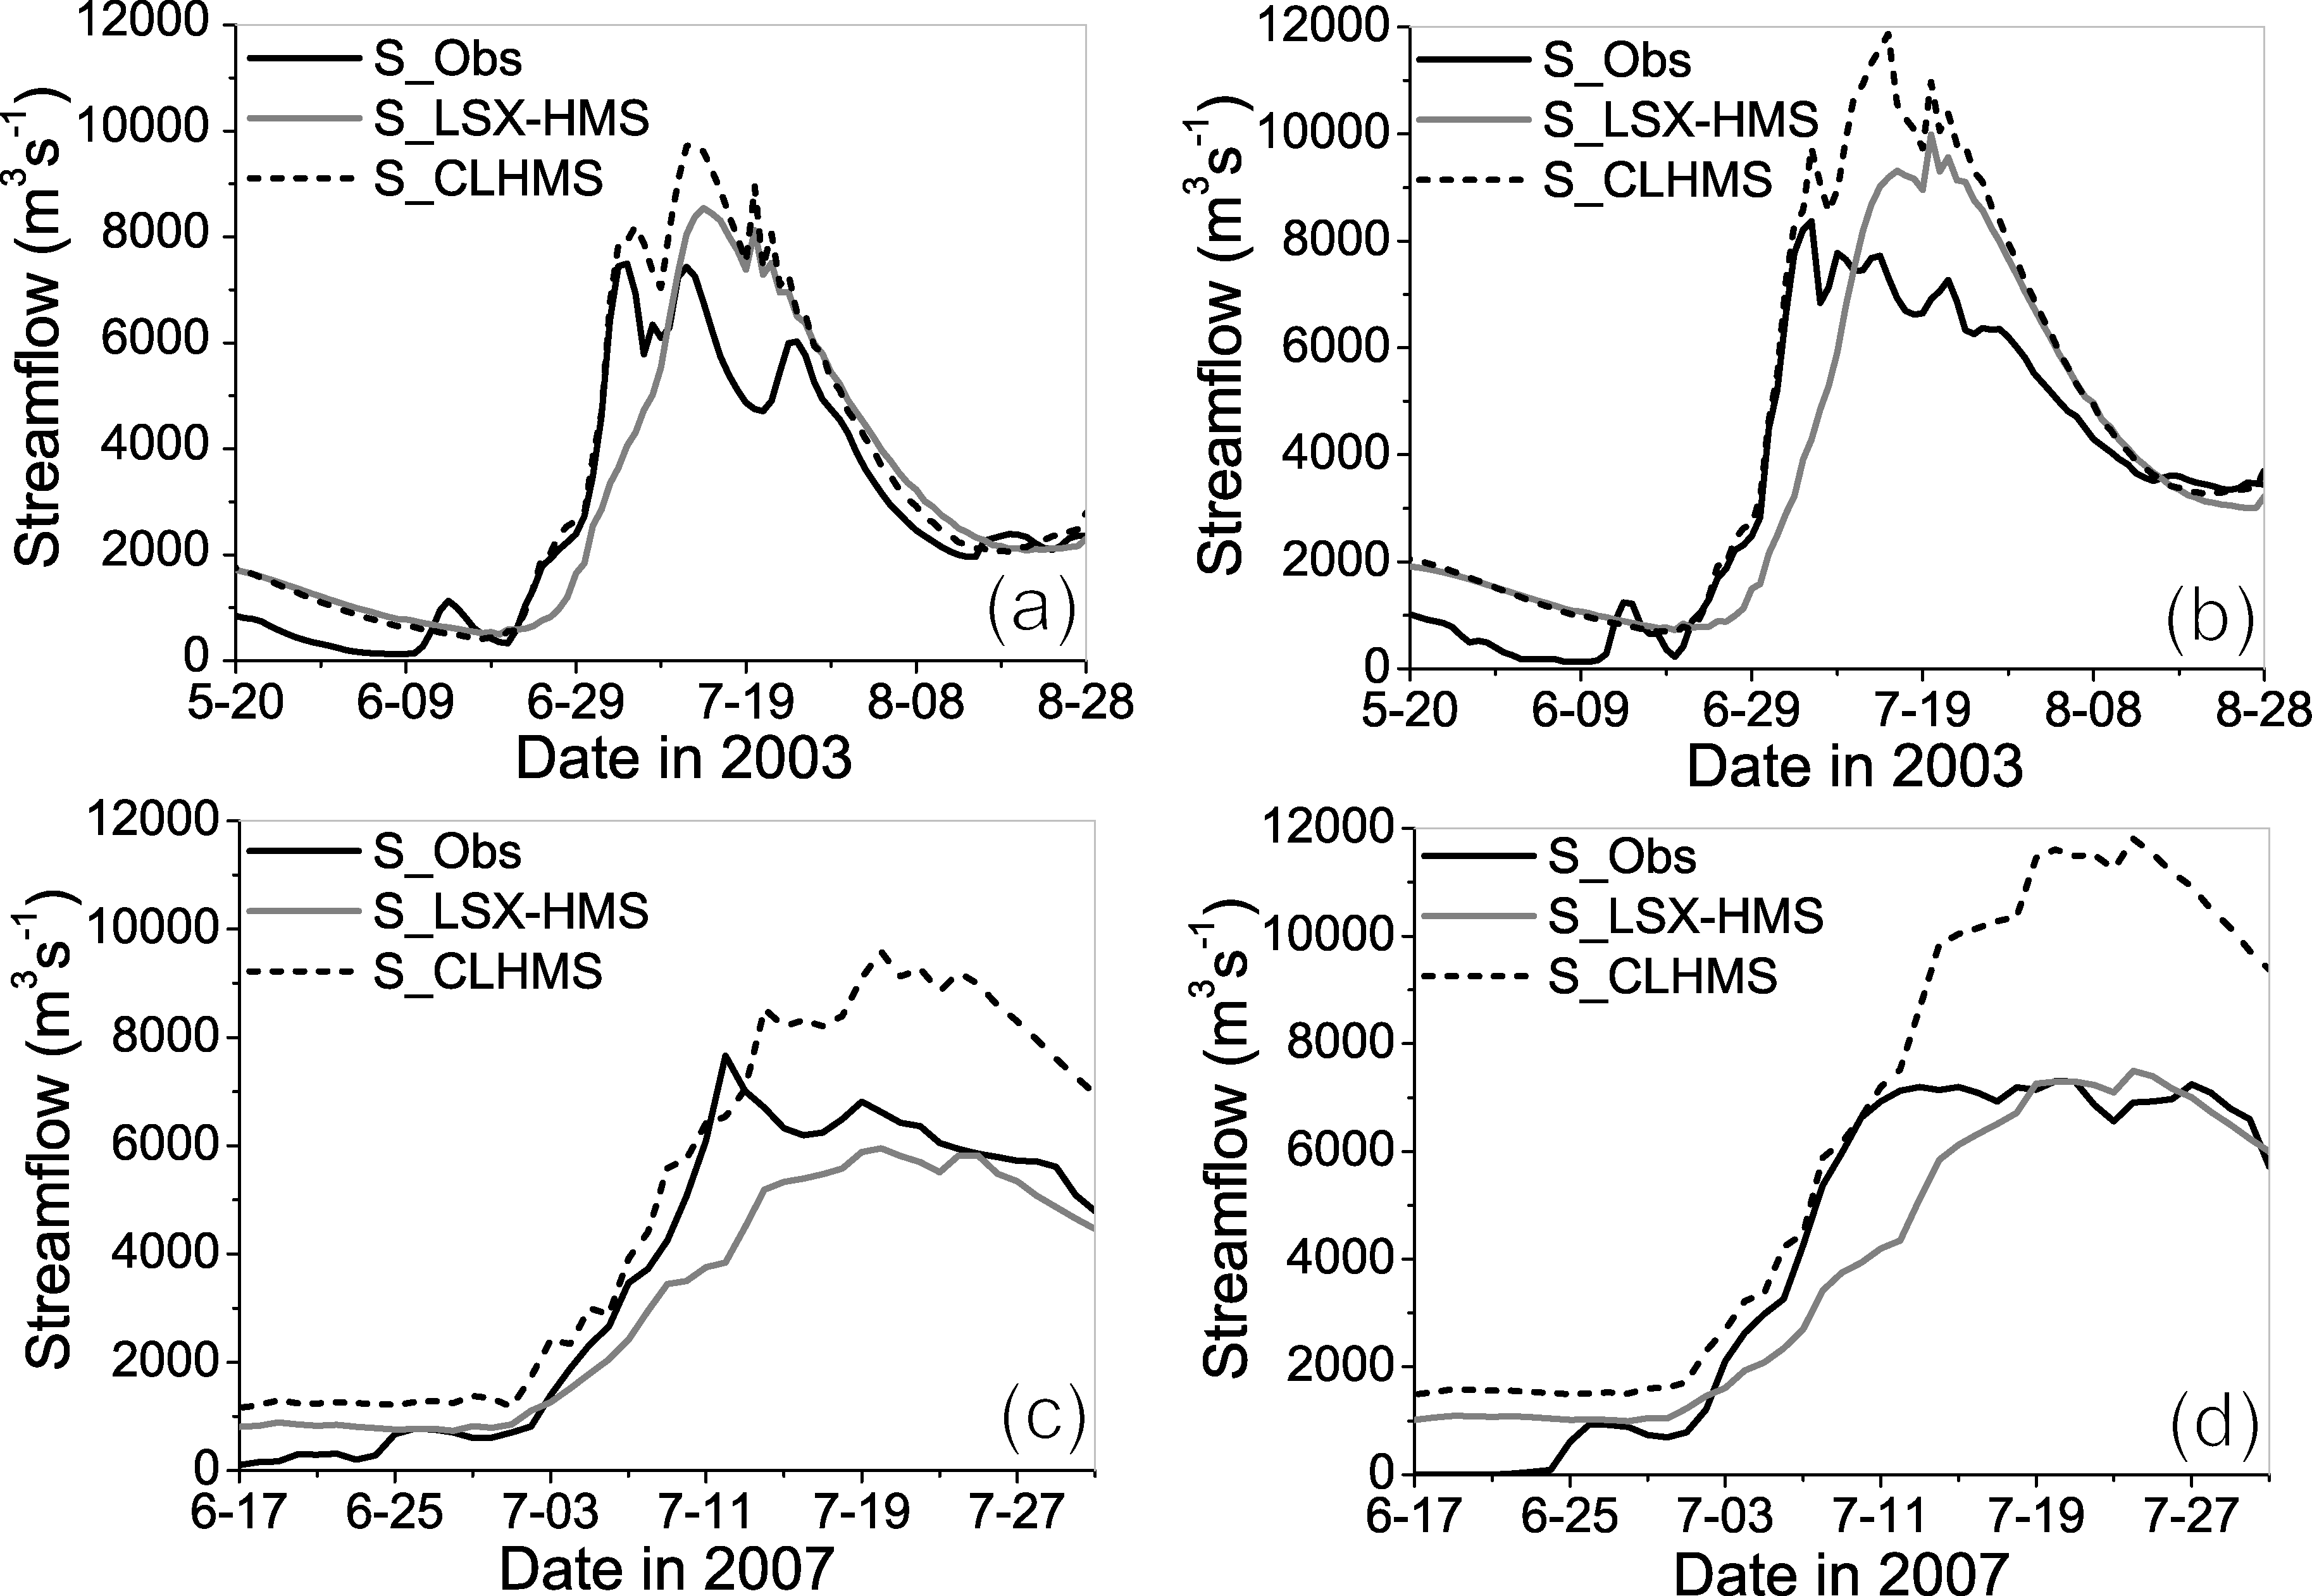 | Figure 3 Comparison of simulated and observed streamflow at (a) Lutaizi station in 2003, (b) Bengbu station in 2003, (c) Lutaizi station in 2007, and (d) Bengbu station in 2007. The observed hydrograph is shown as a black solid line. The simulated hydrographs from the LSX-HMS and CLHMS models are shown as gray solid and black dashed lines, respectively. |
Figures 3a and 3b show that the observed peak streamflow of 5 July 2003 at Lutaizi station was 7430 m3 s-1, while the CLHMS and LSX-HMS-simulated peaks were 7920 m3 s-1 and 4055 m3 s-1, respectively. The peak strea-mflow of 6 July 2003 at Bengbu station was 8370 m3 s-1, while the CLHMS simulated peak was 9744 m3 s-1 and the LSX-HMS simulated peak was 4287 m3 s-1. During the recession period, both the CLHMS and LSX-HMS models overestimated the observed streamflow at Lutaizi and Bengbu stations, mainly because of the use of flood storage and discharge areas during 3-11 July, which caused the observed discharges to be smaller than the natural values at both stations. According to the annual water regime reports of 2003 from The Ministry of Water Resources, the observed streamflows at Lutaizi and Bengbu stations were reduced by about 20%-40% because two flood storage areas, seven flood discharge areas, and many reservoirs were used during the flood period, and none of these activities is accounted for in either CLHMS or LSX-HMS. Thus, biases occurred in CLHMS and LSX-HMS, with a Nash-Sutcliffe coefficient of only 0.73 and 0.71, respectively.
The hydrograph forecasts of 17 June to 31 July 2007 are provided in Figs. 3c and 3d. The observed flood peaks were well predicted in both timing and intensity by CLHMS, while the flood was underestimated by LSX-HMS at Lutaizi and Bengbu stations before the first flood peak. The observed, CLHMS, and LSX-HMS simulated peak streamflows on 11 July were 6930 m3 s-1, 7197 m3 s-1, with a bias of about 3.8%, and 4200 m3 s-1, with an underestimation of nearly 40%, respectively. During the high flood period, both CLHMS and LSX-HMS overestimated the observed streamflow. Such overestimation was again due to human activities, in this case the use of nine flood discharge and storage areas from 10 July onwards. The inclusion of human activities should be a focus for future model improvement.
To reveal the influence of human activities on streamflow simulations during the flooding period, the differences between the CLHMS simulations and the observed streamflows in the heavy flooding periods in 2003 and 2007 and the two partial flood periods in 2000 are depicted in Figs. 4a-d.
Figure 4a clearly shows that the difference in streamflow between the simulated and observed values had a sudden peak at Lutaizi station on 3 July 2003, consistent with the opening of Mengwa Storage district, which has a maximum flood discharge of 1460 m3 s-1, the Cihuaixin River (maximum flood discharge 1500 m3 s-1), and the utilization of reservoirs such as Nianyushan, Meishan, Xianghongdian, Suyahu and so on. The opening of flood storage and discharge areas started on 11 July 2003, and the second peak in the streamflow difference occurred on the same day. During this whole flood period, the simulated water storage was larger than that observed (approximately 0.38 billion m3) in the upstream of Bengbu station, in good agreement with the observed water storage of 0.28 billion m3 by flood districts and 0.2 billion m3 by reservoirs.
 | Figure 4 Differences between CLHMS-simulated streamflows and observations in (a) 2003, (b) 2007, (c) 20 May to 29 July 2000, and (d) 17 September to 16 November 2000. Differences for Lutaizi and Bengbu stations are shown as solid and dashed lines, respectively. |
Figure 4b shows that the peak difference of streamflow between simulated and observed values occurred at Lutaizi station on 10 July 2007, which is consistent with the opening of Nanrunduan, Qiujiahu, Jiangtanghu, Shang/ Xialiudifang, and Shiyaoduan storage districts (total water storage of approximately 0.66 billion m3) and the utilization of reservoirs (total water storage of approximately 0.65 billion m3) during this period. During the whole flood period, the simulated water storage was larger than that observed (approximately 0.31 billion m3) in the upstream of Bengbu station (0.1475 billion m3, from flood districts). Due to the lack of reservoir data in 2007, their influence could not be quantified.
The results also suggested that, during heavy flood years, the differences at Lutaizi station are smaller than at Bengbu station, but are similar at Bengbu station in partial flood years; and also that the differences in flood years are larger than those in partial flood years. This is strong evidence for the influence of human activities on simu-lated hydrographs, which should be further considered in order to improve the precision of future models.
CLHMS, with a full land surface and hydrological model coupling, was applied to flood simulation in the HRB. Comparisons with LSX-HMS were made for flood forecasting in the heavy flood period of 2003 (20 May to 28 August) and 2007 (17 June to 31 July), and two partial flood periods in 2000 (20 May to 29 July, and 17 September to 16 November). The simulated hydrographs at Lutaizi and Bengbu stations were also compared to observations.
These promising results have a Nash-Sutcliffe coefficient of at least 0.76 for both periods in 2000 and are in good agreement in terms of the simulated peak streamflow and timing by CLHMS at Lutaizi and Bengbu stations in 2003 and 2007. This indicates that the CLHMS model is properly calibrated and performs well over the HRB, while the LSX-HMS shows an underestimation of the observed peak value and timing for the same periods. The findings also support the assertion that the CLHMS model improves hydrograph simulations by considering the interaction between the land surface and hydrological modules and the variation of hydrologic parameters in sub- basins. However, both models overestimate the observed streamflow during the use of flood discharge and storage areas along the mainstream of the Huaihe River during flood periods, so the inclusion of human activity should be a focus of future model improvement. These findings are encouraging and indicate that the CLHMS model is a promising tool for flood forecasting in Huaihe River Basin.
Acknowledgements. This research was jointly supported by the Strategic Priority Research Program of the Chinese Academy of Sciences (Grant No. XDA05110202) and the National Natural Science Foundation of China (Grant Nos. 41175073, 41471016, and U1133603). The authors would like to acknowledge the China Meteorological Administration for observed precipitation data and the Ministry of Water Resources for flood districts data.
| 1 |
|
| 2 |
|
| 3 |
|
| 4 |
|
| 5 |
|
| 6 |
|
| 7 |
|
| 8 |
|
| 9 |
|
| 10 |
|
| 11 |
|
| 12 |
|
| 13 |
|
| 14 |
|
| 15 |
|
| 16 |
|
| 17 |
|
| 18 |
|
| 19 |
|
| 20 |
|