
Statistical Characteristics of ENSO Events in CMIP5 Models
[RAO Jian1, 2 , REN Rong-Cai1, *  ]
]
]
|
|


By applying the historical-run outputs from 24 Coupled Model Intercomparison Project Phase 5 (CMIP5) models and the NOAA Extended Reconstructed SST V3b dataset (ERSST), the characteristics of different types of ENSO in the selected CMIP5 models, including cold-season-matured Eastern Pacific (C-EP) ENSO, warm- season-matured EP (W-EP) ENSO, cold-season-matured Central Pacific (C-CP) ENSO, and warm-season-matured CP (W-CP) ENSO, were examined in comparison with those in the ERSST dataset. The results showed that, in general, consistent with observations, EP ENSO events in most of the model runs were relatively much stronger than CP ENSO events, and cold-season-matured ENSO events were relatively much more frequent than warm-season-matured ENSO events for both EP and CP ENSO events. The composite amplitudes of ENSO events in most of the models were generally weaker than in observations, particularly for EP El Niño and CP La Niña. Moreover, most of the models successfully reproduced the amplitude asymmetries between El Niño and La Niña for cold-season-matured EP and CP ENSO events, exhibiting an average stronger/weaker EP El Niño/La Niña regime and a weaker/stronger CP El Niño/La Niña regime. Most of the models, however, failed to reproduce the observed regimes of stronger/weaker W-EP El Niño/ La Niña and weaker/stronger W-CP El Niño/La Niña.
It has been increasingly recognized in recent years that two different types of ENSO occur in the tropical Pacific ( Ashok et al., 2007; Kao and Yu, 2009): the eastern Pacific (EP) type, with SST anomalies centered over the eastern tropical Pacific cold tongue region, and the central Pacific (CP) type, with SST anomalies near the international date line ( Yu and Kao, 2007; Kao and Yu, 2009). In the literature, CP El Niño ( Yeh et al., 2009) has also been referred to as Date Line El Niño ( Larkin and Harrison, 2005), El Niño Modoki ( Ashok et al., 2007), or Warm Pool El Niño ( Kug et al., 2009). Given the lack of consensus regarding the terminology used to refer to this new type of El Niño, the terms CP ENSO and EP ENSO will be used to refer to the two types of ENSO events in this study.
The influences of ENSO events on regional circulation and climate, such as Hadley circulation ( Yu and Kim, 2010; Feng and Li, 2013), Walker circulation ( Ashok et al., 2007; Weng et al., 2007, 2009; Taschetto and England, 2009; Feng and Li, 2011; Zhang et al., 2011), regional rainfall ( Taschetto and England, 2009; Cai and Cowan, 2010; Zhang et al., 2011; Feng et al., 2010; Feng and Li, 2011; Karori et al., 2013), and the tropical tropopause and stratosphere ( Zubiaurre and Calvo, 2012; Xie et al., 2012), can be distinctly different between EP and CP ENSO events. Moreover, the two types of ENSO differ not only in their location of maximum SST anomalies (SSTAs), but also in their tropical-midlatitude teleconnection patterns ( Zubiaurre and Calvo, 2012; Zhang et al., 2012; Li et al., 2013). It is widely documented that ENSO generally peaks in boreal winter, which is usually referred to as seasonal phase locking in the literature (e.g., Neelin et al., 1999 and references therein). However, observations indicate that there are also ENSO events that peak in warm seasons, such as the 1987/1988 EP El Niño. The existence of the two types of ENSO has been considered in several studies that evaluated the simulation of ENSO events in Coupled Model Intercomparison Project Phase 5 (CMIP5) models, in which the intensity, ratio, and frequency of EP and CP ENSO events have been examined ( Kim and Yu, 2012; Yang and Giese, 2013). However, evaluation of the temporal evolution of ENSO events by considering the seasonality of ENSO peak phases in CMIP5 models is lacking in the literature, and so we made this the main focus of the present reported study. Our aim is to facilitate further understanding of the complexity and characteristics of the two types of ENSO and to provide information that can be used for model improvements.
The organization of the text is as follows. Section 2 introduces the CMIP5 models employed and the methods used. Section 3 describes the temporal evolution of ENSO events. Frequencies of ENSO events in CMIP5 models are evaluated in section 4. Section 5 concerns the asymmetry and intensity of ENSO events. Section 6 provides a summary and discussion.
| Table 1 The selected Coupled Model Intercomparison Project Phase 5 (CMIP5) models and their attributes. |
The historical runs from 24 CMIP5 models (Table 1) were used, which cover much of the industrial period (from the mid nineteenth century to near present, i.e., 1850-2005, sometimes referred to as "twentieth century" simulations) ( Taylor et al., 2012). Apart from GFDL-CM3 and HadCM3, almost all the available CMIP5 models provided historical data from 1850 to 2005. NOAA Extended Reconstructed SST (ERSST) V3b data ( Smith and Reynolds, 2003, 2004) were used as the reference for our evaluation.
Niño3 index (see details at http://www.cpc.ncep.noaa. gov/data/indices/) and ENSO Modoki index (EMI) ( Ashok et al., 2007) were selected to respectively represent the temporal evolution of EP and CP ENSO. Given the impacts of global warming, the SSTA trend was removed. An ENSO event was identified when the selected index was either above 0.5 or below -0.5 times its standard deviation. In either observations or the CMIP5 historical runs, most EP ENSO events peaked in the cold season, albeit with some exceptions. To make the distinction, EP ENSO events were sub-classified into two types based on their maturing season: one type with their peak phase in the cold season (cold-season-matured EP ENSO, C-EP ENSO hereafter), and the other with their peak phase in the warm season (warm-season-matured EP ENSO, W-EP ENSO hereafter). Similarly, CP ENSO events were also sub-classified into cold-season-matured CP ENSO (C-CP ENSO) and warm-season-matured CP ENSO (W-CP ENSO). An ENSO event was regarded as a warm-sea-son-matured (cold-season-matured) event if its peak fell in the period May-September (November-March).
Before examining the frequency of ENSO events, the composite evolutions of EP and CP ENSO events are displayed in Fig. 1 for the historical simulations and observations. The results show that the cold-season-matured (C-EP and C-CP) ENSO events reached their peaks in November-January, while warm-season-matured (W-EP and W-CP) ENSO events reached their peaks in June- August. Generally, the composite cold-season-matured ENSO events initiated after the previous summer and dissipated in the following summer. The composite warm-season-matured ENSO events seemed to persist longer than the cold-season-matured ones. The composite warm-season-matured ENSO events began to develop in winter and could still be active in the following winter. It can also be seen that the amplitudes of the EP ENSO peaks in both the models and observations were clearly much stronger than those of the CP ENSO.
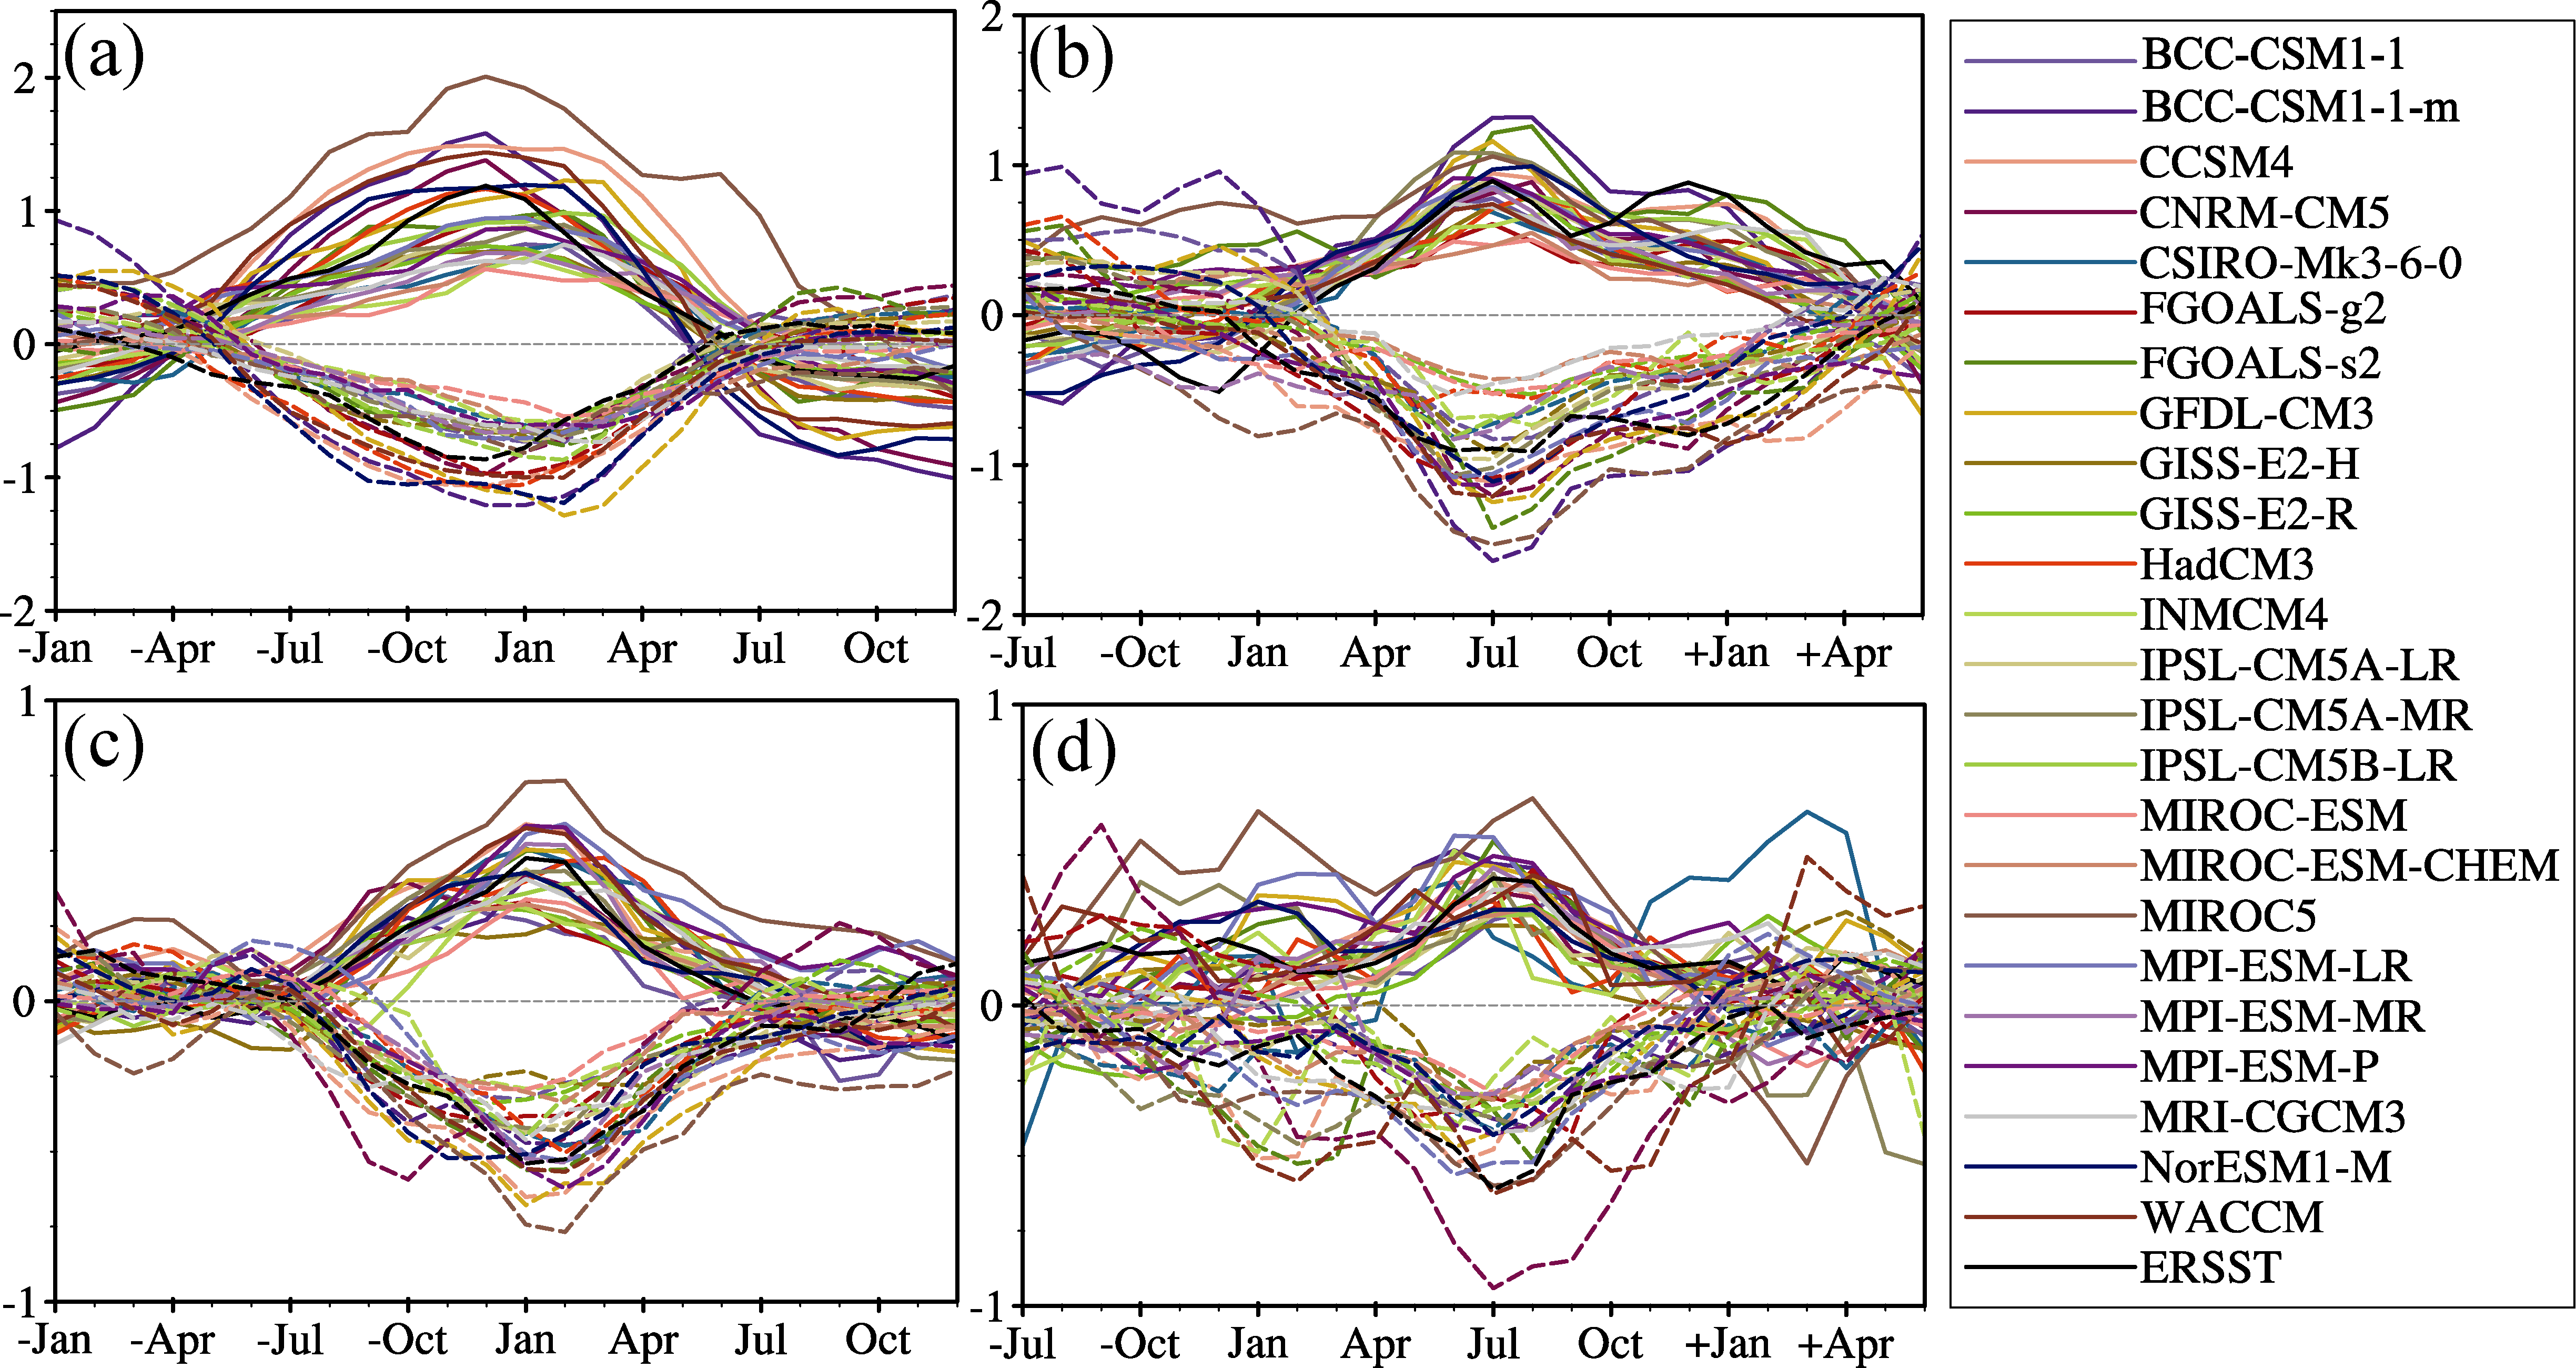 | Figure 1 Composite seasonal evolutions of (a) C-EP ENSO, (b) W-EP ENSO, (c) C-CP ENSO, and (d) W-CP ENSO in each model and in observations. The Niño3 indices in (a, b) were defined as the area-mean SST anomalies in the Niño3 region (5°S-5°N, 150-90°W), and the ENSO Modoki indices (EMI) ( Ashok et al., 2007) were used in (c, d). The solid lines are for El Niño and the dashed lines for La Niña. Positive (negative) signs before months denote the year after (before) ENSO matured. |
Based on our classification of ENSO events outlined in section 2, we compared the ENSO frequency between the CMIP5 simulations and NOAA ERSST data (Table 2). In general, more than half of the available CMIP5 models did not show statistically significant differences from observations in reproducing C-EP ENSO frequency. On average, there were 1.7 C-EP El Niño events and 1.7 C-EP La Niña events per decade in observations, which was reproduced well in BCC-CSM1-1-m, CCSM4, FGOALS- g2, FGOALS-s2, GFDL-CM3, HadCM3, IPSL-CM5B- LR, MRI-CGCM3, NorESM1-M, and WACCM, as well as in the model ensemble. As for W-EP ENSO, there were on average 0.2 W-EP El Niño and 0.8 W-EP La Niña events per decade in observations. In most (23 out of 24) models, and the model ensemble, the W-EP El Niño events appeared more frequently than in observations, while the frequency of W-EP La Niña events in some models (e.g., BCC-CSM1-1, BCC-CSM1-1-m, CCSM4, CNRM-CM5, CSIRO-Mk3.6.0, FGOALS-s2, GISS-E2-H, INMCM4, IPSL-CM5B-LR, MPI-ESM-LR, MPI-ESM- MR, MPI-ESM-P, NorESM1-M, and WACCM), as well as in the model ensemble, was found to be close to that in observations. Consistent with observations, the frequency of C-EP ENSO in more than half (17 out of 24) of the models, as well as in the model ensemble, tended to be double that of W-EP ENSO, manifesting the fact that EP El Niño events are more likely to mature in the cold season.
The C-CP ENSO events exhibited a similar frequency (1.7/1.3 El Niño/La Niña events per decade) to C-EP ENSO events (1.7/1.7 El Niño/La Niña events per decade) in observations. The C-CP ENSO events in about half of the models, and in the model ensemble, appeared slightly more frequently than in observations. As in observations, the number of C-CP ENSO events in the CMIP5 historical simulations was comparable to that of the C-EP ENSO events. This verifies the recent results of Karnauskas (2013), who suggested that all observed ENSO events are a mixture of locally-forced (central Pacific) and remotely- forced (eastern Pacific) SSTAs, and it is unlikely that CP ENSO is a new phenomenon. Further, the frequency of W-CP ENSO was much lower than that of C-CP ENSO in most of the models, which was again consistent with observations. The frequency of W-CP ENSO events in nine models (CCSM4, CSIRO-Mk3.6.0, FGOALS-g2, GISS- E2-H, GISS-E2-R, HadCM3, INMCM4, IPSL- CM5A-MR, and WACCM) was significantly lower than that in observations.
From the results presented in Table 2, we can conclude that most of the models can successfully reproduce the relatively higher/lower frequency of cold-season-matured/ warm-season-matured ENSO events. However, C-CP ENSO events, as well as W-EP El Niño events, in the model ensemble were relatively more frequent, while W-CP and C-EP ENSO events were relatively less frequent than in observations.
| Table 2 Occurrence numbers and frequencies of El Niño and La Niña in each model and observations. Bold values indicate that the number or frequency is significantly different from observations at the 90% confidence level. The model data cover 1850/1860-2005, while the observation data Extended Reconstructed SST (ERSST) are from 1854 to 2009. |
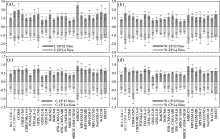
Figure 2 presents the composite intensity of El Niño and La Niña for each model and ERSST. The composite intensity of C-EP El Niño/La Niña in 17 out of 24 models was weaker than in observations (El Niño: 1 K in some models, but 1.5 K in ERSST; La Niña: -0.6 K in some models, but -1.2 K in ERSST). The composite peak amplitude of the observational W-EP ENSO events (Fig. 2b) was comparable to that of C-EP ENSO events (Fig. 2a). The composite intensity of W-EP ENSO in more than half of the models was also weaker than in observations (Fig. 2b). The composite intensity of C-CP and W-CP ENSO events in more than half of the evaluated models was also weaker than in observations (El Niño: approximately 0.5 K in some models, but 0.6 K in ERSST; La Niña: approximately -0.5 K in some models, but -0.7 K in ERSST). Comparing CP and EP ENSO events, the composite peak amplitudes of CP ENSO events (Figs. 2c and 2d) were much smaller than those of EP ENSO events (Figs. 2a and 2b) in observations, which could be successfully reproduced by the historical simulations.
 | Figure 2 Composite intensity of El Niño and La Niña for (a) C-EP ENSO, (b) W-EP ENSO, (c) C-CP ENSO, and (d) W-CP ENSO in each CMIP5 model and ERSST. The gray dashed lines show the composite results of ERSST. The vertical bars represent the intensity standard deviation for the selected El Niños and La Niñas in each model or ERSST. |
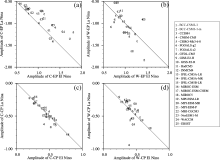
Figure 3 shows the distribution of composite El Niñopeak amplitudes versus La Niña peak amplitudes. An asymmetry of the composite peak amplitudes between EP El Niño and EP La Niña was evident (Figs. 3a and 3b). Specifically, the composite peak amplitude of C-EP El Niño was larger than that of C-EP La Niña in observations, which was successfully reproduced by most of the models (Fig. 3a). However, the larger/smaller composite peak amplitudes of W-EP El Niño/La Niña in observations were not reproduced well in most of the models, which showed relatively larger/smaller W-EP La Niña/El Niño features (Fig. 3b). In addition, the composite intensities of EP El Niño and EP La Niña in most of the models were weaker than in observations (Figs. 3a and 3b), which was consistent with the results presented in Figs. 2a and 2b. In contrast to the asymmetries of EP ENSO events, the composite peak amplitude of CP La Niña was slightly larger than that of CP El Niño in observations. Most of the models successfully reproduced the amplitude asymmetries between C-CP El Niño and La Niña, exhibiting a weaker/stronger composite C-CP El Niño/La Niña regime. However, W-CP ENSO in most of the models was bias to the upper right regime (Fig. 3d), indicating a stronger/weaker composite W-CP El Niño/La Niña regime that was contrary to observations. The composite intensities of CP El Niño, especially that of CP La Niña, in most of the models were also reproduced weaker than in observations (Figs. 3c and 3d), which was again consist with the results presented in Figs. 2c and 2d. In short, most of the models successfully captured the observed intensity asymmetries of the cold-season-matured (C-EP and C-CP) ENSO events, with an average stronger/weaker C-EP El Niño/La Niña regime and a weaker/stronger C-CP El Niño/La Niña regime. The capacity to simulate the observed intensity asymmetries of warm-season-matured (W-EP and W-CP) ENSO events remains to be improved.
 | Figure 3 Composite El Niño peak amplitude versus La Niña peak amplitude for (a) C-EP ENSO, (b) W-EP ENSO, (c) C-CP ENSO, and (d) W-CP ENSO in each model and in observations. |
Using historical-run simulation data from 24 CMIP5 models, several aspects of statistical characteristics for four types of ENSO (i.e., C-EP, W-EP, C-CP, and W-CP) classified by their positions of maximum SSTAs and mature seasons were systematically evaluated. From the perspective of ENSO frequency, 1.7 C-EP El Niños and 1.7 C-EP La Niñas, 0.2 W-EP El Niño and 0.8 W-EP La Niña, 1.7 C-CP El Niños and 1.3 C-CP La Niñas, and 0.7 W-CP El Niño and 0.6 W-CP La Niña were found to occur and develop in one decade in observations, respectively. Cold-season-matured ENSO events were found to take place much more often than warm-season-matured ENSO events, and are undoubtedly the main type of ENSO not only in observations, but also in the models' simulations. Nevertheless, some deficiencies still remain in the models' representations. For example, the model ensemble reproduced less C-EP ENSO events, more W-EP El Niños, more C-CP ENSO events, and less W-CP ENSO events than observed.
In terms of ENSO intensity, consistent with observations, the mean peak amplitudes of C-EP ENSO and W-EP ENSO in most of the models were found to reach above 1 K. The mean peak amplitudes of C-CP ENSO and W-CP ENSO in some of the models and observations could also reach above 0.6 K (Fig. 2). However, the composite intensity of EP ENSO (especially EP El Niño) in most of the models was reproduced weaker than that in observations (El Niño: 1 K in some models, but 1.5 K in ERSST; La Niña: -0.6 K in some models, but -1.2 K in ERSST). The composite intensity of CP ENSO (especially CP La Niña) in most of the models was also reproduced weaker than that in observations (El Niño: approximately 0.5 K in some models, but 0.6 K in ERSST; La Niña: approximately -0.5 K in some models, but -0.7 K in ERSST). EP and CP ENSO events were found to be characterized by amplitude asymmetries between El Niño and La Niña in observations, exhibiting stronger/weaker composite EP El Niño/La Niña regimes and weaker/ stronger composite CP El Niño/La Niña regimes. Most of the models successfully reproduced the asymmetry of cold-season-matured (C-EP and C-CP) ENSO events, but failed to reproduce the asymmetry of warm-season- matured (W-EP and W-CP) ENSO events.
The underestimated intensity and asymmetry of EP ENSO events in some CMIP5 models may be due to the biased precipitation response over Pacific, which is closely linked to the western shift of convection ( Kang and Kug, 2002) in models. A western shift of zonal mean zonal wind stress, especially during EP El Niño may result in a weaker EP event. Watanabe et al. (2011) and Kim et al. (2011) showed that parameter changes in the cumulus parameterization shifts the position of convection, and therefore the position of zonal wind stress, resulting in a more realistic EP El Niño. Due to the limited scope of this paper, the reasons for the underestimated CP ENSO intensity in these CMIP5 models is still not clear and needs to be further elucidated. Further investigations are also required concerning the detailed physics and climate effects of warm-season-matured ENSOs.
Acknowledgements. This work was jointly supported by the National Basic Research Program of China (Grant Nos. 2010CB950400 and 2010CB428603). The authors thank the anonymous reviewers for their helpful comments and suggestions. We acknowledge the World Climate Research Program’s Working Group on Coupled Modelling, which is responsible for CMIP.
| 1 |
|
| 2 |
|
| 3 |
|
| 4 |
|
| 5 |
|
| 6 |
|
| 7 |
|
| 8 |
|
| 9 |
|
| 10 |
|
| 11 |
|
| 12 |
|
| 13 |
|
| 14 |
|
| 15 |
|
| 16 |
|
| 17 |
|
| 18 |
|
| 19 |
|
| 20 |
|
| 21 |
|
| 22 |
|
| 23 |
|
| 24 |
|
| 25 |
|
| 26 |
|
| 27 |
|
| 28 |
|
| 29 |
|
| 30 |
|
| 31 |
|