Updated Homogenized Chinese Temperature Series with Physical Consistency
[LI Zhen1 , YAN Zhong-Wei1, *  , WU Hong-Yi
2 ]
, WU Hong-Yi|
|


Most methods of homogenization of climate data are applied to time series of a single variable, such as daily maximum temperature ( Tmax) or daily minimum temperature ( Tmin). Consequently, the physical relationship among different variables, e.g., Tmax> Tmin, may be distorted after homogenization of climate series of individual variables. The authors develop a solution to improve consistency among diurnal temperature records, while using the Multiple Analysis of Series for Homogenization (MASH) method to homogenize the observation series of daily mean temperature ( Tm), Tmin, and Tmax at 545 stations in China for the period 1960-2011, called CHTM2.0. In the previous version of this homogenized dataset based on MASH (CHTM1.0) for the period 1960-2008, there are a few records (0.039% of the total) that are physically inconsistent. For developing CHTM2.0, the authors apply additional adjustments for each day with inconsistent temperature records, in order to hold Tmax> Tm> Tmin. Although the additional adjustments are barely influential for estimating long-term climate trends in China as a whole (because very few records are additionally adjusted), the newly introduced solution improves the physical consistency throughout the dataset. It is also helpful for developing more reasonable homogenized climate datasets with regard to physical consistency among multiple variables. Based on CHTM2.0, the annual Tmax/ Tm/ Tmin series averaged over China for the period 1960-2011 show significant warming trends of about 0.19/0.25/0.34°C per decade, respectively. Large warming trends of up to 0.425/0.596/ 0.704°C per decade occur in northeastern and northwestern China.
Long-term series of climate observations are useful for studying climate variability and trends. However, most of the climate series contain biases due to changes of observing location, environs, instrumentation, or algorithms for calculating the climate variables (Tuomenvirta, 2001; Begert et al., 2005; Auer et al., 2007; Yan and Jones, 2008). These biases make the climate series inhomogeneous. Inhomogeneity of climate series can considerably distort the estimation of climate trends, variability, and extremes.
Many methods have been developed to homogenize climate series (e.g., Standard Normal Homogeneity Test (SNHT; Alexandersson, 1986); Easterling-Peterson technique (EPT; Easterling and Peterson, 1995); Multiple Analysis of Series for Homogenization (MASH; Szentimrey, 1999); Two-Phase Regression (TPR; Lund and Reeves, 2002); Higher-order Moments (HOM; Della- Marta and Wanner, 2006); RHtests (Wang et al., 2007); Genetic Algorithm Hidden Markov models for Detection of Inhomogeneities (GAHMDI; Toreti al., 2012); and the wavelet-based method (Li et al., 2014)). Most of the methods have been applied and proved efficient for a single variable, e.g., for temperature (Vincent et al., 2002; Brandsma and Kö nnen, 2006; Li et al., 2009; Li and Yan, 2009; Trewin, 2013; Wang et al., 2013). It is true that, compared with the original series, the homogenized one based on each of the above-mentioned methods improves the data quality. However, homogenization of a single variable series tends to ignore the physical relationships among different climate variables (Wan et al., 2010; Yan et al., 2014).
This paper introduces a solution to improve the physical consistency among the daily maximum, mean, and minimum temperature records (Tmax, Tm, and Tmin), while using MASH method to develop a homogenized dataset of daily Tmax/Tm/Tmin series at 545 stations in China for the period 1960-2011; namely, CHTM2.0, which is an updated version of CHTM1.0 (Li and Yan, 2009). Case analyses for two stations are used to show how the additional adjustments are able to maintain the physical consistency among the three temperature indices. The data and methods are explained in section 2, section 3 presents the results, and section 4 concludes with a discussion.
Observed daily Tmax/Tm/Tmin records at 752 ‘ national stations’ in China, produced by the National Meteorological Information Center (NMIC) of the China Meteorological Administration, are downloaded from http://cdc. cma.gov.cn/home.do. This dataset was first released in 2005, with new data added every year. Tmax (Tmin) is the highest (lowest) value of temperature records during a day, and Tm is the mean of records at 0200, 0800, 1400, and 2000 Beijing Time (BT). In the present study, 545 stations are chosen without a missing record year during the period 1960-2011. A missing record year is defined as a year with missing codes for more than eight consecutive months or for more than 300 days. Compared with CHTM1.0, three stations (Baoshan, Hongkong, and Macau) are added in the updated dataset, CHTM2.0. However, seven stations (Hegang, Caijiahu, Yangquan, Laiyang, Shidao, Pingwu, and Longquan) are excluded, as they have been relegated to ‘ general stations’ since 2008 and lack updated records.
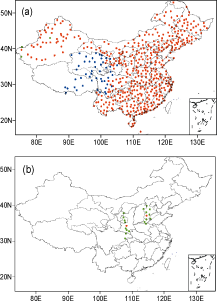
Figure 1a shows the geographical distribution of the 545 chosen stations. Considering the possible effects of elevation on the results of homogenization, we select 49 stations (blue dots) with an elevation above 2400β m, mainly in southwestern China, as one (mountain) group, and the other 496 stations (red dots), which are below 2400β m, as the other group for applying MASH. Considering geographical consistency, three high-elevation stations (Bayinbuluke, Tashkurghan, and Turgart; green dots) in Xinjiang Uygur Autonomous Region, northwestern China, are included in the second group. Figure 1b marks the locations of the two case stations (Wugong (WG), Shaanxi Province and Xingtai (XT), Hebei Province; red dots) and the corresponding nine reference stations (green dots) for each case station used in MASH.
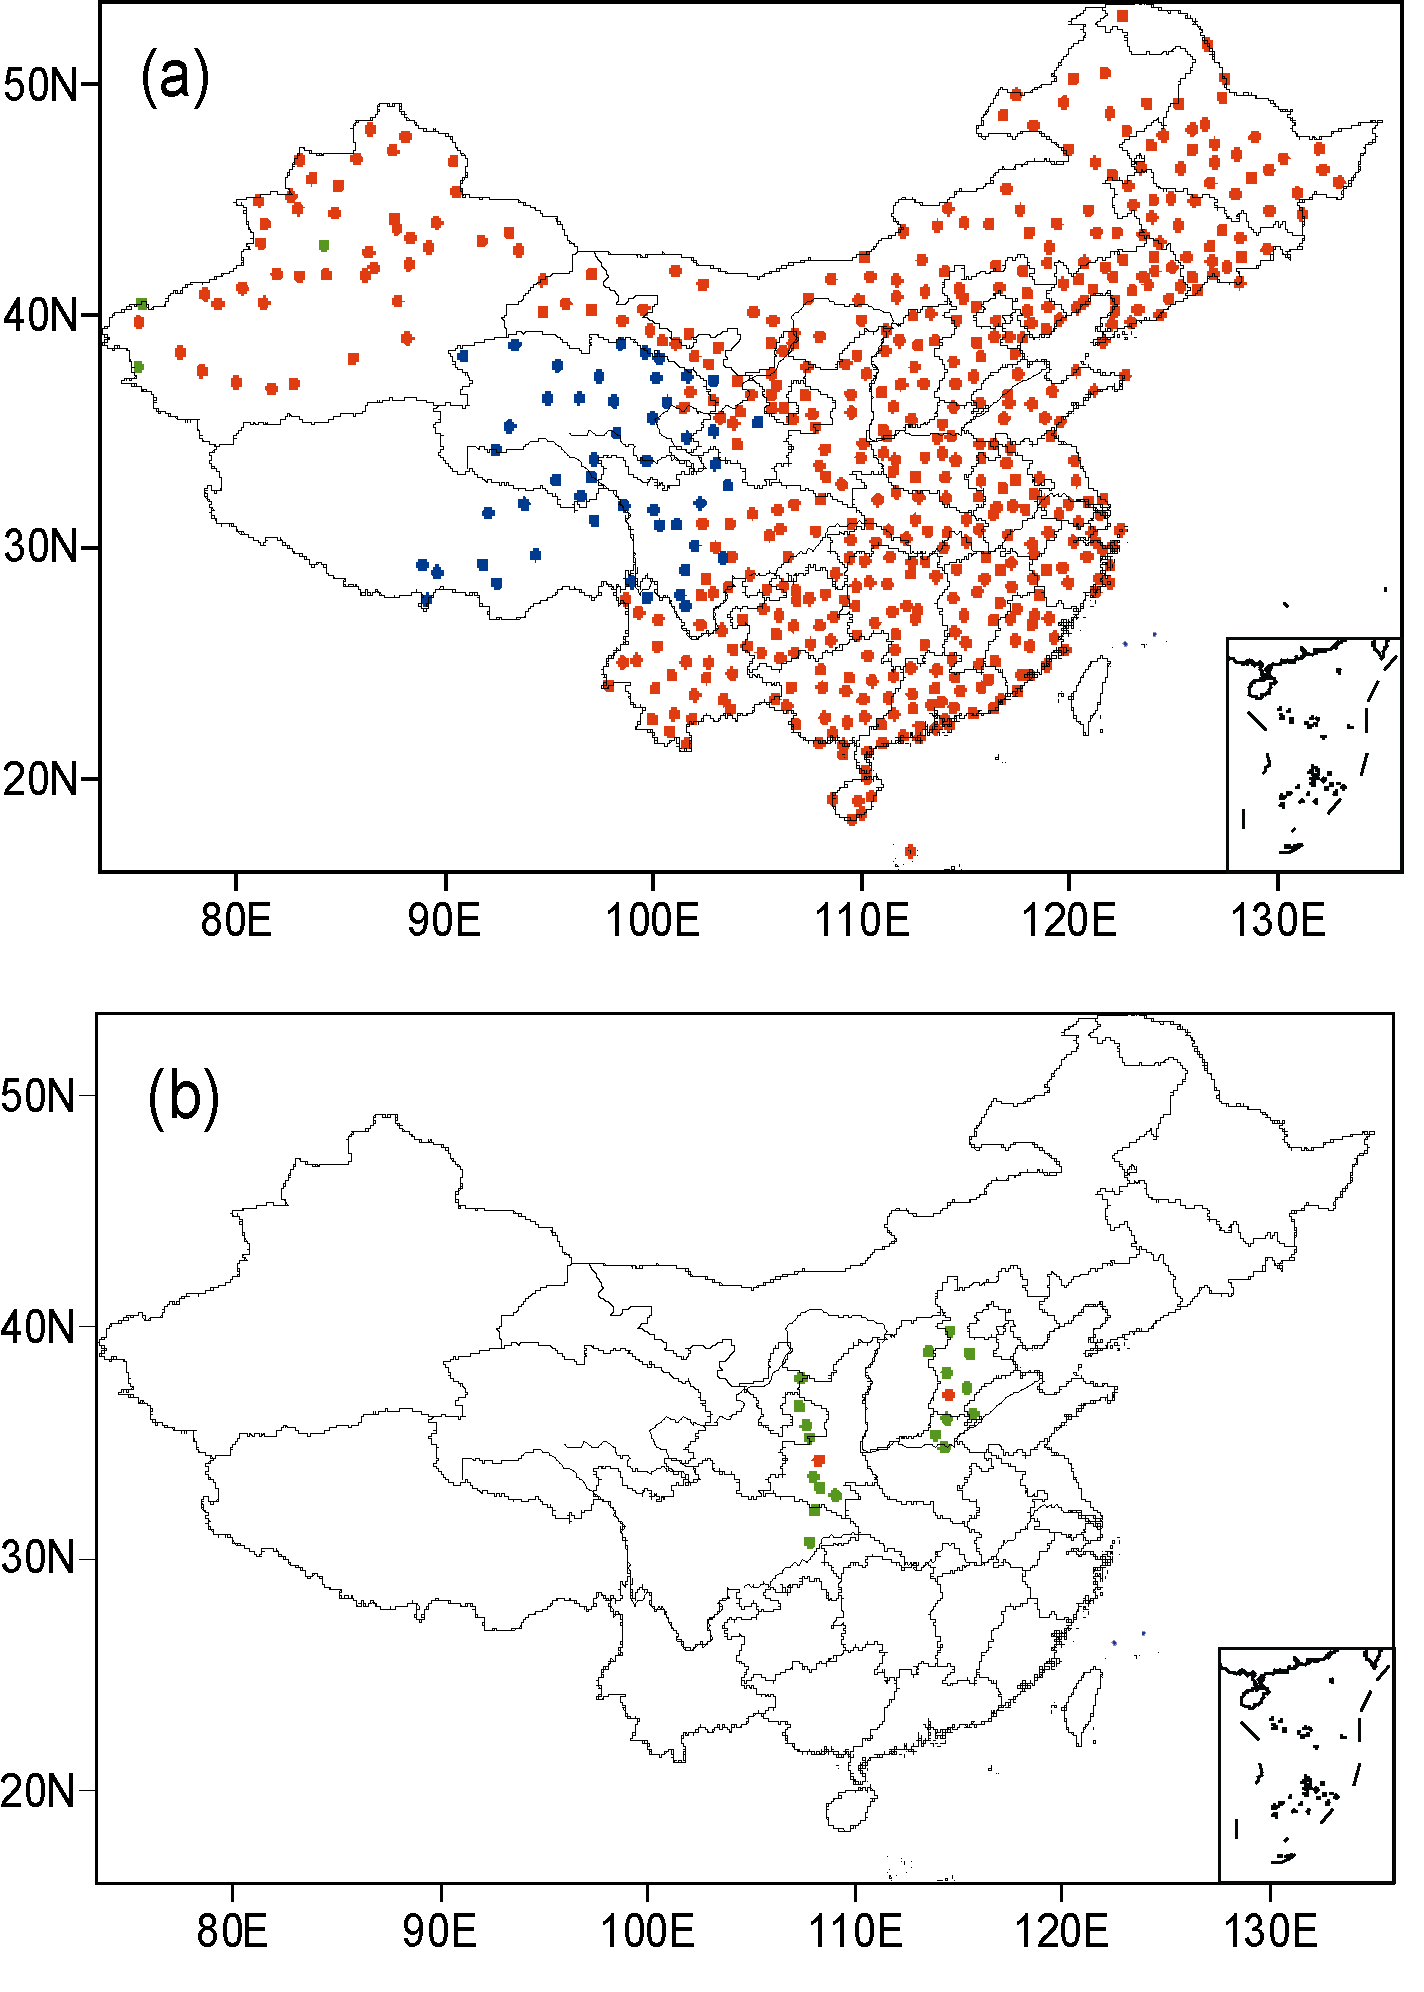 | Figure 1 (a) Geographical distribution of 545 meteorological stations in China. Blue dots: above 2400β m; red dots: below 2400β m; blue dots: above 2400β m in Xinjiang. (b) Two case stations (red dots) and nine corresponding reference stations (green dots) used in the Multiple Analysis of Series for Homogenization (MASH). |
The new version, MASHv3.03, can detect break points due to relocations and other non-natural factors and adjust inhomogeneities in daily series. It also applies quality control of daily data and missing data completion in one software package. MASH is essentially an objective method and consists of an iterative procedure to detect and adjust possible break points through mutual comparisons of series within the same climatic area based on tests of hypotheses at a given significance level. Depending on the distribution of temperature, the additive model should be applied. In recent years, MASH has been applied to homogenize daily or monthly data in various regions over the world (Manton et al., 2001; Rasol et al., 2011; Lakatos et al., 2008; Birsan and Dumitrescu, 2014; Né meth et al., 2014). In China, it has been used to homogenize daily temperature series (Li and Yan, 2010) and wind speed series (Li et al., 2011) in the greater Beijing area and daily Tmax/Tm/Tmin series in China (Li and Yan, 2009). These studies have shown that MASH is a suitable homogenization technique for a large number of stations in China. Technical details of MASH are available in the online manual at http://www.met.hu/en/omsz/rendezvenyek/homogenization_and_interpolation/software/.
Diurnal temperature records must be physically consistent, i.e., Tmax> Tm> Tmin for each day. In the processing procedure of MASH, the three temperature series are homogenized separately. This relationship can be broken once the three temperature variables series are adjusted, especially when the three original temperature records are very close to each other. For instance, bias in one of the original temperature series (e.g., Tmin) is detected as significant compared with the surrounding reference stations and hence adjusted, but no significant biases are detected for the same time in the other two series. This may result in Tmin> Tm after homogenization. This is obviously wrong in terms of physical climatology.
To solve the problem of physical inconsistency (PI), which is likely due to over-adjustment of the daily records, we revise the adjustments for those problematic days as follows:Step 1: Keep the adjustment with minimum absolute magnitude among the three temperature records (e.g., Tm) unchanged.
Step 2: Reduce the adjustment magnitudes by half for the other two records (e.g., Tmax and Tmin).
Then, repeat these two steps until the three temperature records are physically consistent, i.e., Tmax> Tm> Tmin, for all record days.
These additional adjustments do not overturn the results of homogenization, but for a small number of records, the adjustments based on MASH are revised (reduced) so as to keep the physical consistency among the diurnal temperature records.
There are five types of PIs: (1) Tm≤ Tmin≤ Tmax; (2) Tm≤ Tmax≤ Tmin; (3) Tmin≤ Tmax≤ Tm; (4) Tmax≤ Tmin≤ Tm; and (5) Tmax≤ Tm≤ Tmin. There are 20 days of PI in the original 545-station dataset, involving 12 stations. As the number of days with PI is small, we set the Tmax/Tm/Tmin records for these days as missing codes before applying MASH. However, after homogenization with MASH, there are 4409 days of PIs, involving 263 stations, accounting for 0.042% of the total number of days (10351185 days = 18993 days × 545 stations). The number of days with PIs of each type is 3191, 117, 978, 86, and 37. The number of Type 1 PIs is the most.
PI of diurnal temperature records is quite a common problem, because homogenization is usually performed on time series of a single variable, without consideration of the physical relationships among different variables. For instance, PI also exists in the unreleased monthly Tmax/Tm/Tmin dataset of 825 stations in China for 1951-2010 developed at the NMIC and based on RHtestsV3 (Wang et al., 2007), in which there are 205 months with PI, accounting for 0.035% of the total record months. For comparison, PI does not exist for monthly mean Tmax/Tm/Tmin in the present MASH-based homogenized dataset. This implies that adjustments of inhomogeneities based on MASH are in general smaller in magnitude than the other methods. Having applied the idea presented in this paper, NIMC recently released a 2400-station temperature dataset, V3.0, free of PI.
By applying the additional adjustment proposed in the present study, we develop an updated homogenized daily temperature dataset for China, CHTM2.0, which is free of PI. The number of days with PIs is reduced from 4409 days to 332 days after one round of steps 1 and 2, to 26 days after a second round, and to 2 days after a third round. After four rounds of revision, all days with PIs are adjusted. Because the number of days of PI is small (0.042% of the total records), the present revised adjustments are barely influential for estimating climate changes in the time series, but they do improve the physical consistency throughout the dataset.
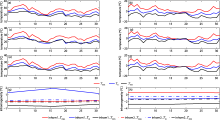
To help understand how the additional adjustments work, we take two stations (WG and XT) as examples. Figure 2 shows the daily Tmax/Tm/Tmin records during August 1960 at WG station and January 1960 at XT station, including the original, MASH-based homogenized, and CHTM2.0 series. It also shows the corresponding MASH-based inhomogeneities (inhom1), i.e., the original minus MASH-adjusted result, and the CHTM2.0 ones (inhom2), i.e., the original minus the finally-adjusted result.
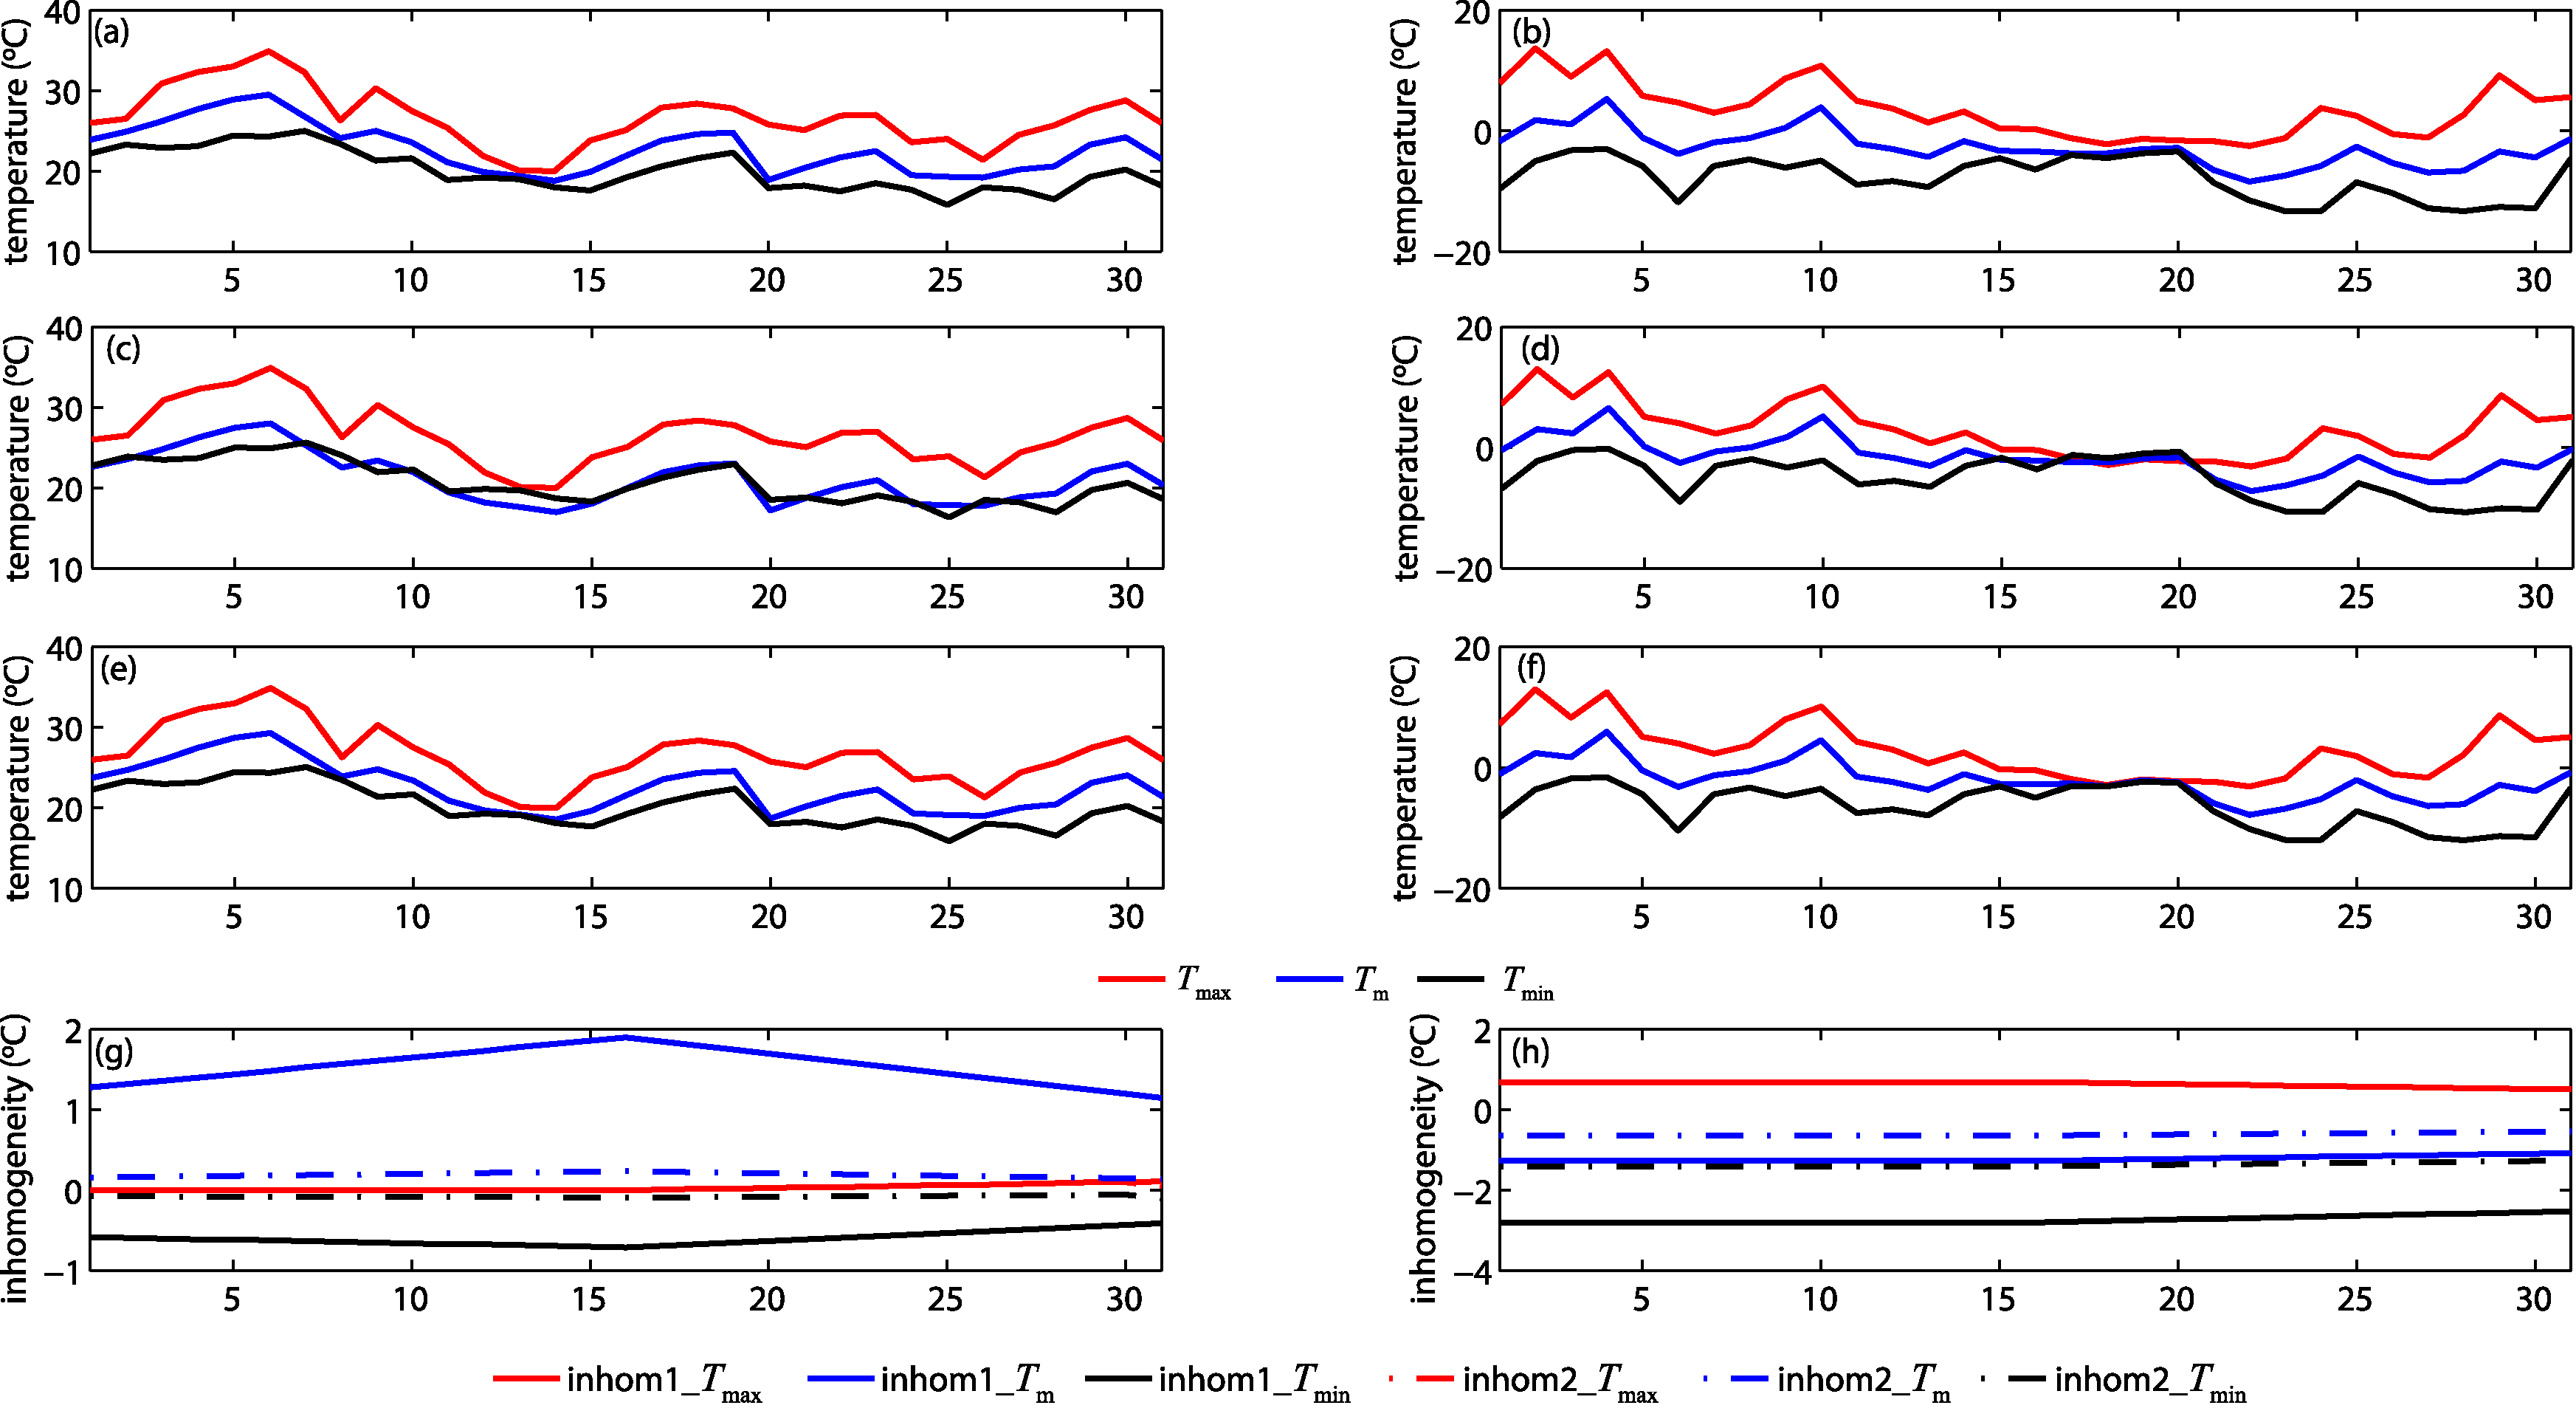 | Figure 2 The (a, b) original, (c, d) MASH-based adjusted, and (e, f) final results of Tmax/Tm/Tmin records for August 1960 at Wugong (WG), Shaanxi Province (left column) and for January 1960 at Xingtai (XT), Hebei Province (right column). Panels (g, h) are the corresponding MASH-based inhomogeneities (inhom1: the original minus MASH-adjusted result) and CHTM2.0 ones (inhom2: the original minus the final result), respectively, of Tmax/Tm/Tmin records. |
For WG, Fig. 2a shows that Tm is very close to Tmin for a few days of August 1960 in the original series, reflecting very cloudy weather conditions at the station for these days. In the adjusted series based on MASH (Fig. 2c), there are 14 days of PIs showing Tm< Tmin. As Fig. 2g shows, the inhomogeneity estimated by MASH for Tmax is negligible (between 0 and 0.11° C); for Tm, the inhomogeneity ranges from 1.15 to 1.90° C; and for Tmin, it ranges from -0.71 to -0.41° C. It is likely that MASH overestimates the magnitudes of inhomogeneity in Tm and Tmin, especially for this particular month. To keep consistency among the diurnal temperature records, we hold the inhomogeneity magnitude of Tmax based on MASH, while reduce those for Tm and Tmin by half for this month and repeat this process until the three temperature records are physically consistent for all days. Figure 2e shows the final homogenized result of CHTM2.0, which is free of PIs and retains the cloudy weather feature for those days.
The second example is XT station (Figs. 2b, 2d, 2f, and 2h). In the original series, the records of Tm and Tmin are very close to each other on 17-20 January 1960 (Fig. 2b), reflecting some cloudy weather conditions for these days. After the series is homogenized via MASH, Tmin becomes higher than Tm and even Tmax for these four days (Fig. 2d). The estimated inhomogeneity is negative for Tm (-1.27 to -1.07° C) and Tmin (-2.80 to -2.52° C), while it is positive and with the smallest magnitude of inhomogeneity (0.51 to 0.69° C) for Tmax throughout the month (Fig. 2h). By keeping the MASH-based inhomogeneity for Tmax and reducing those for Tm and Tmin by half (Fig. 2h), the three temperature records become physically consistent (Fig. 2f).
According to the above cases, we infer that PI in the MASH-based homogenized dataset is prone to appear on cloudy days, when in general the three original temperature records are close to each other. Although there could be more physically confined solutions for PI, the above two cases demonstrate that the present solution is efficient for solving the PI problem in the MASH-based homogenized observation series of the different temperature variables.
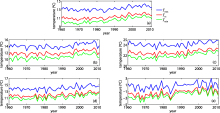
The linear trends of China-average annual and seasonal mean Tmax/Tm/Tmin series during 1960-2011 are shown in Fig. 3. The seasons are conventionally defined as spring (March-April-May; MAM), summer (June-July-August; JJA), autumn (September-October-November; SON), and winter (December-January-February; DJF). The homogenized annual Tm series for China exhibit significant warming trends (at the 0.05 significance level) of about 0.25° C per decade during 1960-2011. In comparison, that of Tmax is smaller, at about 0.19° C per decade; and that of Tmin is larger, at about 0.34° C per decade (Fig. 3a). The four seasonal Tm series for China also exhibit significant warming trends, at about 0.239, 0.168, 0.255, and 0.356° C per decade for spring, summer, autumn, and winter, respectively. Those of Tmax are smaller, at about 0.186, 0.120, 0.225, and 0.236° C per decade; and those of Tmin are larger, at about 0.319, 0.252, 0.320, and 0.483° C per decade (Figs. 3b-e). As has been discussed extensively in many previous studies, Fig. 3 indicates that the warming trends are largest for winter and smallest for summer, and more prominent in Tmin than in Tmax in China as a whole for the last half century. The annual and seasonal China- average warming trends during 1960-2011 are slightly smaller than the average of the 549 stations during 1960-2008 (CHTM1.0), except for summer Tmax/Tm/Tmin and autumn Tmin. The differences of trends in China mean series between the original and homogenized data are not large, because inhomogeneities at different stations cause different effects on the long-term trends, which are compensated by each other when calculating the average series over the whole country.
 | Figure 3 China-average (a) annual, (b) spring, (c) summer, (d) autumn, and (e) winter Tmax, Tm, and Tmin series and corresponding linear trends (° C per decade) during 1960-2011, based on the updated homogenized dataset, CHTM2.0. A constant of 4° C is added to (taken from) the series of Tmin (Tmax) to make the figures compact. |
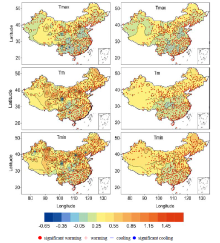
In order to further show the influence of inhomogeneity on trend estimation, the geographical patterns of annual trends in the original and adjusted dataset covering the whole period of 1960-2011 in China are given in Fig. 4. An impressive contrast is that the adjusted data show warming trends for all the annual temperature series during 1960-2011 at all 545 stations (significant at 457/536/ 545 stations for Tmax/Tm/Tmin), while the original data exhibit negative trends at 12/10/10 stations (significant at 3/2/4 stations). As Fig. 4 shows, warming trends in the annual mean temperature prevail all over China, though the trends are insignificant at some stations mainly in southwestern China, according to the homogenized data. The warming trends are largest in the northeast (mainly in Heilongjiang and Inner Mongolia) and northwest (mainly in Xinjiang, Qinghai, and Ningxia) of China, at up to 0.425, 0.596, and 0.704° C per decade for Tmax, Tm, and Tmin, respectively. The large-scale patterns of climate warming in China during the last half century are clear. In contrast, the original data exhibit quite a lot of local trends that are inconsistent with surrounding observations.
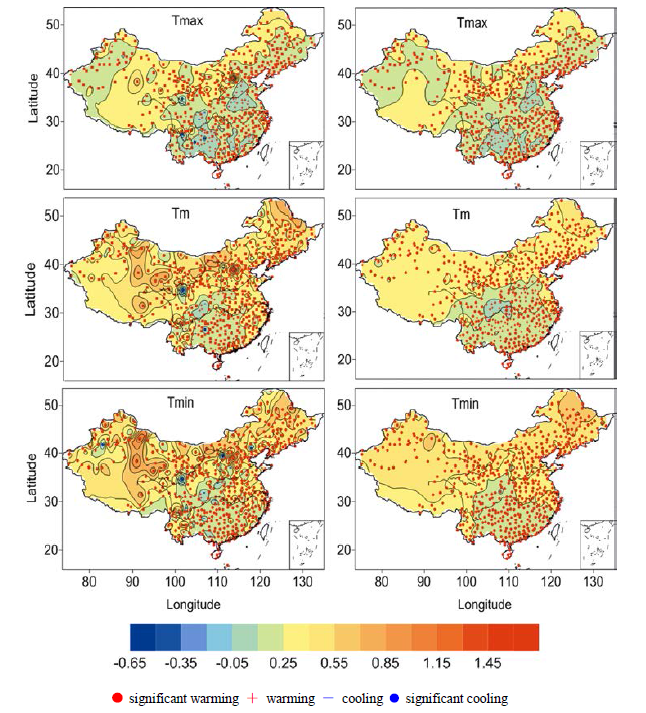 | Figure 4 Linear trends (° C per decade) in annual Tm/Tmax/Tmin series at 545 stations during 1960-2011, compared between the original (left column) and adjusted (right column) data. |
The seasonal cases for spring, autumn, and winter are similar to the annual case, with more profound warming trends in northern China and negative trends at some stations mainly to the east of the Tibetan Plateau. However, for summer, the adjusted data exhibit negative trends at a considerably large number of stations, mainly in the mid-lower reaches of the Yangtze and Yellow rivers, especially for Tmax (figures omitted).
Physical inconsistency is an unavoidable problem because conventional homogenization based on most of existing methods is made for time series of one climate variable and without consideration of physical relationships between different variables. It is also a prominent problem facing homogenization research. Here, a special method is developed to solve the PI problem among the diurnal temperature records in the adjusted dataset for China.
The homogenized daily temperature dataset for China for the period 1960-2011 based on MASH contains a small number of inconsistent daily records. Through four rounds of revision, all days with PIs are additionally adjusted. Case analyses for two stations indicate that for some days when the original three temperature records are very close to each other, i.e., in very cloudy weather conditions, adjusting any one of the records could break the physical consistency among the three variables. The revised adjustments for PIs based on the new method are barely influential for estimating long-term climate changes in the time series, but they do improve the physical consistency throughout the dataset. However, there is still potential for developing homogenization methods with respect to physical constraints among multiple variables. It is a highly desirable development and will potentially lead to a breakthrough in the field of homogenization.
Based on the new dataset, CHTM2.0, we show an average (over China) warming trend of 0.192, 0.254, and 0.343° C per decade for annual Tmax/Tm/Tmin series during 1960-2011. The new dataset exhibits considerable improvements for estimating local climate trends and hence the geographical patterns of climate changes in China. In particular, the homogenized dataset shows warming trends in the annual mean temperature series at all 545 stations, while the original dataset exhibits some cooling trends at some stations and very large warming trends at a few other stations, which distort the geographical pattern of climate changes.
The homogenized temperature dataset (CHTM2.0) can undoubtedly serve as an improved database for studying large-scale structures of climate changes in China, and can also be used to validate climate model results after rational gridding, as achieved by some previous studies (Xu et al., 2009; Wu and Gao, 2013). CHTM2.0 is freely available from http://159.226.234.56/.
Acknowledgements
This study was supported by the Strategic Priority Research Program of the Chinese Academy of Sciences (Grant No. XDA05090105), the National Department Public Benefit Research Foundation of China (Grant No. GYHY201206013), the State Programs of Science and Technology Development (Grant No. 2012BAC22B04), and the Urban Meteorological Science Research Foundation (UMRF201211). WU Hongyi was supported by the Science and Technology Program of Institute of Urban Meteorology (Grant No. IUMKY201302PP0102).
| 1 |
|
| 2 |
|
| 3 |
|
| 4 |
|
| 5 |
|
| 6 |
|
| 7 |
|
| 8 |
|
| 9 |
|
| 10 |
|
| 11 |
|
| 12 |
|
| 13 |
|
| 14 |
|
| 15 |
|
| 16 |
|
| 17 |
|
| 18 |
|
| 19 |
|
| 20 |
|
| 21 |
|
| 22 |
|
| 23 |
|
| 24 |
|
| 25 |
|
| 26 |
|
| 27 |
|
| 28 |
|
| 29 |
|