


Arctic Sea Ice Decline Intensified Haze Pollution in Eastern China
[WANG Hui-Jun1, 2, 3  , CHEN Huo-Po
1, 2, 3 , LIU Jiping4 ]
, CHEN Huo-Po|
|


Air quality in eastern China has becoming more and more worrying in recent years, and haze is now No.1 air pollution issue. Results in this study show the decreasing Arctic sea ice (ASI) is an important contributor to the recent increased haze days in eastern China. The authors find that the number of winter haze days (WHD) in eastern China is strongly negatively correlated with the preceding autumn ASI during 1979-2012, and about 45%- 67% of the WHD interannual to interdecadal variability can be explained by ASI variability. Following previous studies on the impact of ASI loss on the northern hemisphere climate, the authors’ studies further reveal that the reduction of autumn ASI leads to positive sea-level pressure anomalies in mid-latitude Eurasia, northward shift of track of cyclone activity in China, and weak Rossby wave activity in eastern China south of 40°N during winter season. These atmospheric circulation changes favor less cyclone activity and more stable atmosphere in eastern China, leading to more haze days there. Furthermore, the patterns of circulation changes associated with autumn ASI and WHD are in very good agreement over the East Asia, particularly in eastern China. The authors suggest that haze pollution may continue to be a serious issue in the near future as the decline of ASI continues under global warming.
Associated with recent intensification of air pollution in eastern China, more haze days with increased PM2.5 (particulate matter) concentration have been detected during winter and spring. Haze affects the lives of hundreds million people in eastern China. Haze not only delays traffic but also can induce serious health problems from respiratory illnesses to heart disease, premature death, and cancer, i.e., in Beijing, the terrible weather has led to record high hospital visits in a decade (Pope and Dockery, 2006; Wang and Mauzerall, 2006; Xie et al., 2014). Early studies have suggested that the increased emissions of pollutants into the atmosphere due to rapid economic development and urbanization in China is the major contributor to increased haze days (Liu and Diamond, 2005; Wang et al., 2013), i.e., a recent analysis suggested that in Beijing, vehicles are the biggest source of PM2.5, accounting for 25% of the pollution, and coal combustion and cross-regional transfer are secondary, accounting for 19% respectively (He et al., 2013).
In comparison, the potential role of climate variability and change has received little attention. The increased haze days coincide with a period of rapid decline of Arctic sea ice (ASI). There is growing evidence that decreasing ASI is influencing the northern mid- and high-latitude climate (Deser et al., 2010; Liu et al., 2012; Li and Wang, 2013, 2014). In this study, we single out ASI as an important driver of increased haze days in eastern China in recent decades and reveal the physical mechanism underlining their connectivity using observational data and numerical simulation.
The monthly site records of haze days in China during 1979-2013 have been collected by the National Meteorological Information Center of the China Meteorological Administration, including 756 meteorological stations. The homogeneity and reliability of this dataset have been checked. Here we confine the analysis to quality-controlled data. For the site-observation, it will be rejected if there are miss values in time series. Accordingly, a subset of 542 stations is selected in China. The haze days often occurred over eastern China (east of 20-40° N, 109° E) in recent years, which is considered as the target region in this study. The time series of the haze days is defined as the averages from 211 stations in the study region. Additionally, the historical records indicate that more than 40% occurrences of haze days can be observed in boreal winter (December-January-February, DJF) in this region. Thus, here we focus on the winter season. The data of ASI extent is calculated from the Hadley Centre (HadISST1: Hadley Centre SST data set) with 1° × 1° resolution for 1870-2013 (Rayner et al., 2003). The autumn ASI index is calculated as the area-averaged sea ice extent in the region of north 45° N. The Arctic Oscillation (AO) and Niñ o3.4 indices are obtained from the Climate Prediction Center (CPC) of the National Oceanic and Atmospheric
Administration (NOAA). Three atmospheric reanalyses are used in this study: 1) The NCEP (National Centers for Environmental Prediction) Climate Forecast System Re-analysis (CFSR) from 1979 to 2009, with the resolution of 2.5° × 2.5° ; 2) The European Centre for Medium-Range Weather Forecasts (ECMWF) interim reanalysis from 1979 to present with the resolution of 1.5° × 1.5° ; 3) The NCEP-DOE (Department of Energy) reanalysis 2 from 1979 to present, with the resolution of 2.5° × 2.5° . Furthermore, the simulations of 28 Coupled Model Intercomparison Project Phase 5 (CMIP5; Table 1) models are also used here to facilitate the discussion of the projected changes of haze and associated atmospheric conditions in near future (2016- 2035). For convenient analysis, these simulations are firstly resampled to the common grid of 2.5° × 2.5° , and then the multiple model ensemble mean (MME) is calculated.
| Table 1 List of 28 CMIP5 models used in this study. |
Here we define the winter haze days (WHD) index as the number of haze days during winter (average of DJF) in eastern China (20-40° N, 109-122.5° E). From 1979 onwards, particularly from the late 1990s, the WHD index has increased remarkably (red line in Fig. 1). Meanwhile, the autumn (average of September, October, and November) ASI has decreased substantially (blue line in Fig. 1). The two indices are strongly negatively correlated (correlation coefficient r = -0.82). After removing the linear trend, the correlation is still strong (r = -0.67, above 99% confidence level), suggesting year-to-year variability of the WHD is closely associated with autumn ASI variability.
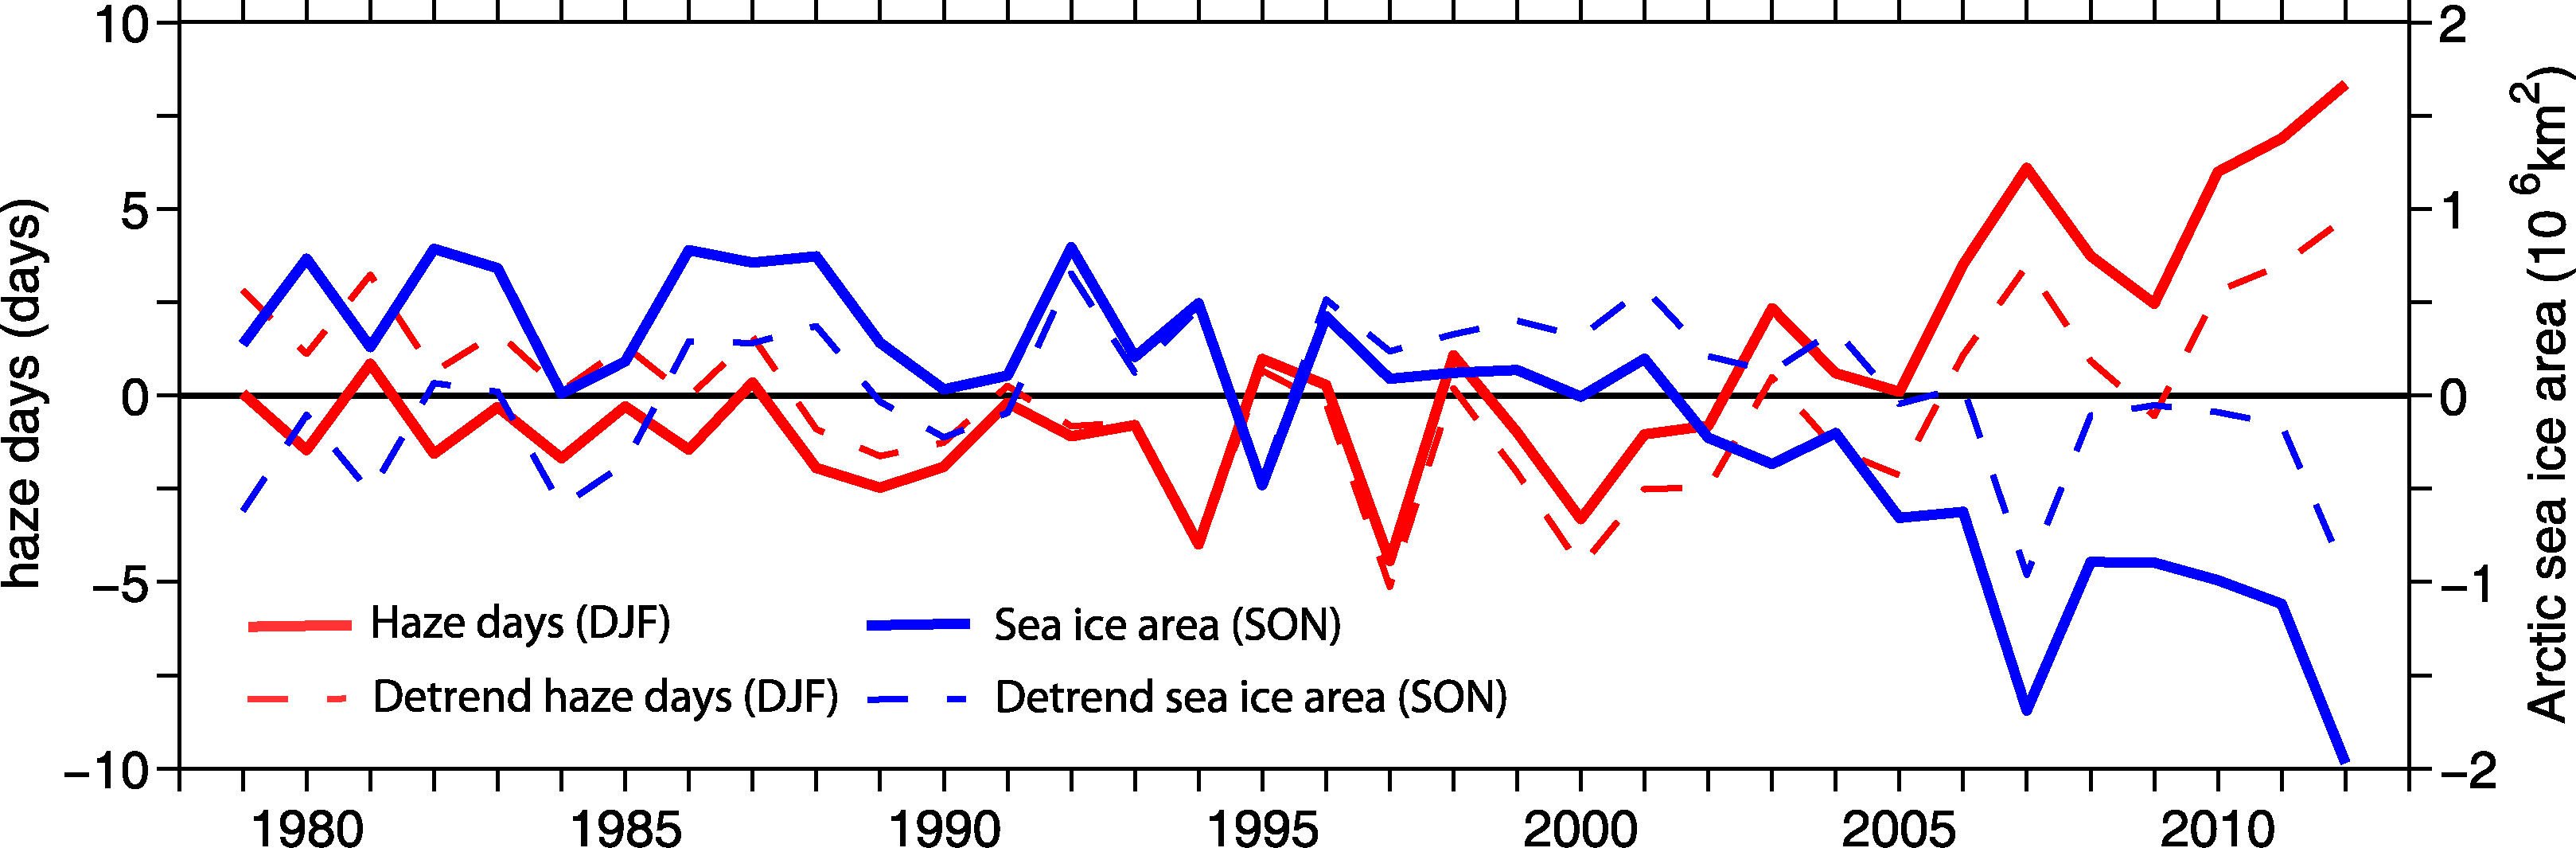 | Figure 1 Time series of winter haze day (WHD; in red) and preceding autumn Arctic sea ice extent (ASI; in blue) anomalies, with solid and dashed lines for the original and detrended series respectively. The WHD is defined as the number of site-observed haze days during December-January-February in eastern China south of 40° N (20-40° N, 109-122.5° E), and the autumn ASI is the averaged sea ice extent for September-October-November. The anomalies are computed with respect to the period 1981-2010. |
We also compute the correlation between the WHD and dominant modes of northern hemisphere winter climate variability, including the El Niñ o-Southern Oscillation (ENSO) and AO. It appears that the WHD has weak correlation with the winter ENSO (-0.34 and -0.30), and almost no correlation with the winter AO (-0.12 and -0.06) for the original and detrended time series during 1979-2012. Hence the autumn ASI is more influential to the frequency of winter haze weather as compared to the ENSO and AO.
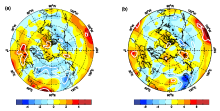
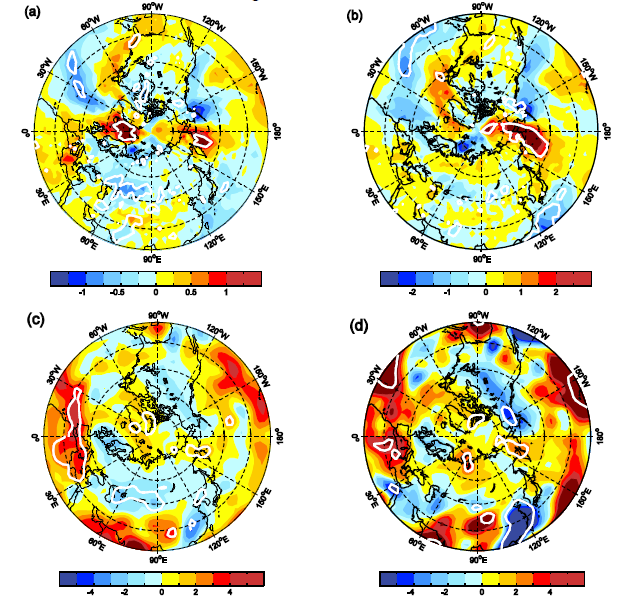
Regressions of winter atmospheric circulation anomalies onto the WHD index and autumn ASI are used to reveal the connections between the haze days and ASI extent. Caution is required when regressions between two variables that one or both have pronounced trends. To circumvent this possibility, we focus on the regressions using detrended data. The regression map of sea-level pressure (SLP) shows that the occurrence of winter haze weather is accompanied with positive SLP anomalies over eastern and central-north China (Fig. 2b), which extend from northern Europe and the Arctic Ocean. Meanwhile, there is a dipole pattern in the Europe and north Atlantic region. As shown in Figs. 2a and 2b, the SLP pattern linked to the ASI well resembles that associated with the WHD in Eurasia, the north Atlantic, and the north Pacific.
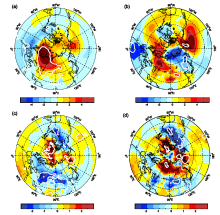
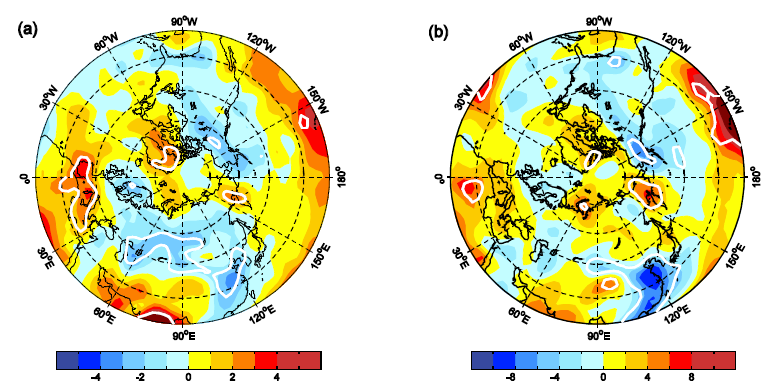
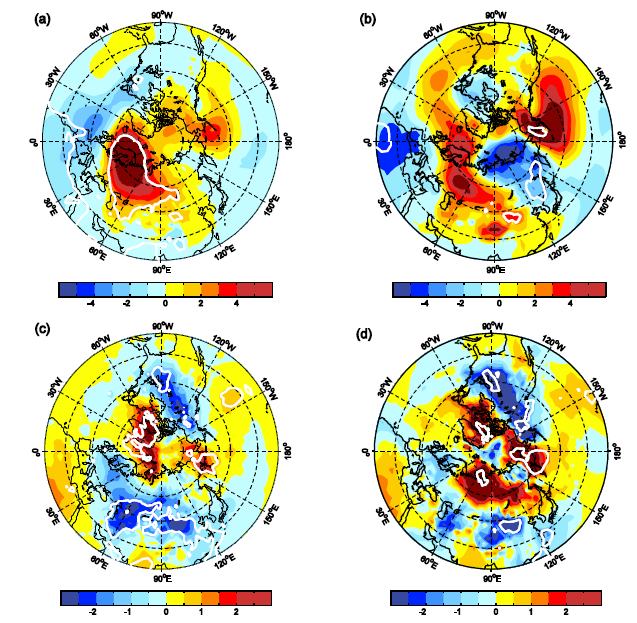 | Figure 2 Regression maps of (a, b) the sea-level pressure and (c, d) the near-surface air temperature anomalies against the ASI and WHD anomalies during 1979-2008, respectively: (a, c) ASI; (b, d) WHD. The ASI index in (a, c) has been multipled by -1.0 for convenient comparison. The linear trends of the indices, sea-level pressure, and near-surface air temperature have been removed before the regression analysis. The white line indicates significant regression at 95% confidence level with Student’ s t-test. |
Under such circulation change, the westerly/northwesterly winds blowing across eastern China are weakened. There is a shift to a more meridional anomalous wind pattern in winter (Fig. 3). This favors more frequent incursions of cold air from the Arctic into eastern and north China, leading to cold conditions there (Fig. 2). This might enhance the atmospheric temperature inversion in the lower atmosphere. Measurements from 211 meteoro-logical stations also indicate that the wind speed has weakened since the late 1970s, particularly after the late- 1990s (Fig. 3). As shown Fig. 4, both the ASI and WHD are associated with the reduced 10-m meridional and zonal wind speeds in eastern China (Fig. 5). In the mid-troposphere, 500 hPa geopotential height (Fig. 6) associated with the reduction of the autumn ASI exhibits negative height anomalies over eastern China, which is also in good agreement with those associated with the WHD. The positive SLP and negative 500-hPa geopotential height anomalies indicate sinking motions over eastern China. Hence the weakening wind speed and enhancing atmospheric temperature inversion remarkably reduce atmospheric circulation, which are unfavorable for the dispersion of pollutants, leading to high levels of fine particulate pollution, including PM2.5.
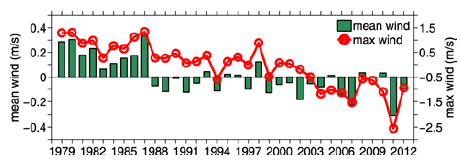 | Figure 3 Time series of the site-observed near-surface (10 m) mean and maximal wind speed anomalies in eastern China. As the WHD definition, these time series are averaged over 211-sites in eastern China from 1979-2012 and the anomalies are calculated with respect to 1981-2010. |
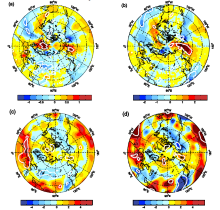
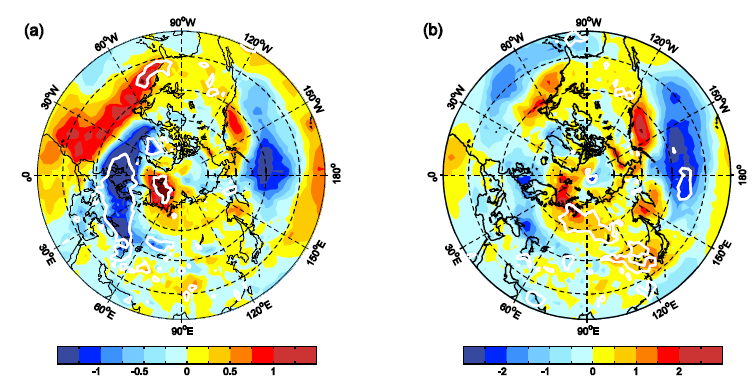
 | Figure 4 Regression maps of (a, b) the near-surface (10 m) meridional wind and (c, d) the specific humidity (850 hPa) anomalies against the ASI and WHD anomalies during 1979-2008, respectively: (a, c) ASI; (b, d) WHD. The ASI index in (a, c) has been multipled by -1.0 for convenient comparison. The linear trends of the indices, meridional wind, and specific humidity have been removed before the regression analysis. The white line indicates significant regression at 95% confidence level with Student’ s t-test. |
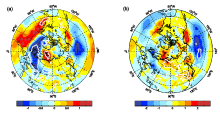
 | Figure 5 Regression maps of near-surface (10 m) zonal wind anomalies against the ASI and WHD anomalies during 1979-2008: (a) ASI and (b) WHD. The ASI index in (a) has been multiplied by -1.0 for convenient comparison. The linear trends of the indices and the zonal wind have been removed before the regression analysis. The white line indicated significant regression at 95% confidence level with Student’ s t-test. |
 | Figure 6 Regression maps of 500 hPa geopotential height anomalies against the ASI and WHD anomalies during 1979-2008: (a) ASI and (b) WHD. The ASI index in (a) has been multiplied by -1.0 for convenient comparison. The linear trends of the indices and the geopotential height have been removed before the regression analysis. The white line indicated significant regression at 95% confidence level with Student’ s t-test. |
Another important evidence of the ASI and WHD linkage can be found in the regressed fields of water vapor content at 850 hPa (Figs. 4c and 4d). There is a reduced water vapor content in the low-level atmosphere over the large area of East Asia associated with the ASI and WHD. Decreased water vapor content is one of the most important features for the haze weather. Therefore, the connection between the ASI and haze weather frequency can be adequately supported by the analysis on wind speed, water vapor content, and atmospheric circulation. The pollutants are then trapped and go through complicated reactions and transform from gas state to particulate matter.
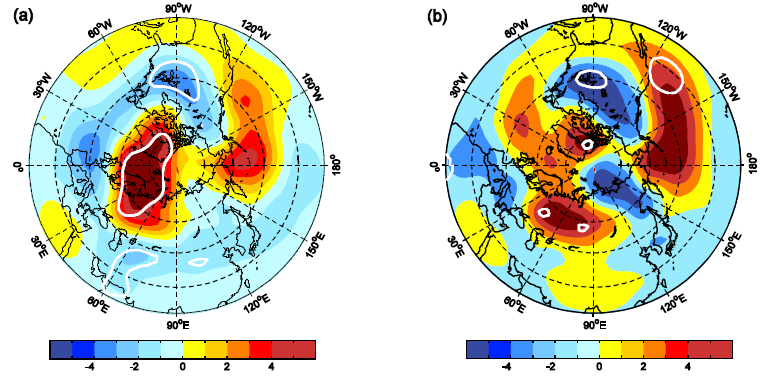
Our speculation surrounding the connection between the decline of autumn ASI and increased WHD is based on the following mechanisms. Recent studies suggested that the decline of autumn ASI leads to much broader meridional meanders in the atmospheric circulation and more frequent episodes of blocking patterns and cold surges over large parts of northern continents (Liu et al., 2012). This might result in more stable atmospheric condition in low latitude region of China. To testify this speculation, we compute the autumn ASI associated Rossby wave activity flux (Plumb, 1985). It shows centers of action in northern Asia, northern Atlantic-Europe, and northwestern Pacific. By contrast, large area of China south of 40° N has weak wave activity (Fig. 7a), suggesting value means more stable atmosphere). In comparison, the WHD associated Rossby wave activity flux has the centers of action in northern Asia, northern Europe, and northwestern Pacific (Fig. 7b), which is similar to Fig. 7a. This is further supported by the lower atmospheric stability analysis (Fig. 8). Both WHD and ASI based results show negative values in large part of eastern China (indicate more stable atmosphere).
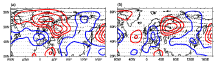
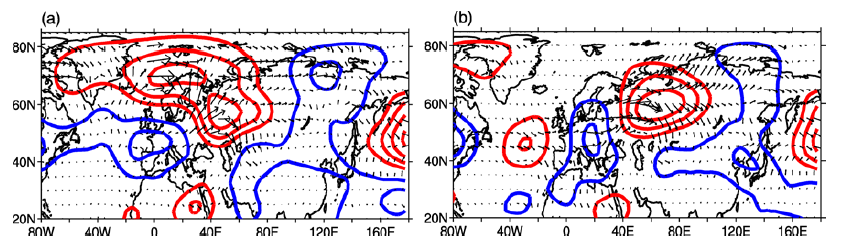 | Figure 7 Regression maps of the 500 hPa quasi-geostrophic streamfunction (contours: 106m2s-1) and wave activity flux (vectors: m2s-2): (a) ASI and (b) WHD. The ASI index in (a) has been multiplied by -1.0 for convenient comparison. The linear trends have been removed before the regression analysis. The quasi-geostrophic streamfunction and wave activity flux are computed according to Plumb’ s formulation (Plumb, 1985). |
 | Figure 8 Regression maps of the atmospheric stratification stability against the ASI and WHD anomalies during 1979-2008: (a) ASI and (b) WHD. The ASI index in (a) has been multiplied by -1.0 for convenient comparison. Their corresponding linear trends have been removed before the regression analysis. The white line indicated significant regression at 95% confidence level with Student’ s t-test. The atmospheric stratification stability is represented by the K index, which is computed by the following formulation: K = (T850- T500)+ Td850- (T-Td)700. Ti is the ith level air temperature and (Td)j is the dew point temperature at the jth level, which is estimated from the relative humidity and the actual air temperature based on the Magnus-Tetens approximation. K index is an integrative indicator of atmosphere stability and the moisture condition, and generally, the large value means more unstable of the atmospheric stratification. |
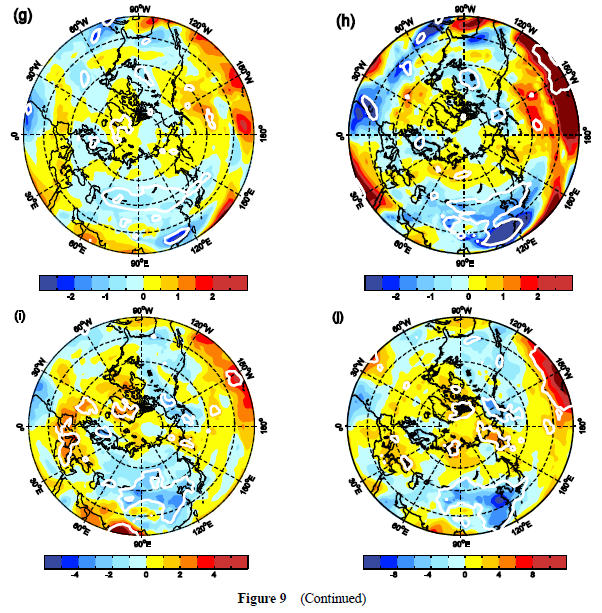
To confirm the robustness of the changes of atmospheric circulation linked to the reduction of sea ice identified using the NCEP CFSR (executed in a coupled atmosphere-ocean-sea ice system), we repeat the above analyses using another two reanalyses, the ERA-Interim (ECMWF Reanalysis) (Fig. 9) and the NCEP-DOE reanalysis 2 (Figures not shown; atmospheric model only reanalysis). The regression patterns of the associated circulations of these two reanalyses closely resemble to those of the CFSR.
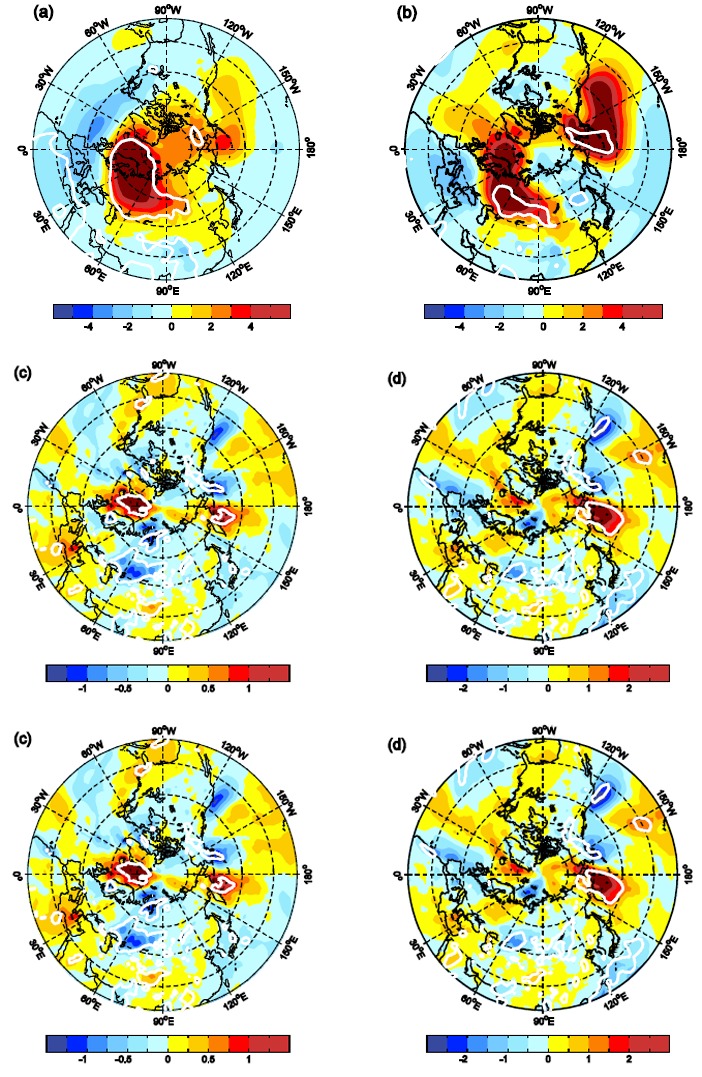 | Figure 9 Regression maps of the circulations against the ASI and WHD anomalies during 1979-2012. The left column shows the results of ASI and the right column shows the WHD. The top panels show the regression patterns of SLP; the top second panels show the results of the near-surface (10 m) meridional wind anomalies; the mid panels shows the near-surface (2 m) air temperature; the bottom second panels shows the results of the specific humidity over 850 hPa; and the bottom panels are the results of K index. The ASI index in the left column has been multiplied by -1.0 for convenient comparison. The linear trends of the indices and circulations have been removed before the regression analysis. The circulation data are derived from ERA-Interim. |
As shown by recent climate model projections (Kirtman et al., 2013), the ASI is projected to further decline in the future. Will the projected ASI loss further intensify the haze weather frequency in eastern China? We depicted the projected changes in winter atmospheric circulations for the period 2016-2035 in RCP4.5 (Representative Concentration Pathway) scenario with respect to 1986-2005 from the ensemble means of 28 CMIP5 simulations(Fig. 10). The spatial pattern of SLP or 500 hPa geopotential height changes for the period 2016-2035 do not resemble present autumn ASI associated pattern, and the low-level atmosphere tends to be more unstable in large part of China particularly in regions north of 40° N. However, the change of the atmospheric instability is quite small and the atmospheric humidity will decrease in eastern China. Thus there will be both favorable and unfavorable factors for haze weather frequency in the near future based on the model projections. Such uncertainty may be attributed to climate model uncertainty on the one hand, and to the complex climate change (e.g., change of SST) and the associated atmospheric circulation variation on the other hand.
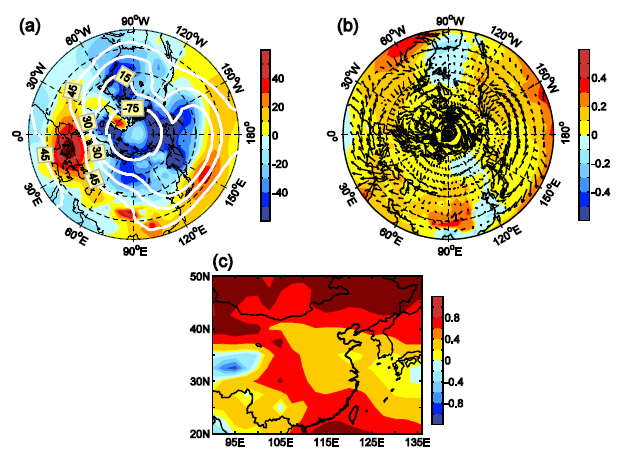 | Figure 10 Projection maps of the changes in winter atmospheric circulations. (a) sea-level pressure (shading, units: Pa) and 500 hPa geopotential height (contour, units: m). (b) near-surface wind (vector, units: m s-1) and 850 hPa specific humidity (shading, units: g kg-1). (c) K index (units: ° C). The changes are calculated for the near future of 2016-2035 with regard to 1986-2005 in Representative Concentration Pathway (RCP4.5) scenario from the ensemble means of 28 CMIP5 simulations. |
Acknowledgements
This research was supported by the National Natural Science Foundation of China (Grant Nos. 41421004 and 41210007). Thanks are due to Professor Yong CHEN for his constructive comments.
| 1 |
|
| 2 |
|
| 3 |
|
| 4 |
|
| 5 |
|
| 6 |
|
| 7 |
|
| 8 |
|
| 9 |
|
| 10 |
|
| 11 |
|
| 12 |
|
| 13 |
|